Alert fatigue is one of the most destructive forces in operations. I’ve been on teams where the on-call rotation was effectively unusable because the alert volume was so high that people started developing an immune response to pages. Every alert was potentially noise. Important alerts got buried. People started “acking and ignoring.” Then a real incident would happen and by the time anyone investigated, the blast radius had expanded significantly.
Traditional threshold-based monitoring creates this problem systematically. You set static thresholds (“alert if CPU > 80%”), those thresholds fire constantly during normal traffic spikes, and your team spends every on-call shift triaging false positives. The signal-to-noise ratio degrades until the monitoring system becomes background noise.
AIOps (Artificial Intelligence for IT Operations) is the application of machine learning to operations data to address these failures. Done well, it dramatically reduces alert noise, surfaces real problems faster, and accelerates incident response. Done badly, it’s an expensive layer of complexity that replaces known false-positive alerts with mysterious ML-generated alerts that nobody trusts.
Let me separate the signal from the noise here, explain what the technology actually does, and tell you what I’ve seen work versus what’s still marketing material.
What AIOps Actually Is
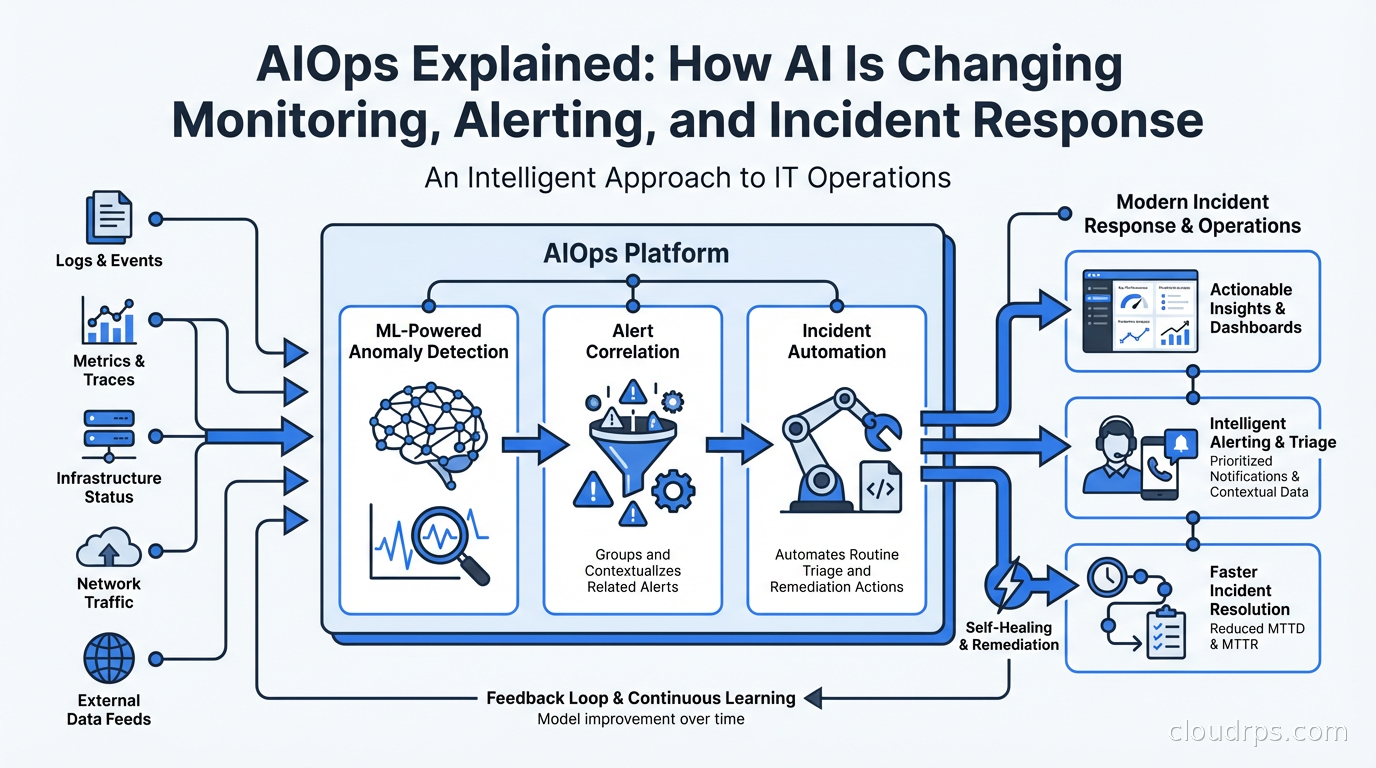
AIOps is not one technology. It’s a category that encompasses several distinct ML applications to operations data:
Anomaly detection: Instead of static thresholds, ML models learn the normal behavior of metrics (seasonality, weekly patterns, traffic-correlated baselines) and alert when actual behavior deviates significantly from predicted behavior. A service seeing 20% more errors than predicted at this time of day, given this traffic level, is more meaningful than “error count exceeded 100.”
Alert correlation: When an incident occurs, dozens or hundreds of related alerts fire across monitoring systems. ML correlates those alerts into an incident group, surfacing the probable root cause and eliminating the need to manually correlate alert streams. Instead of 200 separate alerts, you see one incident with 200 correlated signals and a probable cause.
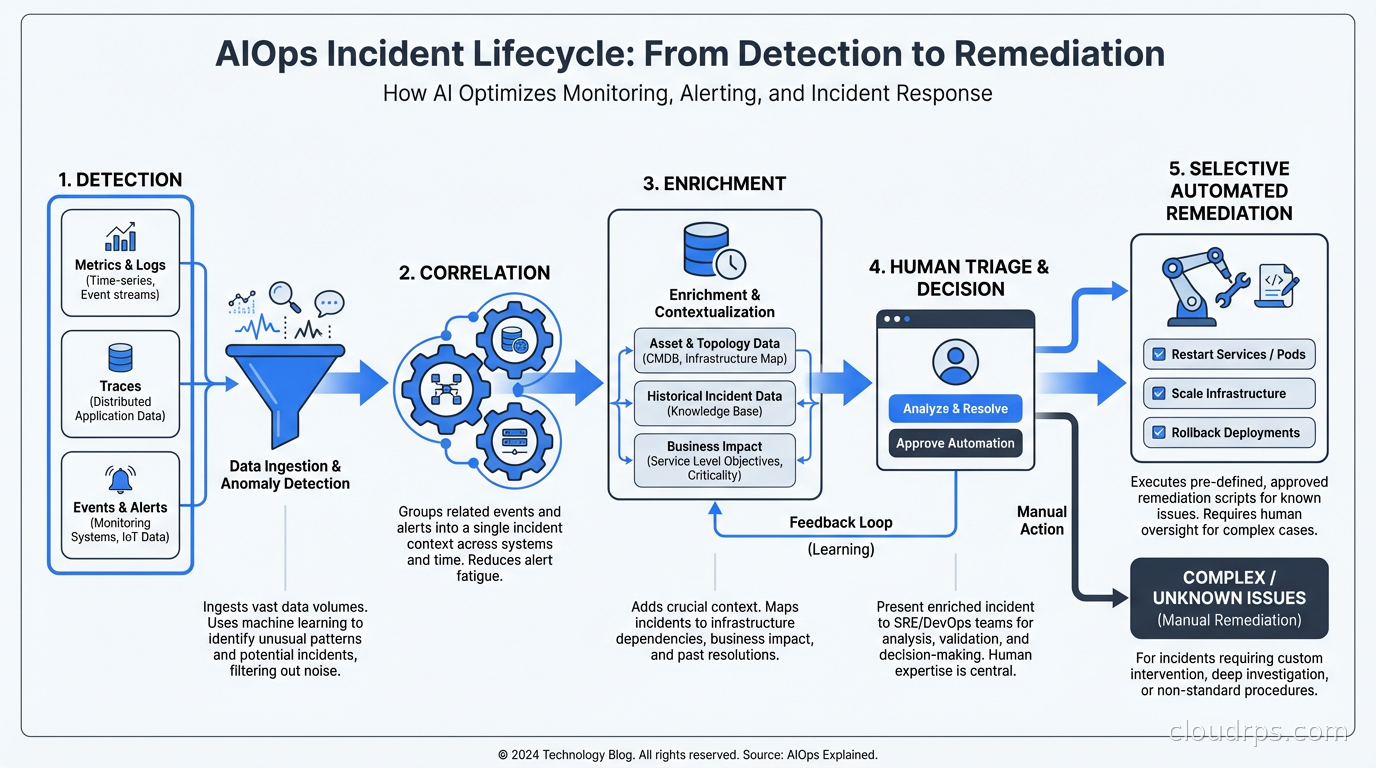
Topology-aware root cause analysis: Using service dependency maps, AIOps platforms can trace alert cascades upstream to find the originating failure. “Service A is slow because Service B is slow because Database C has high replication lag” is the automated conclusion rather than something a human needs to trace through multiple dashboards.
Incident triage and enrichment: Automatically enriching incidents with context: recent deployments, configuration changes, similar past incidents, runbook links, affected services and customers. This reduces the time from “what happened” to “what should I do.”
Predictive alerting: Forecasting metric trends and alerting before a threshold is crossed. “Disk will fill in 4 hours at current write rate” rather than “disk is 95% full.”
These capabilities exist on a spectrum from “proven and valuable” to “interesting but immature.” Anomaly detection and alert correlation are proven. Predictive alerting works well for specific metrics (disk fill rate, memory growth). Fully autonomous remediation (where AI not just identifies but also fixes problems) is largely still aspirational outside narrow, well-defined use cases.
Anomaly Detection: The Core Capability
The most practically useful AIOps capability is anomaly detection applied to metrics. Here’s why it’s better than static thresholds.
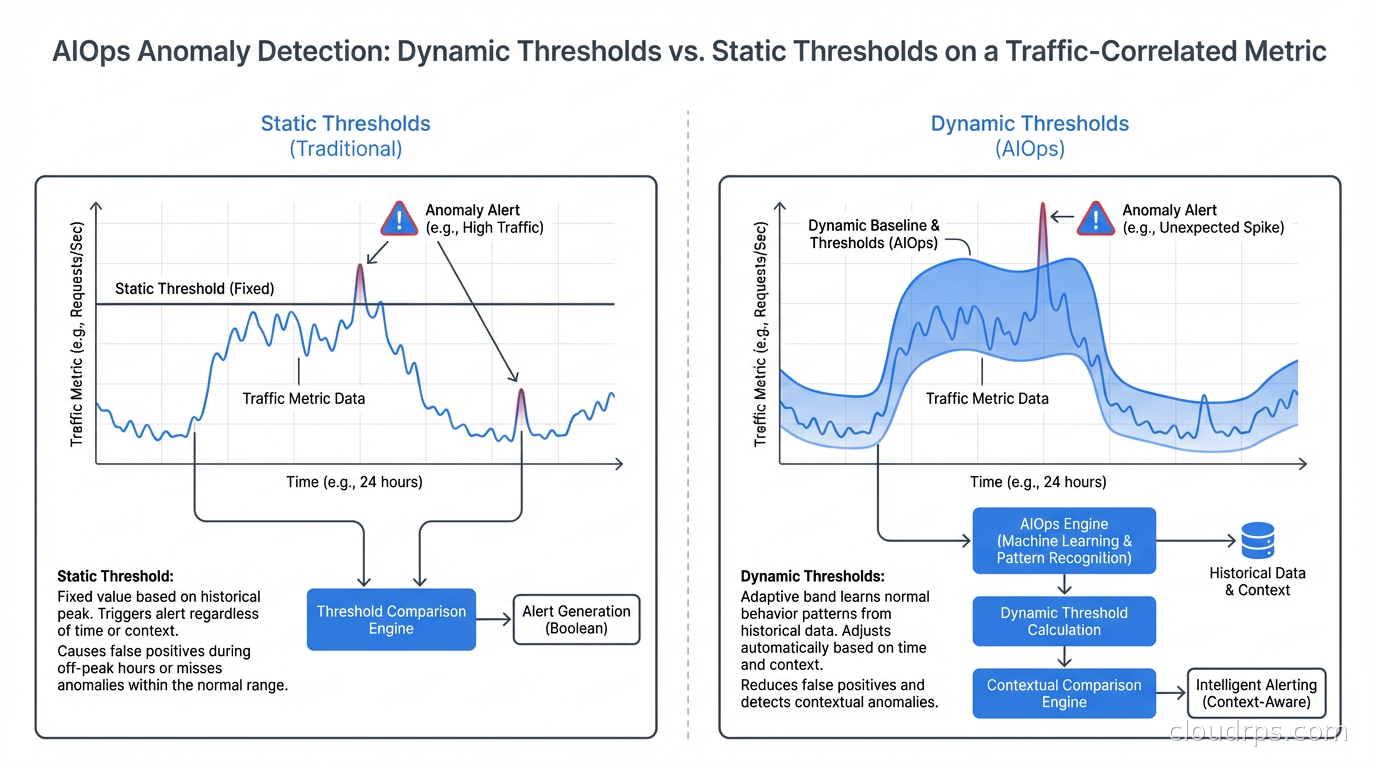
Static thresholds are calibrated against historical behavior and tuned by humans who have to guess what “normal” looks like. They don’t adapt to changing conditions. If your traffic doubles in a quarter, your old threshold of “latency > 500ms = alert” might be consistently violated during legitimate load, creating noise. Or it might be too conservative for new traffic patterns, missing real latency regressions. You’re constantly chasing threshold calibration.
ML-based anomaly detection learns normal from your actual data. It accounts for:
- Time of day (latency at 3 AM vs 3 PM is different)
- Day of week (Monday traffic is often higher than Saturday)
- Seasonal patterns (Black Friday is different from a regular Tuesday)
- Correlation with other metrics (latency changes proportionally with request rate up to a point, then disproportionately at high load)
A good anomaly detection model alerts you when the metric deviates from what the model predicts based on all these factors. The alert becomes “latency is 300ms higher than expected given current traffic levels and time of day” rather than “latency exceeded static threshold.”
The practical result: fewer false positives, faster detection of real problems. I’ve seen teams reduce alert volume by 40-70% after implementing ML-based anomaly detection while improving detection of real incidents. The operational improvement is significant.
The caveat: anomaly detection requires historical data to build models. New services have no history, so models need time to calibrate. The first few weeks are noisier. And anomaly detection can be fooled by gradual degradation that slowly moves the baseline: if your service degrades 5% per week, a model trained on recent data might consider the degraded state “normal.” You still need long-term trend monitoring alongside anomaly detection.
Alert Correlation: Turning Alert Storms Into Incidents
During a significant incident, your monitoring system is actively trying to kill you. Every symptom of the incident fires its own alert. One database failure can cascade into 50 separate alerts across services that depend on it. Your on-call engineer is looking at 50 pages and trying to figure out if they’re related and where to start.
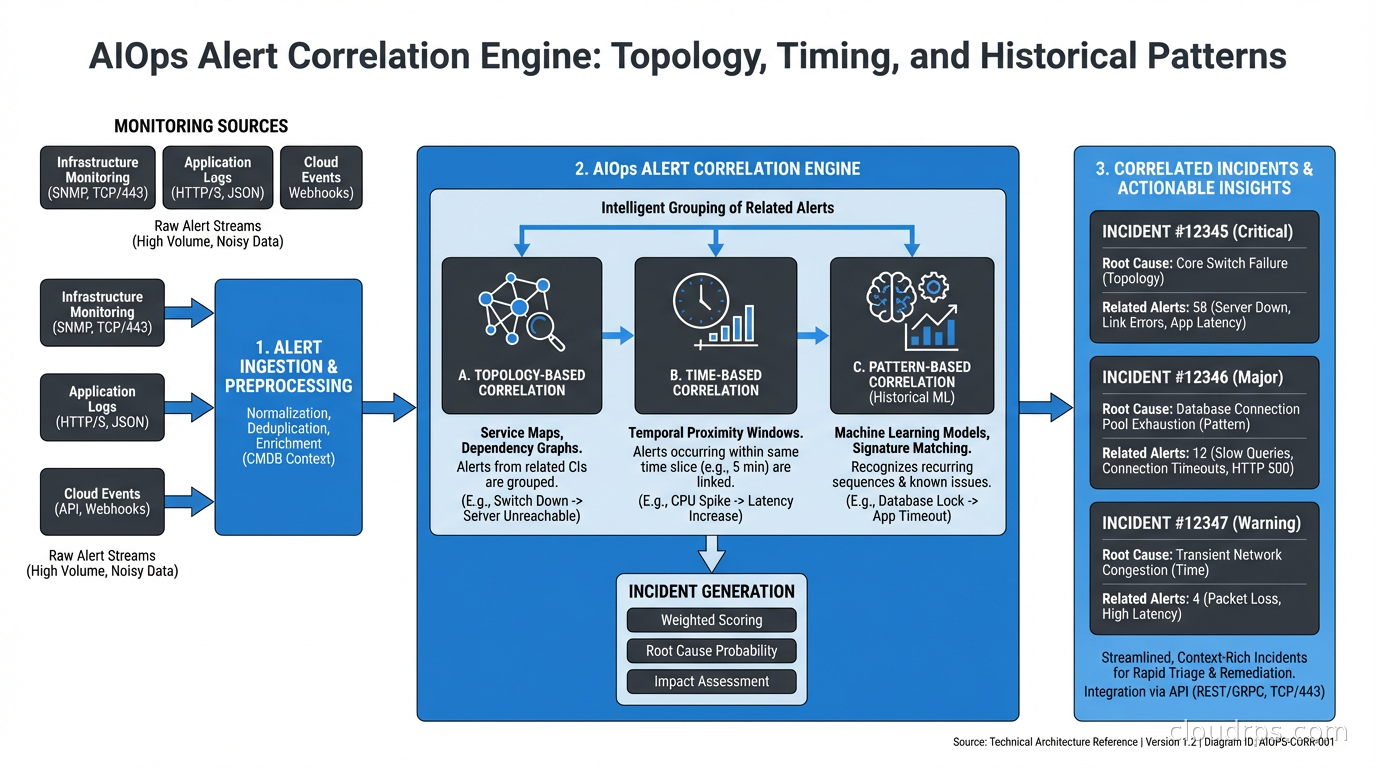
Alert correlation groups related alerts into a single incident. The algorithm considers:
- Temporal proximity (alerts that fire within a short window are likely related)
- Topology (alerts on services that have dependencies are likely related)
- Historical patterns (these combinations of alerts have fired together before, associated with a known incident type)
- Alert metadata (same environment, same region, same team’s services)
Modern AIOps platforms (Datadog, New Relic, Moogsoft, OpsRamp) implement some form of alert correlation. When it works well, your on-call sees one incident: “Incident: database_primary latency degraded, 47 correlated alerts, probable root cause: db-primary-01, affecting 12 downstream services.” That’s actionable.
The challenge is that correlation requires understanding your service topology. If your observability doesn’t include service maps, dependency tracking, and distributed tracing, the correlation engine is flying blind. AIOps is not a substitute for good fundamental observability. It’s an intelligence layer on top of it.
Integrating AIOps with Your SLO Framework
AIOps becomes significantly more powerful when integrated with your SLO and error budget framework. Error budgets tell you how much reliability you can afford to spend. AIOps can inform prioritization: an anomaly that will burn 10% of your monthly error budget in the next hour deserves different urgency than an anomaly in a non-critical service with plenty of error budget remaining.
Concretely: ML-based alerting should be SLO-aware. An anomaly that doesn’t impact SLI measurements (user-facing reliability metrics) can page differently (or not at all) compared to an anomaly that’s directly causing SLI degradation. This is the path toward meaningful alert prioritization, not just alert noise reduction.
The combination also improves retrospectives. AIOps platforms track incident patterns over time. You can ask: “How much of our error budget last quarter was spent on this class of incidents? What would it save if we eliminated this failure mode?” This data drives platform reliability investment decisions in a quantified way.
Practical AIOps Tool Landscape
The AIOps feature landscape has consolidated significantly. Most major observability platforms now include ML-based anomaly detection and alerting as standard features:
Datadog: Anomaly detection monitors with multiple algorithms (basic, agile, robust, adaptive). Good integration with service topology maps. Watchdog automatically surfaces anomalies without requiring explicit monitor configuration. Strong alert correlation via event management.
New Relic: Applied Intelligence includes alert correlation (grouping alerts into incidents), anomaly detection via NR AI Monitoring, and golden signals monitoring. The interface for configuring correlation logic is more accessible than Datadog’s.
Grafana + Grafana Alerting: Grafana has added ML-based anomaly detection via Grafana ML (metric forecasting and outlier detection). Combined with Mimir or Prometheus for metrics storage and Grafana OnCall for paging, you can build a competitive open-source stack.
Moogsoft (now part of Dell): One of the original AIOps platforms, strong alert correlation and noise reduction. More enterprise-focused.
OpsRamp: Strong topology-aware root cause analysis and ITSM integration. Popular in enterprises that need AIOps to connect to ServiceNow and CMDB.
For teams just starting: add anomaly detection monitors in your existing Datadog or New Relic account before evaluating specialized AIOps platforms. The native anomaly detection is often sufficient and avoids adding another tool to the stack.
Automated Remediation: What’s Real
Autonomous remediation is the most hyped and least mature part of AIOps. The promise: AI detects an issue and automatically fixes it, with no human involvement. The reality: this works reliably for a small class of well-understood, low-risk remediations.
What does work:
Auto-scaling triggers: ML-based predictive scaling that adds capacity before a spike hits based on predicted load. This is production-ready and valuable. AWS Auto Scaling with predictive scaling mode does this. Kubernetes KEDA can trigger on external metrics including ML-derived predictions.
Automated rollbacks: Continuous deployment pipelines that monitor error rate or latency after a deployment and automatically roll back if metrics degrade past a threshold. This is well-established and doesn’t require sophisticated AI: it’s just metric-gated rollback.
Auto-restart of crashed services: Kubernetes already does this (liveness probes). Extending this to more complex restart logic (drain connections before restart, wait for dependent services) can be codified in runbooks executed automatically.
Resource reclamation: Automatically resizing over-provisioned instances based on actual utilization patterns. AWS Compute Optimizer does this with ML; Datadog’s Container Resize Recommendations in Kubernetes.
What doesn’t reliably work yet: fully autonomous diagnosis and fix of novel failure modes, database performance tuning, complex multi-service incident remediation, anything that requires understanding business context or making judgment calls.
The teams I’ve seen succeed with automated remediation start narrow: pick the top 3-5 incidents that account for the most on-call toil, write automated remediation playbooks for those specific cases, and measure toil reduction. Scale the automation gradually as each runbook proves reliable. This is safer and more productive than deploying a fully autonomous remediation platform and hoping for the best.
The Observability Foundation Requirement
AIOps cannot improve what you can’t measure. This sounds obvious but is violated constantly. I’ve seen organizations spend significant money on AIOps platforms while their services still have coverage gaps in monitoring and logging.
Before investing in AIOps tooling, verify that you have:
- Metrics for all services (the four golden signals: latency, traffic, errors, saturation)
- Structured logging with consistent correlation IDs
- Distributed tracing across service boundaries (see OpenTelemetry)
- Service dependency maps
- Deployment change tracking (every deployment event captured in your observability platform)
The deployment change tracking is particularly important. A huge percentage of production incidents are caused by recent deployments. AIOps platforms that can correlate anomaly onset with deployment events dramatically reduce time-to-root-cause. But they can only do this if deployment events are being sent to the monitoring platform. Make this part of your CI/CD pipeline: every deployment sends an event to Datadog or New Relic with the service name, version, and team.
AIOps also integrates naturally with chaos engineering: after injecting failures in a controlled way, you can verify that your AIOps system detected the issue correctly and generated actionable alerts. This is how you validate your detection capability before it matters in production.
Getting Started Practically
If your organization is not currently using any AIOps capabilities, here’s the order I’d recommend:
Enable anomaly detection on your most critical service metrics (latency, error rate, throughput). Start in warning mode. Tune for two weeks before paging on anomaly alerts.
Configure alert grouping/correlation in your existing monitoring platform. Route related alerts to the same incident. This alone reduces on-call cognitive load significantly.
Enrich incidents with deployment context. Hook your CI/CD pipeline to send deployment events to your monitoring platform. Incidents should automatically show “recent deployment by team X, 23 minutes before anomaly onset.”
Add error-budget-aware alerting. High-priority alerts for SLO-impacting issues, lower priority for non-SLO-impacting anomalies.
Build the first automated remediation playbook for your highest-toil incident type. Measure toil reduction over the next quarter before deciding whether to expand.
AIOps done incrementally, grounded in good observability fundamentals and a clear-eyed view of what’s mature versus aspirational, delivers real operational improvements. It doesn’t replace engineers, but it does make them more effective: spending time on the few real incidents that require judgment rather than triaging hundreds of noisy false positives.
That’s the goal. Less noise, faster signal, more time spent on things that actually require a human.
Get Cloud Architecture Insights
Practical deep dives on infrastructure, security, and scaling. No spam, no fluff.
By subscribing, you agree to receive emails. Unsubscribe anytime.