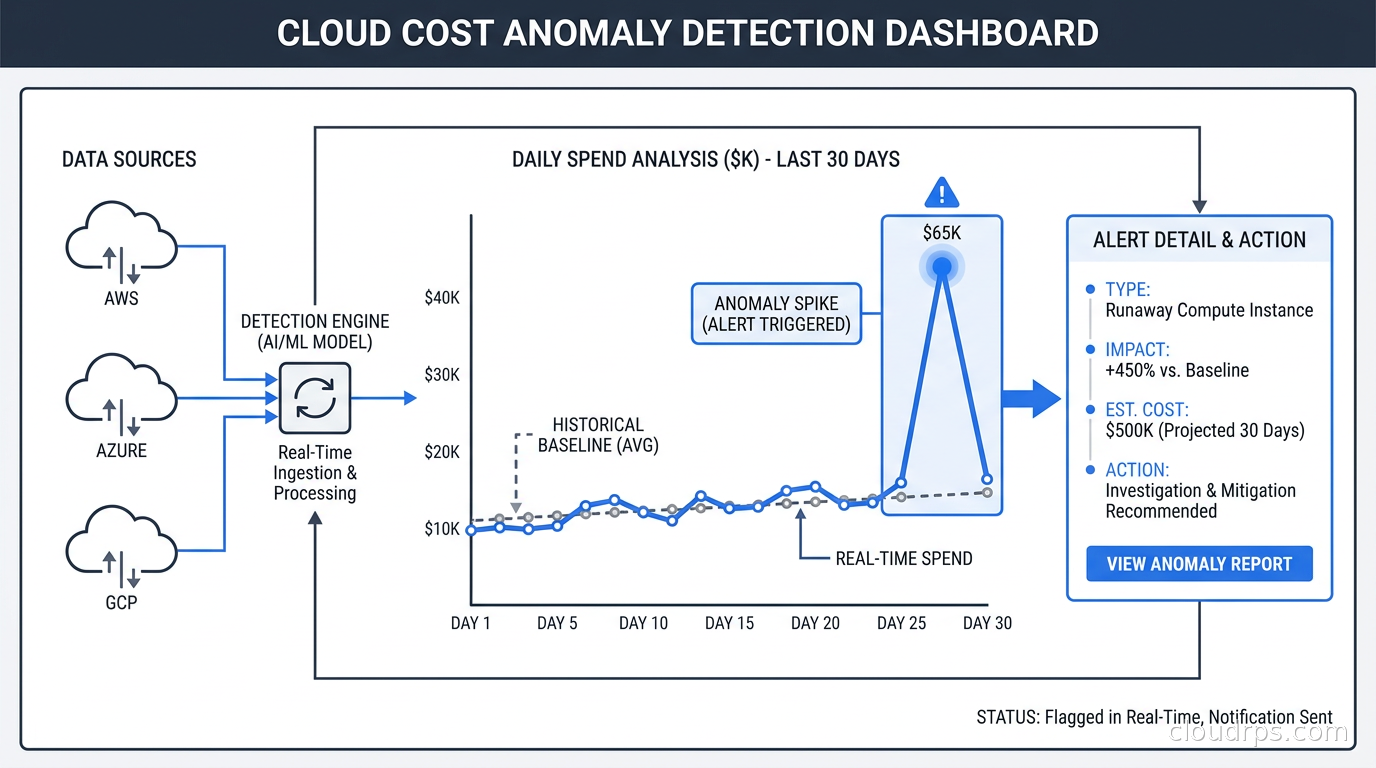
Last year I watched a startup’s AWS bill jump from $40,000 to $280,000 in a single month. The culprit was a data science team member who accidentally left a fleet of p4d.24xlarge instances running over a long weekend to process a dataset that fit on a single GPU. The company had budget alerts configured. Those alerts fired on the first day of the following month, when the billing cycle closed. By then, $240,000 was already spent and gone.
Budget alerts are a lagging indicator dressed up as a guardrail. They tell you the house burned down. Anomaly detection tells you the smoke detector just went off. After twenty years of building cloud infrastructure across companies ranging from Series A startups to global enterprises, I’m convinced that budget-threshold alerting is one of the most dangerous false comforts in cloud operations. It gives finance and engineering teams the feeling that something is watching the bill when in reality nothing is watching spend patterns at all.
This article is about fixing that. I’ll walk through how cloud cost anomaly detection actually works, how to use the native tools AWS provides alongside third-party platforms, how to build the alert routing and triage workflows that keep signal-to-noise ratio high, and what automated remediation looks like when you’re ready for it.
Why Budget Alerts Fail at Scale
The logic of a budget alert seems sound: set a threshold, fire when you cross it. But that model breaks down for several reasons.
First, thresholds go stale. A team that spent $50,000 per month in January and $70,000 in April has a different baseline than the original threshold assumed. If you set the alert at $80,000, it fires on normal growth as often as on genuine anomalies. Engineers start ignoring it. This is the alert fatigue problem that makes every monitoring and observability team’s life miserable.
Second, budget alerts work at the account or service level. A spike in EC2 spend caused by a single runaway autoscaling group inside a service that normally costs $15,000 per month might never cross the account-level alert threshold if the account itself is large enough. The anomaly is invisible because it gets averaged out.
Third, they’re monthly. AWS billing periods are monthly. If something goes wrong on the 3rd, you won’t see it in a budget alert until the 31st at the earliest, and usually not until the new billing period opens.
Anomaly detection solves all three problems. It baselines normal spend patterns using historical data, flags deviations from that pattern in near real time, and operates at a granular level (service, tag dimension, linked account) rather than at the blunt account level.
How Cloud Cost Anomaly Detection Works
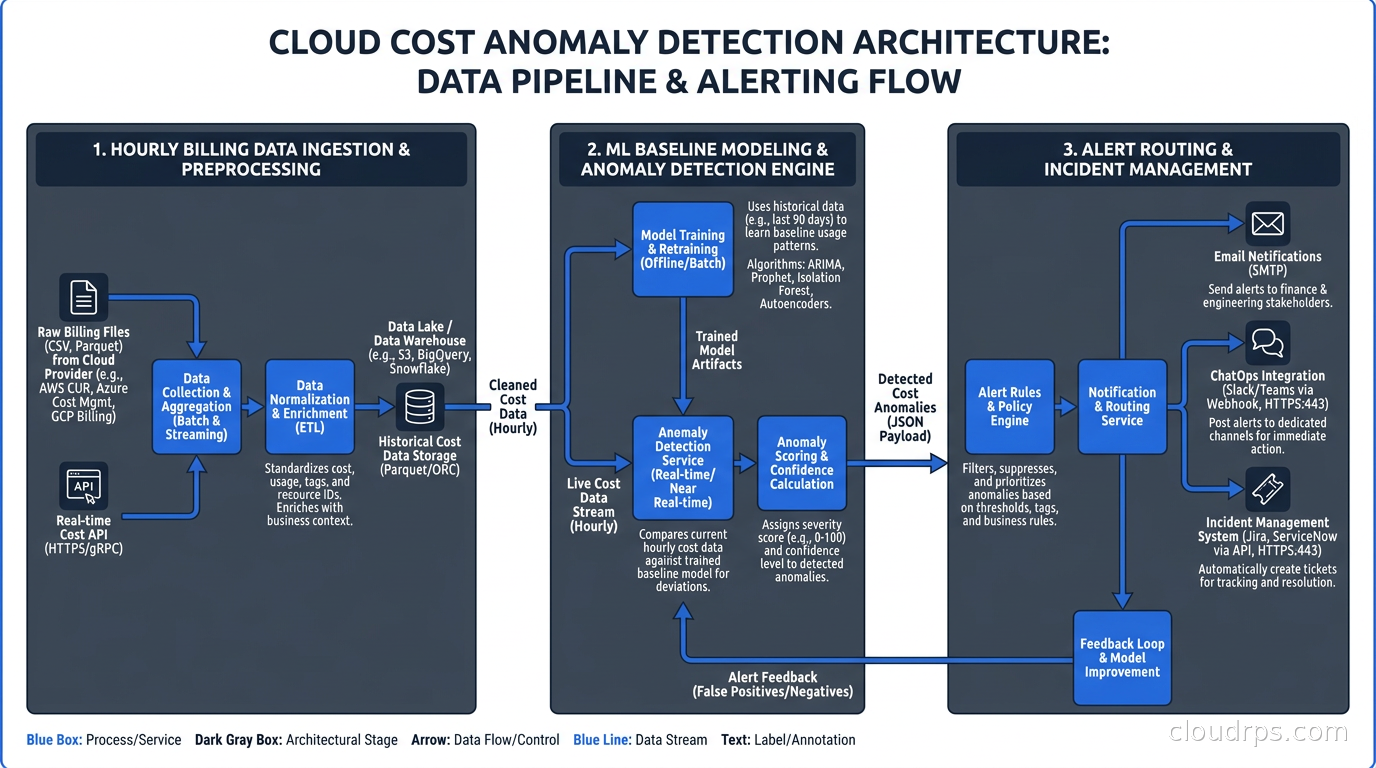
The core idea is straightforward: collect hourly spend data, build a statistical model of what “normal” looks like, and alert when actual spend deviates significantly from the predicted range.
Most implementations use a combination of techniques. Time-series decomposition separates trend from seasonality from noise. A machine learning model trained on 90-plus days of historical data learns that EC2 spend spikes every Monday morning when batch jobs start, drops over weekends, and grows roughly 8% per quarter as the product scales. When actual spend on a Tuesday afternoon is 340% above what the model expects, that’s an anomaly.
The sophistication is in the baseline model. A naive approach (alert when spend is 30% above last week) generates constant false positives during normal growth periods and misses slow-burn anomalies where costs creep up 10% per day for two weeks. A well-tuned model accounts for growth trends, weekly and monthly seasonality, and event-driven spikes like product launches.
AWS Cost Anomaly Detection: The Native Starting Point
If you’re on AWS, Cost Anomaly Detection is the right first tool to configure. It’s free, it’s native, and it works with the Cost Explorer data you’re already paying for. Most teams I work with haven’t turned it on, which is baffling given the cost (zero) and setup time (about fifteen minutes).
Cost Anomaly Detection works through monitors and subscriptions. A monitor defines what you’re watching, and a subscription defines who gets alerted and when.
You can create monitors at four levels: AWS services (EC2, RDS, etc.), linked accounts, cost allocation tag dimensions, and cost categories. For most organizations, I recommend creating at minimum:
A per-service monitor watching each of your top five spend services individually. EC2, RDS, S3, data transfer, and whichever service your team uses most heavily. The per-service granularity is essential for catching anomalies that get masked at the account level.
A per-linked-account monitor if you’re running a multi-account AWS Organizations setup. This catches team-level anomalies before they roll up and get lost in aggregate numbers.
A per-tag monitor tied to your team or environment tags. If you’ve done the work described in cloud FinOps tagging and cost allocation, this becomes your most useful monitor because it can fire on a specific team’s spend deviation.
For subscriptions, configure both an SNS topic for immediate alerting and an email digest. The immediate alert goes to a Slack channel or PagerDuty. The daily email digest goes to engineering managers and finance so they have context without being woken up for every alert.
The threshold configuration deserves attention. AWS lets you set an absolute dollar threshold (alert when anomaly exceeds $X) and a percentage threshold (alert when anomaly exceeds X% of expected). Use both. A $100 anomaly might be 500% above expected for a low-cost service and worth investigating even though $100 seems trivial. A 15% deviation on a service that normally costs $80,000 per month might be $12,000 and worth acting on even if the percentage doesn’t look alarming.
AWS Cost Anomaly Detection has real limitations. It doesn’t give you root cause analysis beyond “EC2 in us-east-1 spiked.” It has no concept of cost ownership, so when EC2 spikes you still have to figure out which team, which autoscaling group, which instances. And its alert granularity, while good, still operates at the AWS service or tag dimension level rather than at the resource level. For teams with mature FinOps practices and significant cloud spend, you’ll want more.
Third-Party Platforms: Where the Depth Actually Lives
The market for cloud cost anomaly detection has matured significantly. CloudZero, Vantage, Anodot, and CAST AI all offer detection capabilities that go meaningfully beyond what AWS, Azure, and GCP provide natively.
CloudZero is the platform I’ve seen deployed most successfully at companies with complex multi-team environments. Its unit economics model is the differentiator: it can tell you that the anomaly in EC2 spend came from a specific customer tenant whose workload spiked, and it can express that as cost-per-customer or cost-per-feature rather than just raw dollars. If you’re building a SaaS product and you care about margins by customer cohort, this context is invaluable.
CloudZero’s anomaly detection runs on hourly data and trains on 90 days of history. It uses a self-learning model that adjusts automatically to growth trends, which means you don’t have to continuously update thresholds as your spend grows. The alert routing integrates natively with Slack, PagerDuty, Datadog, and Jira, which is important for the workflow I’ll describe in the next section.
Vantage has a cleaner UI and a more affordable entry point for smaller teams. Its anomaly detection is solid and the cost reports are genuinely excellent. Where it wins is ease of use and the speed at which engineering teams adopt it. I’ve seen Vantage go from purchase to first useful alert in under a day. Its weakness is the same as AWS’s: it’s better at detection than root cause attribution.
Anodot comes from the AI-native monitoring space and brings the most sophisticated ML modeling. If you have highly irregular spend patterns (seasonal businesses, research workloads, AI training runs that happen monthly rather than daily), Anodot’s approach to handling non-stationary time series can reduce false positives significantly compared to simpler approaches. The tradeoff is complexity and cost.
For teams operating on GCP or Azure, those platforms have improved their native anomaly detection capabilities substantially. Azure Cost Management added ML-based anomaly detection in 2024. GCP Cloud Billing Anomaly Detection works reasonably well for straightforward patterns. But neither is as mature as what you get from a dedicated platform, particularly around alert routing and root cause context.
Building the Alert Routing and Triage Workflow
Detection without a clear response workflow is just noise. The most common failure mode I see is teams that configure anomaly detection, get their first few alerts, don’t know what to do with them, and gradually start ignoring them. Three months later they’re back where they started.
The workflow has four phases: alert, triage, investigate, resolve.
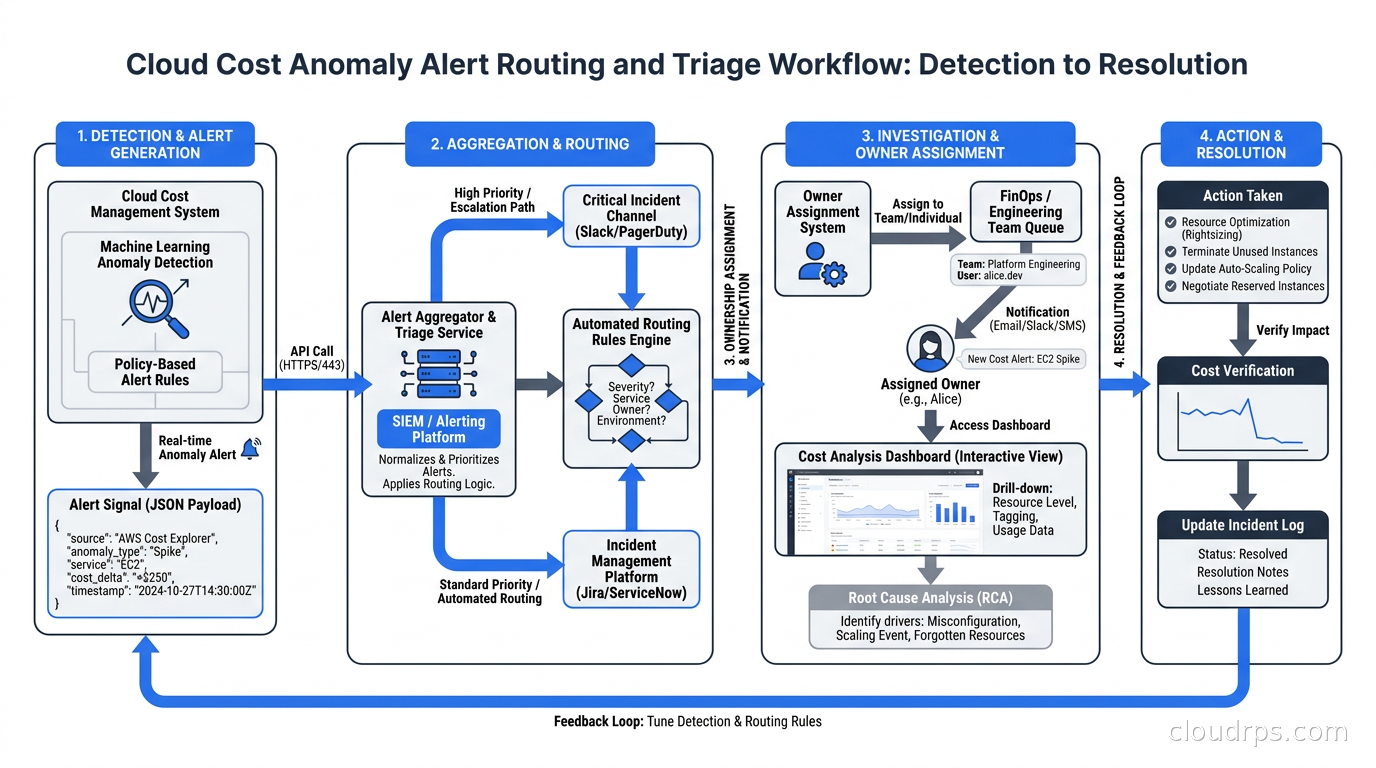
Alert routing should be immediate for high-severity anomalies (over $1,000 per day deviation or over 100% above baseline) and batched daily for lower-severity ones. High-severity alerts go to a dedicated Slack channel (#cloud-cost-alerts or similar) and optionally to PagerDuty if your team is mature enough to treat cost events with the same urgency as reliability events. Most teams aren’t there yet and shouldn’t be force-fed out-of-hours cost alerts.
Triage means determining whether the anomaly is real or expected. The most common false positive is a deployment that legitimately uses more resources (a new service launch, a migration, a product announcement). If your tagging strategy includes a deployment-event or campaign tag applied by your CI/CD pipeline, you can suppress cost anomaly alerts during known events. This requires discipline in your IaC and deployment processes, but it’s worth implementing if false positive volume is high.
The second most common false positive is a new service or team that hasn’t built a 90-day history yet. Detection models trained on insufficient data have higher error rates. Mark new services explicitly and apply more lenient thresholds for their first 90 days.
Investigation is where your tagging strategy pays off. If you followed the approach described in cloud FinOps tagging and cost allocation, you can filter Cost Explorer by team tag and service tag to get from “EC2 spiked” to “the data-platform team’s preprocessing job spiked” in under five minutes. Without good tags you’re looking at raw instance IDs, which turns a five-minute investigation into a two-hour archaeological dig.
Specific investigation steps for common anomaly types:
For EC2 anomalies, check Auto Scaling group activity logs first. Most EC2 spikes trace to scaling events: a CloudWatch alarm with a wrong threshold that scaled out 200 instances, or a spot instance interruption that triggered an on-demand fallback at scale. The Karpenter logs and EC2 instance history are your primary data sources.
For data transfer anomalies, the likely culprits are cross-region or cross-AZ traffic patterns that changed (a service that moved between regions), new NAT Gateway traffic (a service that used to have a VPC endpoint losing its endpoint configuration), or a new integration with an external API. The cloud egress costs architecture article has a detailed breakdown of what generates these costs and how to attribute them.
For RDS or database anomalies, look at query patterns first. A new query that does a full table scan on a multi-terabyte table, a misconfigured connection pool creating thousands of unnecessary connections, or a migration that enabled a feature you didn’t realize had per-I/O pricing.
Resolution should always include a post-mortem note attached to the alert ticket, even if brief. What was it? Why did it happen? What changed to prevent recurrence? This history becomes invaluable when the same pattern recurs three months later and someone needs to diagnose it quickly. Store these notes in whatever system your team uses for runbooks.
Cost Guardrails: The Proactive Layer
Anomaly detection is reactive: it tells you something happened. Cost guardrails are proactive: they prevent the something from happening in the first place or limit its blast radius.
AWS Service Control Policies (SCPs) are the strongest guardrail mechanism in AWS Organizations. You can write policies that prevent any principal in specific OUs from launching instance types above a certain size, creating resources in unapproved regions, or disabling cost allocation tags. SCPs can’t prevent all cost anomalies (a lot of legitimate waste comes from autoscaling, not from humans making bad decisions), but they eliminate entire categories of expensive mistakes.
Budget Actions go further: they let you attach automated responses to AWS Budgets thresholds. You can configure a budget to automatically apply an IAM policy that restricts EC2 launches when spend crosses a threshold, or to send a Slack notification that triggers a human approval workflow. This is closer to actual enforcement than a passive alert.
For Kubernetes workloads, Kubernetes cost visibility tools like OpenCost and Kubecost have added anomaly detection and budget enforcement features. Kubecost’s budget alerts operate at the namespace or label level and can integrate with OPA to enforce cost policies at admission time. If a new deployment’s projected monthly cost exceeds a threshold, Kubecost can reject the admission. This is genuinely useful for platform teams trying to prevent individual teams from accidentally deploying oversized workloads.
For AI workloads specifically, where a single training run can cost thousands of dollars, the guardrail model needs to be particularly tight. The practices described in AI FinOps and GPU cost optimization cover this territory in detail, but the short version is: enforce maximum instance counts and maximum duration on GPU jobs at the scheduler level, not just through monitoring.
Automated Remediation: When and How
Automated remediation (automatically stopping or right-sizing resources when an anomaly is detected) sounds appealing but requires careful implementation to avoid self-inflicted reliability incidents.
I’ve seen automated remediation cause outages twice in my career. Once, an EC2 cost anomaly from a legitimate traffic spike triggered an auto-remediation that terminated instances, taking a service down during a product launch. Once, an automated right-sizing recommendation was applied during a maintenance window but the timing collided with a batch job, causing data corruption. Both incidents taught me that automated remediation needs guardrails of its own.
The safe approach is tiered automation. For clearly safe actions with no service impact (stopping idle development instances, deleting unattached EBS volumes, removing old snapshots), automate fully and notify after the fact. For actions with potential service impact (terminating instances, scaling down autoscaling groups), require a human approval step but automate the workflow to make that approval fast and low-friction. For actions that touch production databases or critical infrastructure, require explicit human action with no automation at all.
The tooling for this has improved. AWS Cost Anomaly Detection integrates with Lambda through SNS, giving you a trigger point for custom automation. CloudZero and Vantage both have webhook support for integrating with internal automation systems. Combining anomaly detection with your existing Infrastructure as Code workflows lets you trigger automated PRs that propose resource right-sizing, which engineering teams can review and merge rather than applying blindly.
Detection Method Comparison
Different tools and approaches have meaningfully different characteristics for detection accuracy, alert latency, and root cause depth.
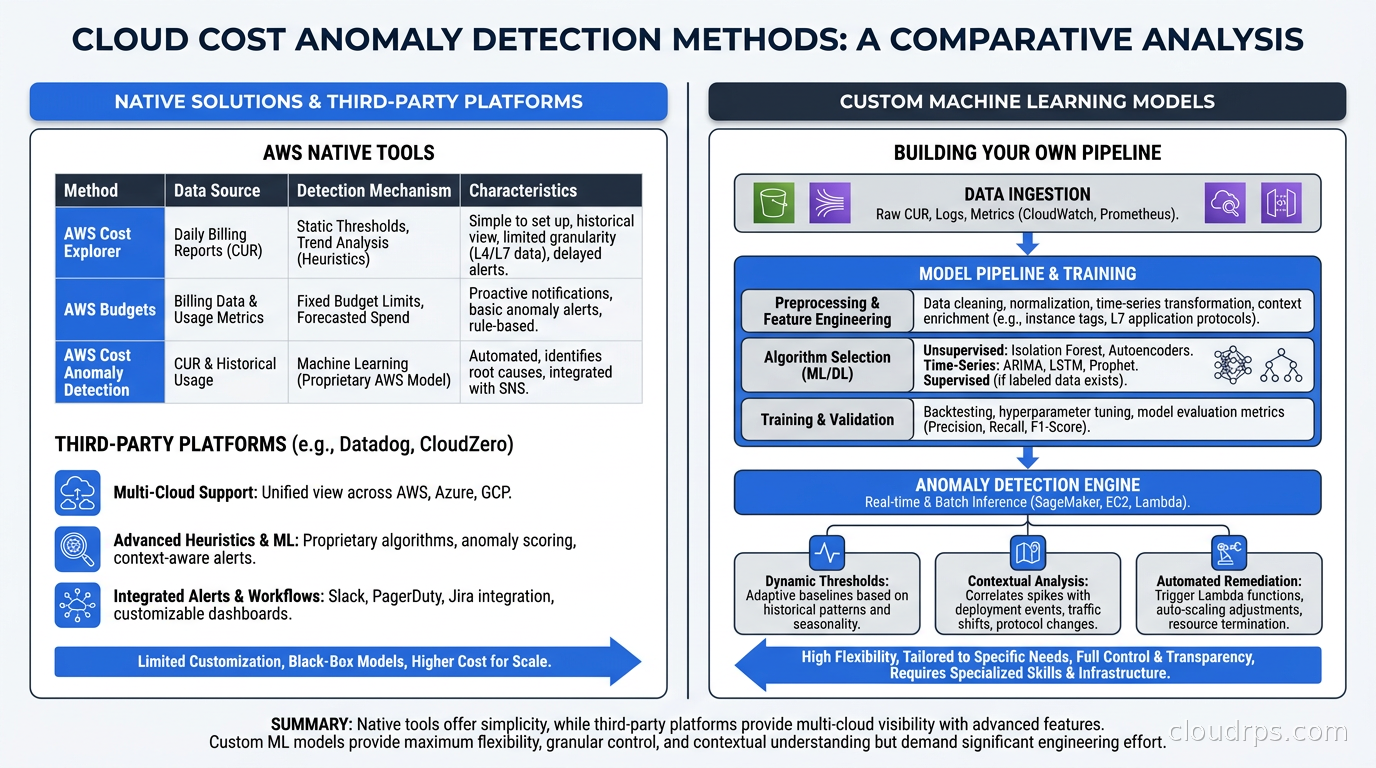
AWS Cost Anomaly Detection provides hourly detection with same-day alerting, costs nothing beyond your existing Cost Explorer subscription, and handles straightforward spend patterns well. Its weakness is root cause attribution: you know a service spiked but not why.
CloudZero and similar platforms provide more granular detection (unit economics, per-customer attribution), better root cause context, and richer alert routing. They cost money (typically $2,000 to $10,000 per month depending on spend volume) and require an onboarding investment to configure the business context that makes unit economics meaningful.
Custom ML models built on top of AWS Cost and Usage Reports (CUR) or the FOCUS-compatible billing exports described in the FOCUS spec article give you complete control but require significant engineering investment to build and maintain. For most organizations, native tools plus a third-party platform is the right combination. Custom ML makes sense only for organizations with very unusual spend patterns that off-the-shelf models can’t handle.
The Engineering Culture Problem
The hardest part of cloud cost anomaly detection isn’t the technology. It’s getting engineering teams to treat cost alerts with the same urgency they treat error rate alerts.
At every organization where I’ve seen FinOps succeed, it succeeded because cost visibility and cost accountability were embedded in the engineering workflow, not siloed in a FinOps team that engineers ignored. That means cost metrics in the same dashboards as latency and error rates. It means cost-per-deployment tracked in CI/CD pipelines. It means cost anomaly alerts routed to the teams that own the resources, not to a central FinOps team that has to play telephone with engineering to figure out what happened.
The best framing I’ve found for engineering audiences is business impact rather than dollar amounts. “EC2 costs spiked by $12,000 this week” gets a shrug. “The unit cost of processing a document tripled this week, which means we’re losing money on every enterprise customer” gets attention. That translation requires the unit economics model that platforms like CloudZero are designed to support.
The combination of good tagging (so you know which team owns what), anomaly detection (so you know when something unexpected happened), and business context (so you know why it matters) is what turns cloud cost management from a finance problem into an engineering practice.
The startup I mentioned at the beginning implemented AWS Cost Anomaly Detection the week after the $240,000 incident, added per-team budget dashboards, and configured automated instance-type blocklists via SCPs for the development environment where the incident originated. They caught three similar incidents in the following six months, each time within hours instead of a month later. The anomaly detection didn’t prevent the problem from starting. But it stopped each one before it ran for more than a few hours.
That’s the real value proposition: not zero incidents, but incidents measured in hours of waste instead of months.
Practical Starting Point
If you’re reading this and your current cost monitoring is a monthly budget alert, here’s the minimum viable setup to implement this week:
Enable AWS Cost Anomaly Detection with monitors for your top three services by spend and for each linked account in your AWS Organization. Set subscriptions to send alerts to a Slack channel with a $500/day absolute threshold and a 50% relative threshold. This takes fifteen minutes and costs nothing.
Over the next month, tune the thresholds based on false positive rate. If you’re getting more than one alert per day that turns out to be expected, lower the sensitivity. If you’ve been burned by surprises that should have been caught, raise it.
Then invest in your tagging strategy so that investigation time drops from hours to minutes. The cost allocation tagging guide has the framework. Without good tags, anomaly detection tells you something is wrong but not where to look.
After sixty to ninety days, evaluate whether a third-party platform adds enough value to justify its cost. For teams spending under $50,000 per month, AWS native tools are usually sufficient. Above that, the root cause attribution and unit economics from a dedicated platform typically pay for themselves through faster incident response and better cost attribution.
Cloud cost anomaly detection isn’t glamorous infrastructure work. Nobody puts it on a conference talk abstract. But after twenty years of watching organizations discover expensive mistakes months after they started, I’d rather spend a morning configuring anomaly detection than spend a week explaining to a CFO why a long weekend cost a quarter million dollars.
Get Cloud Architecture Insights
Practical deep dives on infrastructure, security, and scaling. No spam, no fluff.
By subscribing, you agree to receive emails. Unsubscribe anytime.