
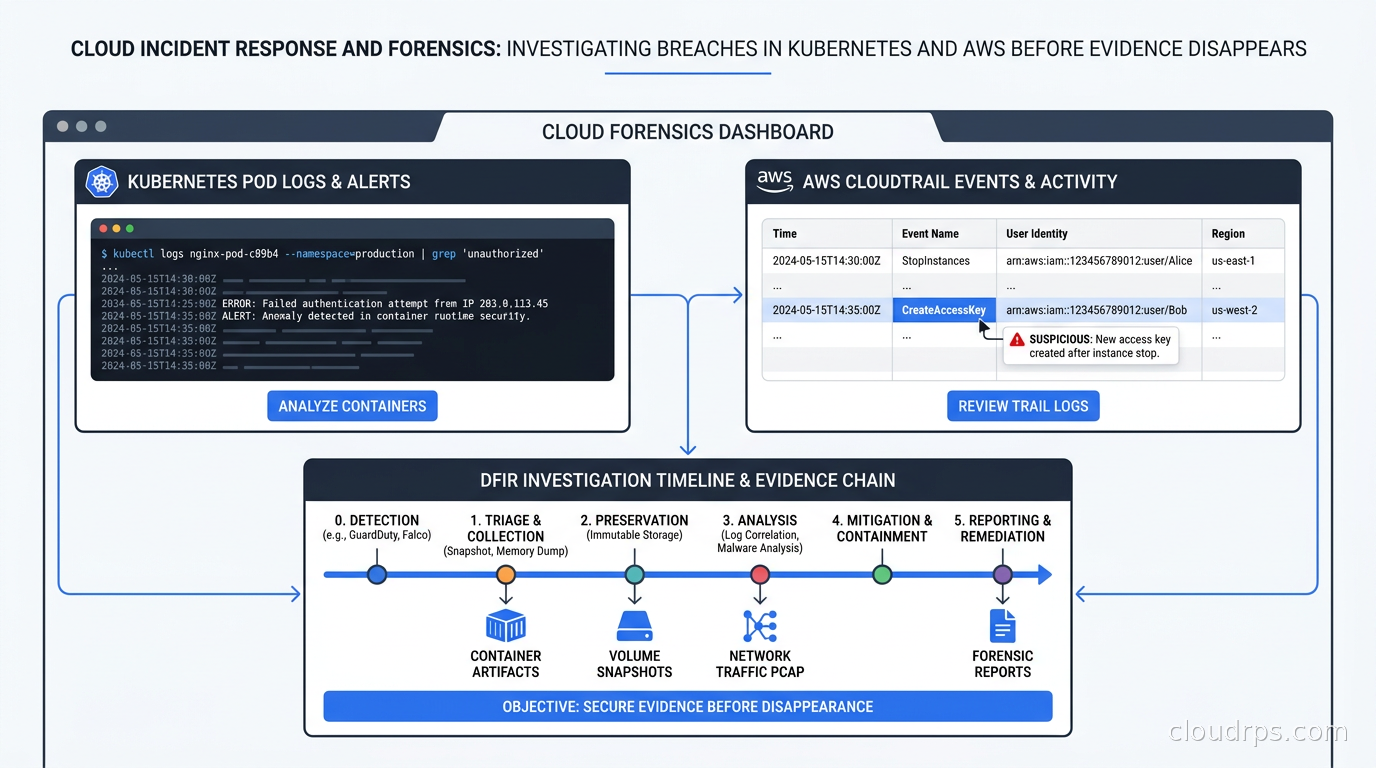
Twenty years in cloud infrastructure has taught me that the teams who handle breaches well are not necessarily the ones with the best detection tooling. They are the teams who rehearsed what to do after the alarm fires, before the container dies and takes the evidence with it.
Cloud incident response is fundamentally different from the host-based DFIR work most security engineers trained on. The disk image you could acquire from a compromised server does not exist for a pod that ran for forty seconds. The memory dump workflow that worked beautifully on a VMware VM fails when the instance gets terminated by an autoscaler. And the logs you need to reconstruct an attack chain are scattered across CloudTrail, VPC Flow Logs, container runtime logs, the API server audit log, and six different managed service logs, all in different formats and different retention windows.
This article is the guide I wish I had the first time I had to do a real cloud forensics investigation. It covers evidence sources, preservation tactics, tooling, and the playbooks that actually hold up when an incident is live.
Why Cloud Forensics Is Hard
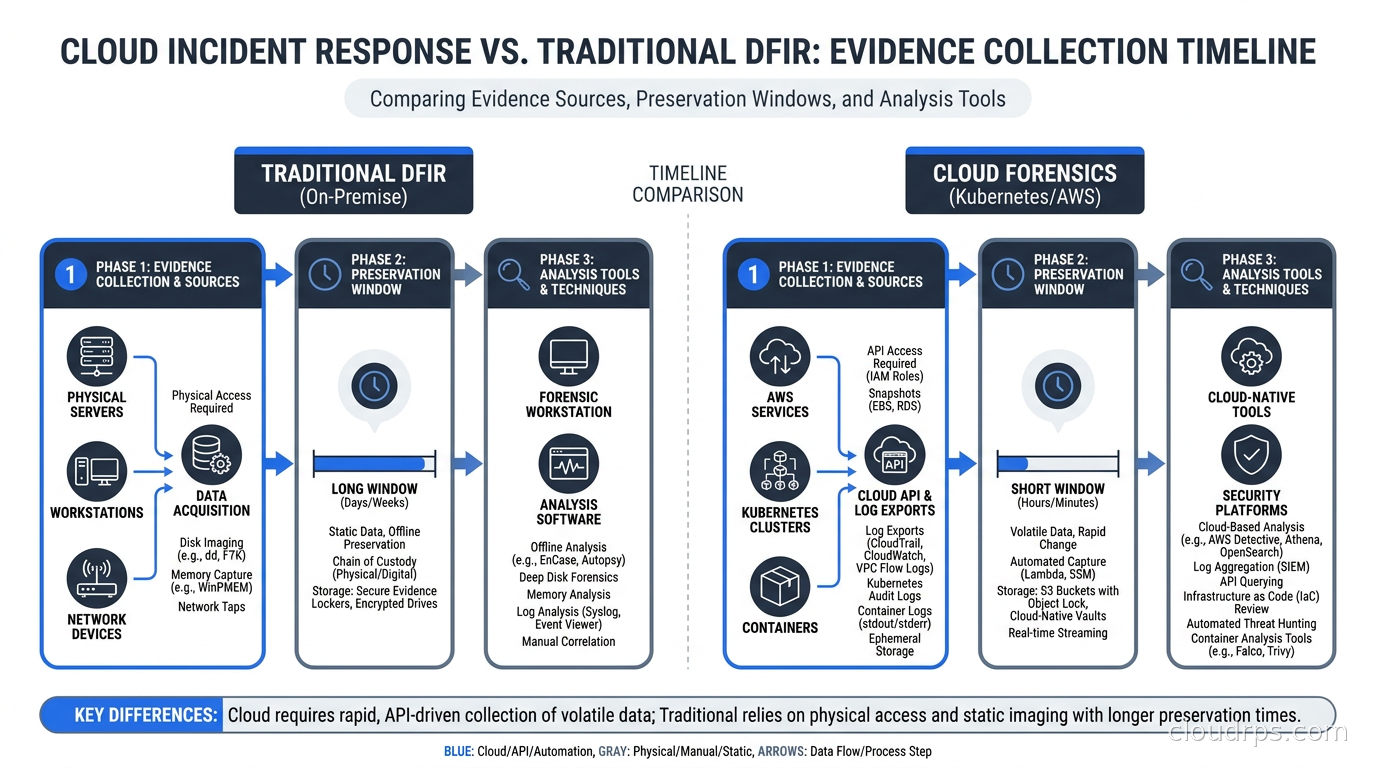
Traditional DFIR assumes persistence. A laptop or server has a consistent filesystem, a stable process list, and logs that persist until you read them. Cloud environments, especially containerized ones, invert all three assumptions.
Containers are ephemeral by design. A pod can be created, run a workload, and be terminated in under a minute. If an attacker exploits a vulnerability in a container, does lateral movement, and the pod restarts due to a health check failure, you may have nothing to examine. The attacker’s process tree, network connections, and any modifications to the container’s writable layer are gone.
The shared responsibility model creates log gaps. AWS manages the hypervisor layer. You get CloudTrail for control plane actions, but access to physical host-level data is not in scope for customers. In a Kubernetes environment, the cluster control plane on managed services like EKS is partly opaque. You can see what went through the API server, but the scheduler’s internal decision logs are not yours.
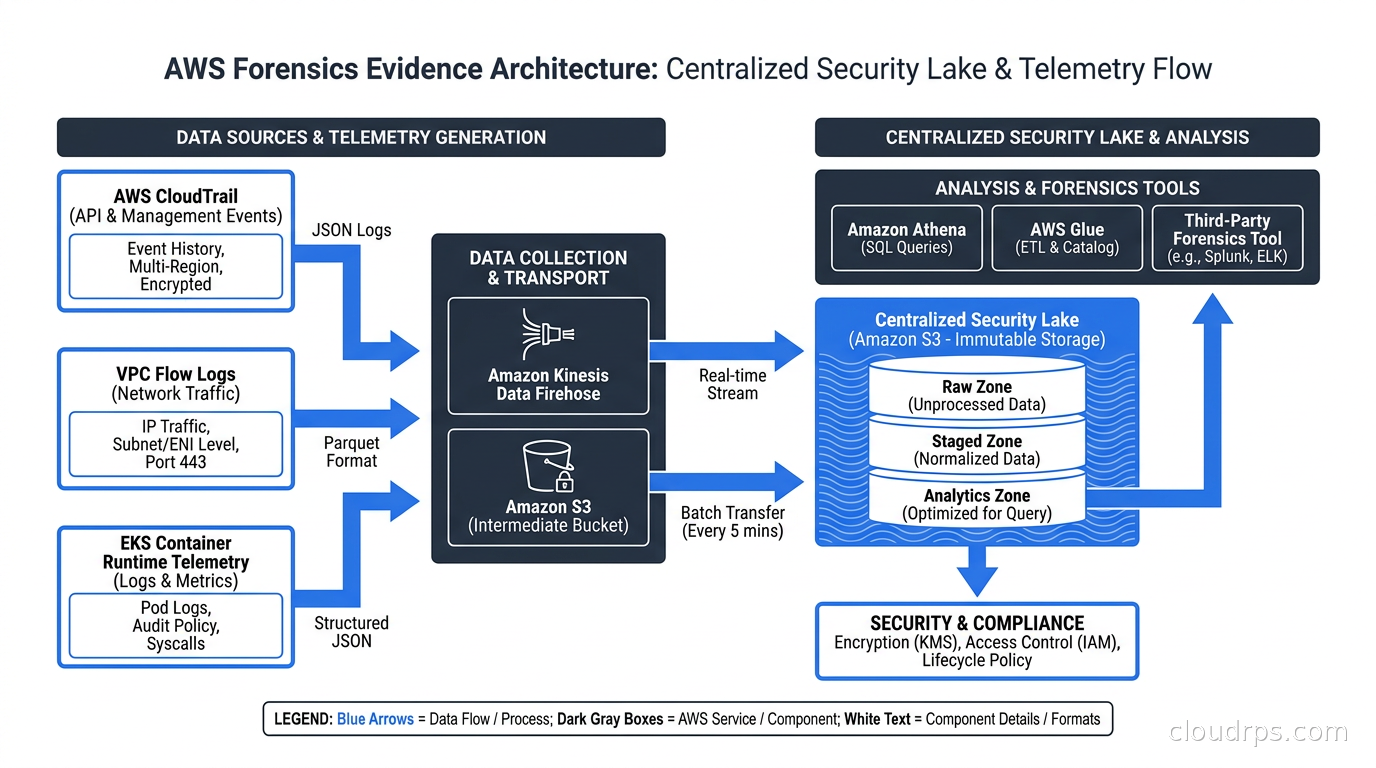
Logs are distributed and asynchronous. Reconstructing an attack timeline requires correlating events across CloudTrail (control plane API calls), VPC Flow Logs (network traffic), container runtime logs (process and syscall-level events), application logs (what the workload itself saw), and Kubernetes API server audit logs (who called what Kubernetes API). Each source has different latency, different retention defaults, and different query interfaces. If you have not normalized these into a SIEM before the incident, doing it during an incident is genuinely painful.
IAM is the new crown jewel. In cloud environments, lateral movement happens through IAM. An attacker who exfiltrates a long-lived access key from an application’s environment variables can make API calls from anywhere, without ever touching another resource in your account. There is no network traffic between your cloud account and the attacker’s laptop; there is only CloudTrail showing unusual API calls from an IP you do not recognize.
The CNAPP tools I covered earlier help with prevention and detection, but when a breach is already happening, you need a different set of reflexes.
Evidence Categories in Cloud Environments
Before you can preserve evidence, you need to know what evidence exists. Cloud environments have four major evidence categories.
Control plane logs are the most reliable. AWS CloudTrail records every API call made against your AWS account, including who made it, from where, at what time, and what the response was. This is your audit trail for IAM actions, resource creation and deletion, configuration changes, and data access patterns. Google Cloud has Cloud Audit Logs; Azure has the Activity Log and Azure Monitor. These are your most forensically reliable sources because the cloud provider generates them, they are tamper-resistant from the customer side, and they persist independently of any compute resource.
Data plane and network logs are your second tier. VPC Flow Logs capture connection-level network traffic metadata: source IP, destination IP, source and destination port, protocol, bytes transferred, and accept/reject status. They do not capture payload content. For HTTP traffic, an Application Load Balancer access log or API Gateway execution log may have request-level detail. S3 server access logs and CloudFront access logs cover data access patterns.
Runtime telemetry is the hardest to get but often the most revealing. This is the syscall-level trace of what a process actually did: which files it opened, which network connections it made, which child processes it spawned. Tools like Falco, Sysdig, and Tetragon capture this data from running containers. If you have not instrumented your runtime before an incident, you have only what survived in container stdout logs.
Application logs are the least standardized but often contain the clearest evidence of exploitation: the HTTP request with the malicious payload, the SQL query that extracted data, the command injection string. These live in your application’s logging output, which hopefully flows to a centralized log store like a security data lake or SIEM.
For AWS-specific incidents, the cloud-native SIEM architecture I described previously is well worth building before you need it. Querying six months of CloudTrail data from Athena during a live incident is a much more tractable problem than trying to reconstruct events from individual log files after the fact.
The Five-Minute Problem: Preserving Evidence Before It Vanishes
When you learn that a Kubernetes pod has been compromised, you have a small window before the normal cluster lifecycle destroys your evidence. A container restart clears the writable layer. A node replacement terminates the instance and any locally buffered logs. Pod deletion removes the pod object from etcd and terminates the container.
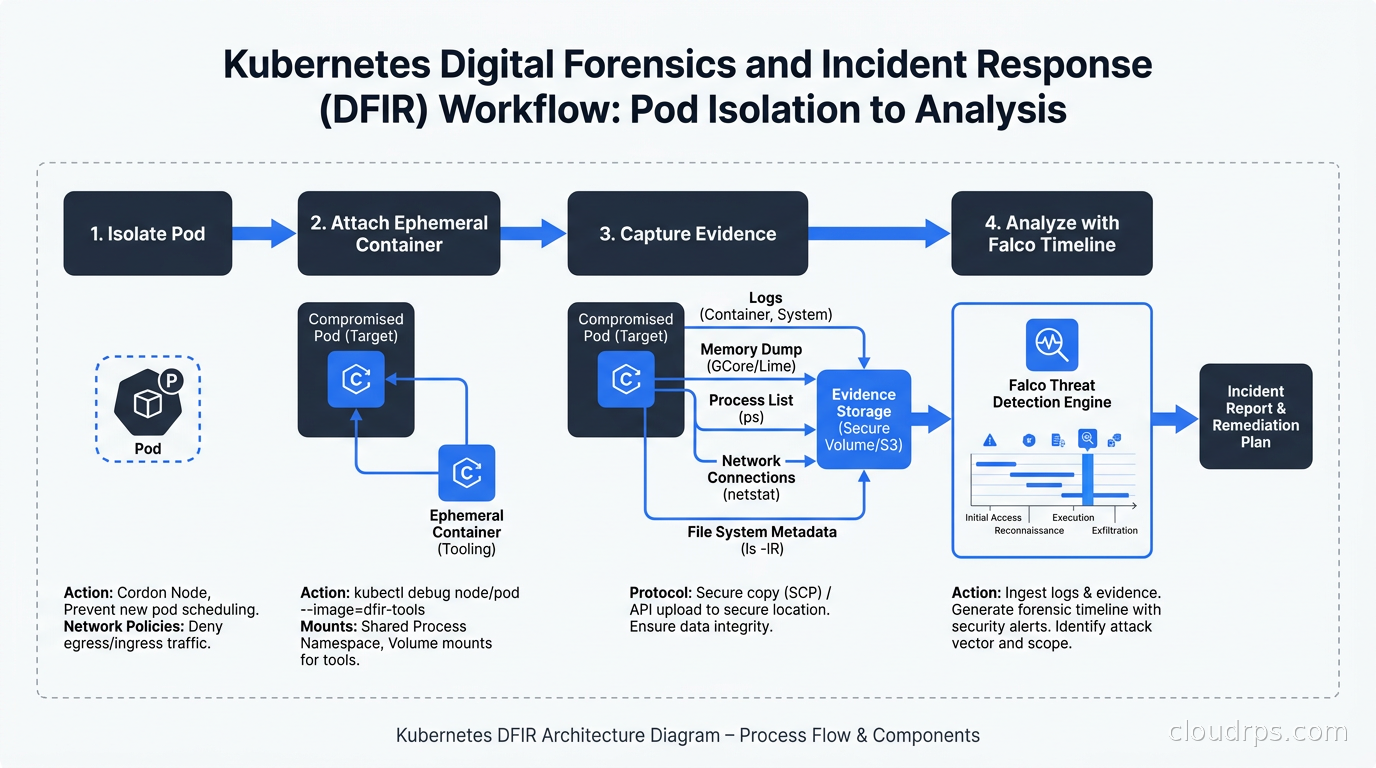
The first action in any cloud IR runbook should be isolation without termination. For a suspect pod, you want to:
- Isolate the pod from the network immediately. Do not kill it. Apply a NetworkPolicy that denies all ingress and egress to the pod’s labels while leaving the pod running.
- Cordon the node the pod runs on so the scheduler does not assign new workloads there.
- Prevent the Deployment or ReplicaSet controller from replacing the pod if it crashes. This usually means scaling the Deployment to zero or adding a
cluster.kubernetes.io/do-not-evict: "true"annotation.
For EC2 instances, the equivalent is isolating the instance by replacing its security group with one that denies all traffic except from your forensics workstation, and setting the instance’s DisableApiTermination attribute to prevent accidental termination.
This is different from traditional IR playbooks that tell you to take the affected system offline. In cloud environments, taking a container offline by killing it is the same as destroying evidence.
For AWS-specific incidents involving compromised IAM credentials, the immediate action is different. Disable the access key using aws iam update-access-key --status Inactive, not delete it. Keeping the key in a disabled state preserves the audit trail association between the key and the actions taken with it. If you delete the key immediately, some investigation tooling loses the ability to correlate CloudTrail events to the specific credential.
AWS CloudTrail Forensics: Reconstructing the Attack Chain
CloudTrail is the backbone of AWS forensics. The key concepts I want you to internalize are:
Management events vs. data events. Management events are enabled by default and cover all control plane API calls: creating or deleting resources, modifying IAM policies, updating security groups. Data events cover individual data plane operations: S3 object reads and writes, Lambda function invocations, DynamoDB PutItem/GetItem operations. Data events are not enabled by default because of their volume and cost. If you are investigating a suspected data exfiltration from an S3 bucket and data events were not enabled, you cannot tell from CloudTrail exactly which objects were accessed. This is the most common forensic gap I see.
The anatomy of a CloudTrail event. Each event has a userIdentity field that tells you who made the call, including whether it was an IAM user, a role, an assumed role (and from what source role), or an AWS service. The sourceIPAddress tells you where the call originated, which for legitimate calls is usually an internal AWS IP, an EC2 instance IP, or your corporate IP range. When investigating credential compromise, the sourceIPAddress is often the first indicator: a call from a user’s normal IP at 9 AM followed by calls from a suspicious IP at 3 AM suggests credential exfiltration.
AWS announced and launched the AWS Security Incident Response service at re:Invent 2024. As of late 2025, it offers metered pricing with a free tier covering the first 10,000 security findings per month. The service integrates with GuardDuty findings and supports structured case management, evidence collection, and direct access to the AWS Customer Incident Response Team for high-severity incidents. It is worth understanding its capabilities and enabling it before you need it, not during an active incident.
For large-scale CloudTrail analysis during an investigation, the standard approach is Athena with the CloudTrail table configured in your AWS Glue data catalog. A query that finds all API calls made with a specific access key across a time range takes seconds with Athena partition projection on the eventTime column. Without this setup, parsing JSON CloudTrail files manually is painful.
Here is the query I use to reconstruct the initial actions after a credential compromise, looking for the classic “discovery” phase where an attacker uses newly stolen credentials to enumerate their environment:
SELECT eventTime, eventName, sourceIPAddress, requestParameters, responseElements
FROM cloudtrail_logs
WHERE userIdentity.accessKeyId = 'AKIA...'
  AND eventTime >= '2026-09-19T00:00:00Z'
  AND eventName IN ('GetCallerIdentity', 'ListBuckets', 'DescribeInstances',
                    'ListRoles', 'GetAccountAuthorizationDetails', 'ListUsers')
ORDER BY eventTime;
The GetCallerIdentity call is almost always the first thing an attacker does to verify the credentials work and understand what account they have landed in.
Kubernetes Forensics: Working with Ephemeral Containers
The canonical tool for live container forensics is kubectl debug. Since Kubernetes 1.25, ephemeral containers have been stable and available on every managed Kubernetes platform. An ephemeral container is injected into a running pod’s namespaces without modifying the pod spec, without restarting the pod, and without disrupting the running workload.
kubectl debug -it <suspect-pod> \
  --image=busybox:latest \
  --target=<container-name> \
  --namespace=production \
  -- sh
The --target flag causes the ephemeral container to share the target container’s process namespace, which means you can run ps aux and see the processes inside the suspect container. From there you can examine /proc/<pid>/ for each process, read environment variables from /proc/<pid>/environ, examine open file descriptors from /proc/<pid>/fd/, and dump command-line arguments from /proc/<pid>/cmdline.
For distroless or hardened containers that have no shell, the ephemeral container approach is especially valuable because you are not adding tools to the suspect container. You are running your tools in a separate container that happens to share namespaces. This is exactly what container image hardening with distroless images aims for, and it is compatible with forensic investigation.
The network namespace sharing is equally useful. From the ephemeral container, you can run ss -tnp or netstat to see the network connections that the suspect container has open. If the container has established an outbound connection to a command-and-control IP, you will see it here.
For capturing evidence before pod deletion, a pragmatic approach is to take a snapshot of key state before you begin your investigation:
# Capture process list
kubectl exec <suspect-pod> -- ps auxf > evidence/process-list.txt 2>&1

# Capture network connections
kubectl debug -it <suspect-pod> --image=busybox --target=<container> \
  -- sh -c 'ss -tnp; netstat -plant 2>/dev/null' > evidence/network-state.txt 2>&1

# Capture environment variables (may contain stolen creds or C2 beacons)
kubectl exec <suspect-pod> -- env > evidence/env-vars.txt 2>&1

# Capture Kubernetes API server audit logs for this pod's service account
kubectl get pods <suspect-pod> -o json | jq '.spec.serviceAccountName'
Falco and Runtime Telemetry for Post-Incident Analysis
The Falco runtime security setup I described previously pays dividends during incident response even if you were not actively watching the alerts. Falco’s event output, when shipped to a SIEM or object storage, becomes your syscall-level audit trail.
During an investigation, the sequence of events you can reconstruct from Falco output includes: which processes ran inside the container, which files were opened for write (looking for webshells or persistence mechanisms), which network connections were established, and whether any privileged operations were attempted. Combined with Kubernetes API server audit logs that show what Kubernetes API calls were made using the pod’s service account, you can usually reconstruct a fairly complete attack chain.
For teams not running Falco, Tetragon’s eBPF-based enforcement and logging provides similar visibility with the added benefit of in-kernel enforcement that can terminate suspicious processes before they complete. The policy-based event export from Tetragon makes it a natural forensic data source because you can configure it to capture exactly the event classes you care about for IR: privilege escalation attempts, sensitive file access, unexpected outbound network connections.
One of the more useful Tetragon patterns for IR is a TracingPolicy that captures all execve events (process execution) with their arguments, network connections, and file opens against sensitive paths like /etc/passwd, /etc/shadow, and any credential store directories. When you replay these events against a suspected attack timeline, you can see exactly what the attacker ran.
Threat Hunting in Cloud Environments
Threat hunting in cloud is different from endpoint-based hunting because your primary query surface is API call behavior, not process execution. I have found the most productive hunting hypotheses in cloud environments are:
Lateral movement through IAM. After an initial compromise, attackers frequently use whatever IAM permissions are attached to the compromised resource to escalate. Look for role assumption chains in CloudTrail: a service role assuming another role assuming another role, or a role assumption from an unusual source IP. The AssumeRole event in CloudTrail with a roleSessionName that does not match your normal naming conventions is a reliable indicator.
Credential exfiltration from IMDS. The EC2 Instance Metadata Service is a persistent target. Any application running on EC2 that makes outbound calls to 169.254.169.254 and then shortly afterward makes AWS API calls from an external IP suggests that credentials were harvested from IMDS. The IMDSv2 requirement (requiring a PUT request to get a token before reading metadata) significantly raises the bar for this attack, but not all instances enforce IMDSv2.
Data exfiltration staging. Before a large exfiltration, attackers often stage data internally: copying objects between S3 buckets, creating snapshots of EBS volumes, or compressing data in a staging location. Look for CreateSnapshot, CopyObject, and PutObject API calls against buckets or instances that the source identity does not normally interact with.
Persistence mechanisms. In cloud environments, persistence often looks like new IAM user creation, new access key creation for existing users, modifications to CloudTrail or GuardDuty configurations (disabling logging is a classic attacker move), and new Lambda functions or event rules that trigger on API calls.
For open-source threat hunting at scale, Velociraptor (now an open-source project from Rapid7) supports cloud environments alongside endpoint coverage and has VQL query capabilities that can be adapted for cloud log analysis. For environments that are primarily cloud-native, I tend to prefer purpose-built cloud query surfaces like Athena or BigQuery over endpoint-centric tools.
Building a DFIR-Ready Cloud Architecture
The single most effective thing you can do for incident response is build evidence-preservation infrastructure before any incident occurs. The classic failure mode is discovering during an investigation that the logs you need are either not enabled, are in a format you cannot query quickly, or have already been rotated out of retention.
My minimum standard for a DFIR-ready AWS account:
CloudTrail organization trail to a hardened S3 bucket. An organization trail captures events across all accounts in your AWS Organization. The destination bucket should have S3 Object Lock enabled (WORM storage) with a retention period that matches your compliance requirements. MFA Delete should also be enabled. This makes it much harder for an attacker who has compromised a developer’s credentials to cover their tracks by deleting CloudTrail logs.
VPC Flow Logs to S3 or CloudWatch Logs. Enable flow logs for all VPCs, not just production ones. Lateral movement often uses non-production VPCs as stepping stones. I recommend at least 90-day retention in a queryable store, with Athena tables set up for quick ad-hoc queries.
GuardDuty enabled across all regions and all accounts. GuardDuty integrates with the AWS Security Incident Response service and can trigger automated response actions via EventBridge. Its threat intelligence is continuously updated by AWS and provides coverage for behavioral anomalies that pure log analysis misses.
Kubernetes API server audit logging. For EKS, enable audit logging and ship it to CloudWatch Logs or a centralized log store. The default audit policy is often too permissive (logs too much noise) or too restrictive (misses key events). A well-tuned audit policy captures all authentication failures, all access to secrets, all exec and port-forward events (which attackers use for interactive shell access), and all changes to RBAC objects.
Immutable runtime telemetry. If you are running Falco or Tetragon, route their output through an immutable pipeline: a log shipper writing to an S3 bucket with Object Lock, or a SIEM with tamper-evident storage. A sophisticated attacker who gains cluster-admin access can delete Falco pods, but they cannot retroactively delete events that already landed in S3.
For zero trust infrastructure access through tools like Teleport, the session recording capability becomes a forensic asset during incident response. Every kubectl exec session, every SSH session, and every database query executed through Teleport is recorded with a tamper-evident audit trail. In one investigation I worked, we reconstructed the entire attack chain from Teleport session recordings when the Kubernetes audit logs had insufficient verbosity.
The IR Playbook for Common Cloud Attack Scenarios
Every cloud IR program needs documented playbooks for the scenarios that actually happen. The three most common I have dealt with:
Compromised IAM credential. First action: disable the access key. Second: identify all API calls made with that key in the last 30 days from CloudTrail. Third: identify any resources the credential created that are still running (look for EC2 instances, Lambda functions, or IAM roles created with unusual timestamps). Fourth: check if the credential was used to create additional IAM users or access keys (persistence). Fifth: rotate any downstream credentials that might have been accessible to the compromised identity.
Compromised container with exfiltration. First action: isolate the pod with NetworkPolicy and prevent deletion. Second: capture the evidence described above (process list, network state, environment variables). Third: check the pod’s service account for what IAM permissions are attached (via annotations if using IRSA). Fourth: query CloudTrail for API calls made with the pod’s service account identity during the suspected compromise window. Fifth: check VPC Flow Logs for unusual outbound connection destinations and data volumes.
Ransomware / destructive attack. First action: take S3 bucket versioning and Object Lock status for all buckets. If versioning was not enabled, assess whether AWS Backup can restore from snapshots. Second: isolate affected systems and disable the compromised credentials. Third: use CloudTrail to find the initial access event (often an API call that created or modified a Lambda function that was later used to execute the ransomware logic). Fourth: preserve all evidence before taking any recovery actions.
Kubernetes RBAC and the Forensic Blast Radius
One of the most common findings during cloud incident response is that the blast radius was much larger than it needed to be because of overpermissioned service accounts. A pod running as a service account with cluster-admin permissions gives an attacker who compromises that pod complete control over the entire Kubernetes cluster.
After any Kubernetes security incident, I always audit the RBAC configuration as part of the forensic work. The Kubernetes RBAC article I wrote earlier covers the lockdown side, but from a forensic perspective, you need to understand what permissions the attacker actually had. Run:
kubectl auth can-i --list --as=system:serviceaccount:<namespace>:<serviceaccount>
This tells you every action the compromised identity could have taken. Even if you have not yet found evidence of all those actions in your logs, you need to assume they occurred and look for persistence mechanisms and downstream effects.
The intersection of Kubernetes security hardening and forensic readiness is tighter than many teams realize. A well-hardened cluster is also an easier cluster to investigate: immutable container filesystems mean you know any file changes in the writable layer are suspicious, restricted network policies mean any unexpected network traffic stands out, and minimal service account permissions limit the blast radius you need to investigate.
Where to Start
If your team has not done any of this before, I recommend prioritizing in this order:
First, get CloudTrail organization trail with Object Lock enabled. This is cheap, takes a few hours to configure, and is your single most important forensic data source. Second, enable GuardDuty across all accounts and regions, including the EKS protection and S3 protection modules. Third, ship your Kubernetes API server audit logs to a queryable store and build the Athena tables for CloudTrail. Fourth, add a runtime telemetry tool (Falco or Tetragon) to your cluster with output routing to immutable storage.
Then write and rehearse your playbooks. A tabletop exercise where your team walks through an IAM compromise scenario using your actual CloudTrail data and Athena queries is worth more than any amount of theoretical preparation. The first time you query CloudTrail under pressure should not be during a real incident.
Cloud forensics is a skill that atrophies fast if you do not practice it. The environment changes frequently, new attack techniques emerge, and the tools evolve. Building the architecture for evidence preservation is the prerequisite; practicing the investigation workflow is what makes the architecture useful when it actually matters.
Get Cloud Architecture Insights
Practical deep dives on infrastructure, security, and scaling. No spam, no fluff.
By subscribing, you agree to receive emails. Unsubscribe anytime.