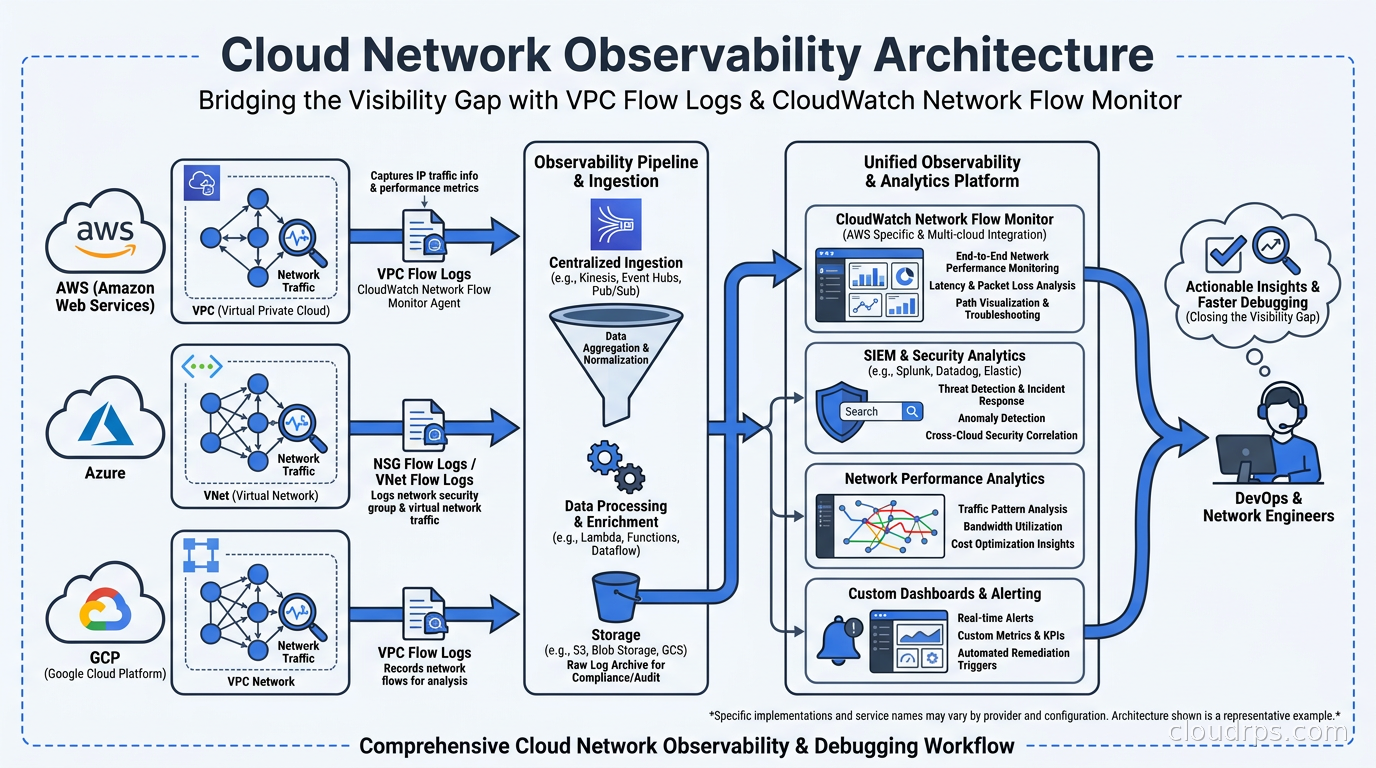
After twenty years of building and debugging cloud infrastructure, I’ve come to believe that most teams are running almost blind on their own networks. They have beautiful Grafana dashboards showing CPU, memory, request latency, and error rates. They have distributed tracing showing every hop between microservices. But ask them what’s actually happening at the network layer, which EC2 instance is sending gigabytes of traffic to an unexpected destination, why that RDS call latency doubled last Tuesday afternoon, or what percentage of their traffic crosses availability zones at peak load, and the answer is usually: we don’t know.
Network observability is the unsexy sibling of application observability, and most teams neglect it until they have a production incident that nothing else can explain. That’s too late.
This guide is about building real network visibility into cloud infrastructure before you need it: what tools each major cloud provider gives you, how to actually make flow logs useful rather than a data dump you never query, and where the gaps are that require eBPF or dedicated network performance monitoring tools to fill.
The Problem: Application Observability Has a Blind Spot
Application-layer observability (OpenTelemetry traces, Prometheus metrics, structured logs) tells you what your code is doing. It doesn’t tell you what your packets are doing. Those are different things, and the gap between them is where certain categories of problems hide.
I’ll give you a concrete example. At a previous engagement, a team had been chasing a “database performance issue” for three weeks. Query latency was high and variable. They’d tuned indexes, analyzed query plans, added read replicas. Nothing helped. When I finally got them to query their VPC flow logs, the picture became obvious in about ten minutes: their application instances were in us-east-1a, their primary RDS instance was in us-east-1b, and a configuration change three weeks earlier had moved the read replicas to us-east-1a. Every read that was supposed to be “local” was now hitting the primary across AZs. The network layer told the story the application layer couldn’t.
That’s the kind of problem VPC flow logs and proper network observability catch. The application layer just sees latency.
AWS: VPC Flow Logs and CloudWatch Network Flow Monitor
AWS has two distinct network observability tools and it’s worth being precise about what each one does, because they’re often confused.
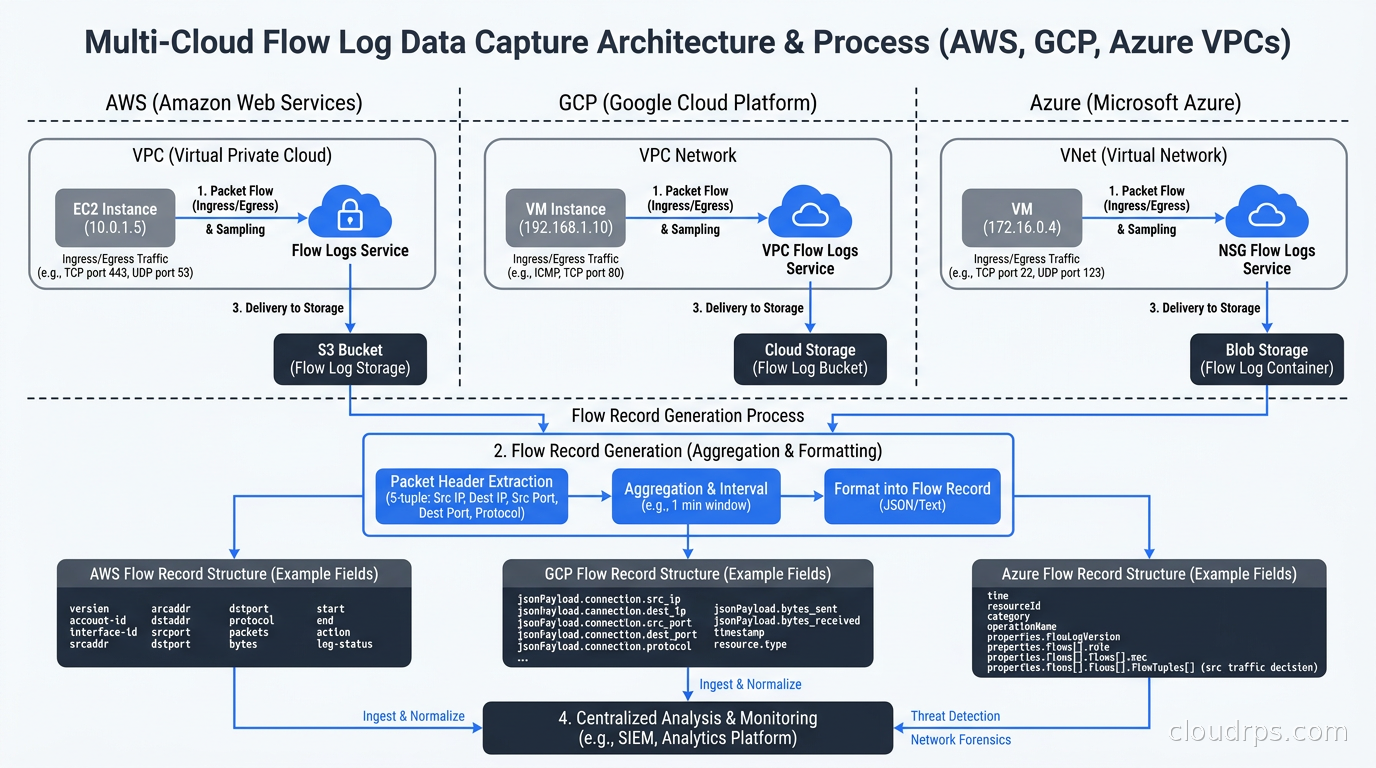
VPC Flow Logs are the original: they capture connection metadata (source/destination IP, port, protocol, bytes, packets, action allowed/denied) for traffic going through a VPC, subnet, or network interface. They don’t capture payload content. Flow logs go to CloudWatch Logs, S3, or Amazon Data Firehose. This is the foundational tool for understanding who’s talking to whom inside your infrastructure.
A few things about flow logs that catch people out in production:
The default log format captures the basic five-tuple plus some metadata. The custom format (available since VPC flow logs v3 and later) adds fields like traffic-path, flow-direction, pkt-srcaddr, pkt-dstaddr, and subnet-id that are essential for debugging more complex topologies with NAT gateways, Transit Gateway, and PrivateLink in the mix. If you’re not using the custom format, you’re missing context.
Flow log delivery has latency. Logs typically aggregate over one or five-minute intervals and can be delayed by several minutes in delivery. This means flow logs are for forensics and analytics, not real-time alerting. Plan accordingly.
For VPC connectivity architectures involving Transit Gateway, the Traffic Mirroring feature is a separate, more powerful tool: it copies actual packet data to a monitoring appliance. This is expensive (you pay per mirrored byte) and complex to set up, but it’s the only way to get actual packet inspection for security monitoring in AWS environments where you need to run IDS tools.
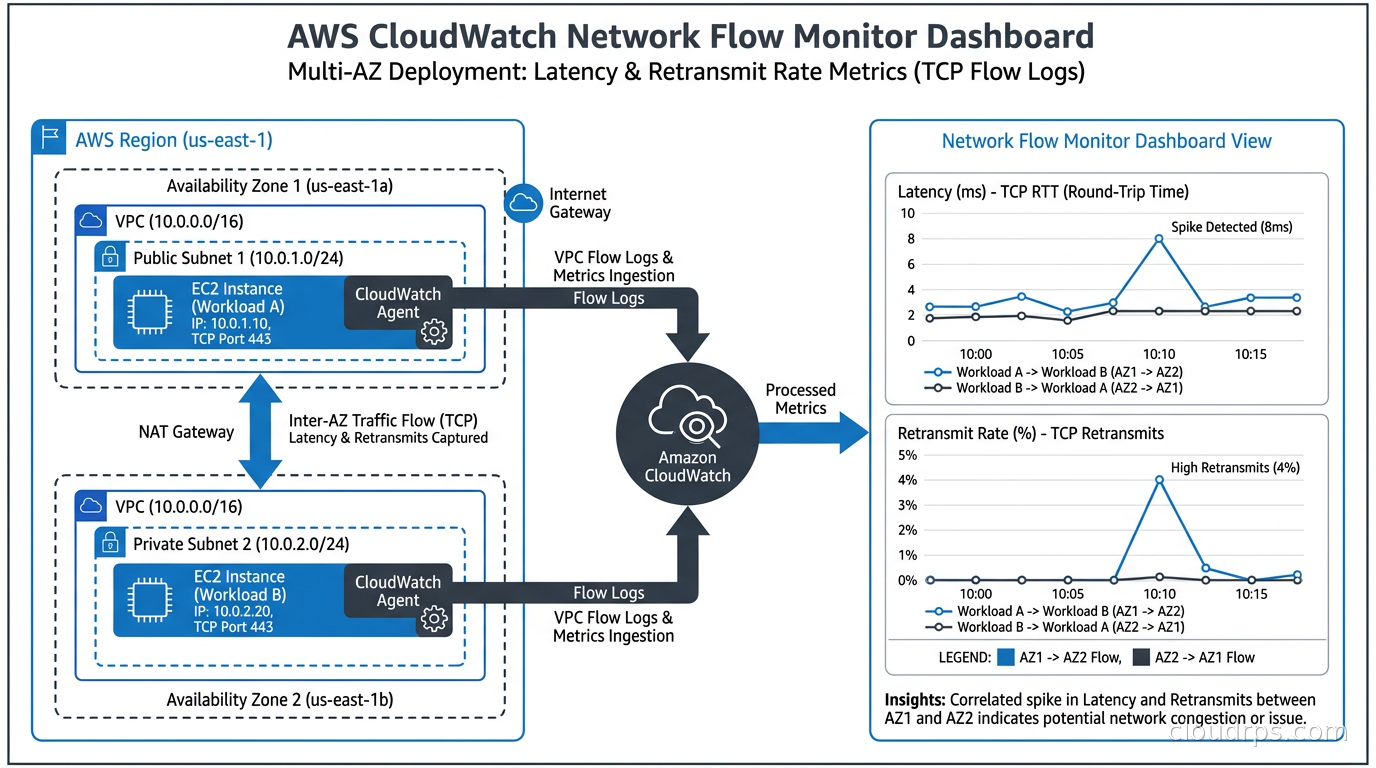
CloudWatch Network Flow Monitor is a newer and quite different tool, launching in December 2024. Where VPC flow logs give you raw connection records you have to analyze yourself, Network Flow Monitor instruments the network path between specific workloads and gives you pre-computed metrics: latency, retransmit rate, and packet loss for specific network flows. AWS added multi-account support via AWS Organizations in May 2025, and cross-region visibility arrived in September 2025, letting you monitor traffic traversing the AWS global backbone between regions.
The key distinction: VPC flow logs answer “who talked to whom?” Network Flow Monitor answers “how well did that connection perform?”
For querying flow logs at scale, the standard pattern is to deliver them to S3 and query with Amazon Athena. A properly partitioned table (by region, account, day) with Parquet format transforms flow log queries from expensive to reasonable. I’ve seen teams pay substantial Athena bills querying unpartitioned flow logs in plain text format, burning through gigabytes per query when they could have been scanning kilobytes with proper partition pruning.
-- Example: Find top talkers in the last 24 hours from an unexpected CIDR
SELECT srcaddr, dstaddr, sum(bytes) as total_bytes
FROM vpc_flow_logs
WHERE partition_date = '2026/11/03'
  AND action = 'ACCEPT'
  AND srcaddr NOT LIKE '10.%'
  AND srcaddr NOT LIKE '172.16.%'
GROUP BY srcaddr, dstaddr
ORDER BY total_bytes DESC
LIMIT 20;
Combining flow logs with CloudWatch alarms for specific traffic patterns, like sudden spikes in bytes to unexpected CIDRs, is a lightweight way to build network-level anomaly detection without deploying a full SIEM.
GCP: VPC Flow Logs and Network Intelligence Center
GCP’s approach to network observability is more integrated than AWS’s, partly because GCP’s networking model is more opinionated. VPC Flow Logs on GCP capture per-connection records for traffic on VM instances, GKE nodes, VLAN attachments, and Cloud VPN tunnels. The sampling rate is configurable: you can log 100% of flows (expensive) or sample at a lower rate (cheaper but you’ll miss short-lived connections). For security investigations, 100% sampling is worth the cost. For baseline traffic analysis, 10-50% is usually sufficient.
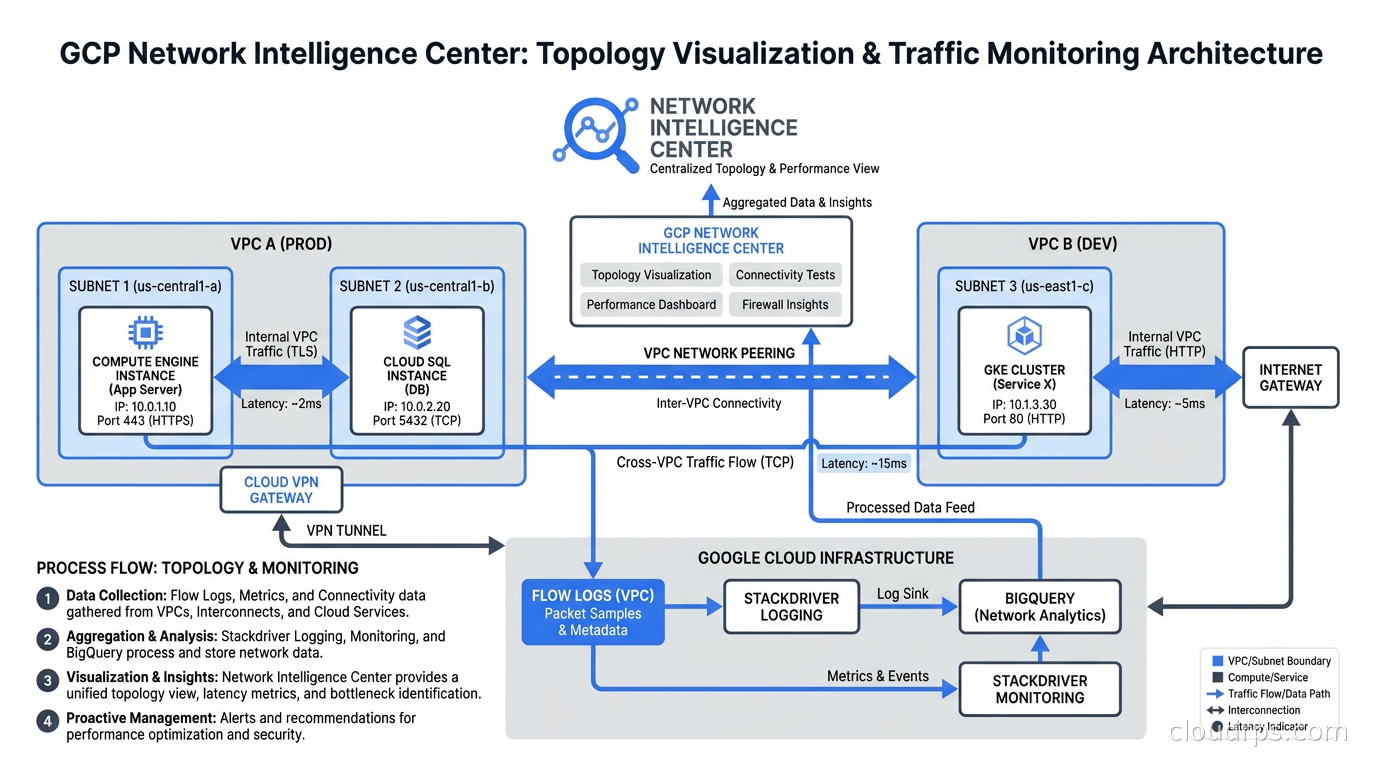
Network Intelligence Center is GCP’s unified console for network observability and troubleshooting. It has several distinct modules worth understanding:
Connectivity Tests is the most immediately useful for debugging. You describe a hypothetical traffic path (source IP, destination IP, protocol, port) and the tool simulates whether that traffic would be allowed, tracing through VPC firewall rules, routes, and network configurations. This saves hours of manual firewall rule archaeology. As of early 2026, it supports organization-level secure tags on firewalls and identifies routes dropped due to peering quotas, two common gotchas in large multi-VPC environments.
Network Topology visualizes the connections between VMs, subnets, and VPCs, with traffic volume and latency metrics overlaid. When you’re trying to understand data flow through a complex architecture, the topology view is faster to reason about than raw flow log data. The visualization shows you which paths are actually being used versus which exist on paper.
Firewall Insights analyzes your firewall rules and flags overly permissive rules, rules that shadow other rules, and rules that have never been hit. I’ve used this to clean up firewall rule bloat in projects inherited from other teams. Finding a rule that allows all TCP traffic from 0.0.0.0/0 that was added “temporarily” in 2022 and forgotten is exactly the kind of thing this surfaces.
Cloud Network Insights provides ongoing monitoring of network performance and surfacing anomalies like asymmetric routing or degraded path performance. This module reached general availability in mid-2026.
GCP also recently launched an MCP server for the Network Management API (March 2026), which lets you create and run Connectivity Tests through AI tools. The practical use case is letting an operator ask natural-language questions like “can my Cloud Run service reach this AlloyDB instance?” and get a definitive answer. It’s genuinely useful for teams using AI-assisted operations.
Azure: Virtual Network Flow Logs and Network Watcher
Azure’s story here has an important transition happening right now. The original NSG Flow Logs (Network Security Group flow logs) are being retired: Microsoft stopped allowing creation of new NSG flow logs on June 30, 2025, with full service retirement on September 30, 2027. The replacement is Virtual Network Flow Logs, which solve several limitations of the NSG-based approach.
The key improvement: NSG flow logs were attached to Network Security Groups, which meant you had to manage logs at the NSG level across all your resources. VNet flow logs operate at the virtual network level, giving you unified visibility across a VNet without managing logs on individual NSGs. They also support sending data directly to Azure Monitor Logs (Log Analytics) or storage accounts, with the same Traffic Analytics integration that NSG flow logs supported.
If you’re still running NSG flow logs in Azure, the migration path is straightforward in principle but requires careful planning in practice. You need to verify that your existing Traffic Analytics workspaces can accept VNet flow log data, and you need to update any downstream queries or dashboards that parse the specific NSG flow log schema, which differs slightly from VNet flow logs.
Azure Network Watcher provides the broader toolkit:
IP Flow Verify is the Azure equivalent of GCP Connectivity Tests: you specify a traffic flow and it tells you which NSG rule allows or denies it, and shows you the exact rule name. This is the fastest way to debug “why can’t host A reach host B?” in Azure.
Connection Monitor continuously tests reachability between sources and destinations (VMs, App Services, external endpoints) and tracks latency and packet loss over time. Unlike VPC flow logs which are reactive, Connection Monitor gives you proactive SLO-style visibility into whether your connectivity is healthy. I’ve used it to track latency between Azure regions in multi-region deployments and get alerted before users notice degradation.
Packet Capture lets you trigger on-demand packet captures on VM network interfaces, stored to a storage account or directly to a VM disk. Unlike Traffic Mirroring in AWS, Azure Packet Capture is event-driven rather than continuous, which keeps costs manageable. The trigger can be manual (useful for investigation) or rule-based (capturing when specific conditions are met).
Traffic Analytics sits on top of VNet (or NSG) flow logs and runs analytics workloads in Log Analytics to give you visualizations of top talkers, geographic traffic distribution, security threat identification, and application flow maps. The queries it pre-builds for you are mostly useful, though they don’t replace custom Kusto queries for specific investigation needs.
Making Flow Logs Actually Useful
The most common failure mode I see is teams enabling flow logs, paying for them, and never querying them. The data exists; the practice doesn’t.
Three things make flow logs actually useful in production:
Have a baseline. Before you can spot anomalies, you need to know what normal looks like. Run regular summarization queries against your flow logs to understand your top-N traffic patterns by source/destination pair, by port, and by bytes. Document this. When something changes, you have something to compare against.
Alert on unexpected outbound traffic patterns. Establish a known set of outbound destination CIDRs (your CDNs, your SaaS APIs, your cloud provider’s service endpoints). Set up alerts for significant traffic flows to destinations outside that set. This catches both misconfigured applications and security incidents. The alert doesn’t need to be real-time; daily digest of unexpected destinations is sufficient for most teams.
Connect flow logs to your incident response playbook. When you have a cloud incident, flow logs should be in your first five minutes of investigation, not an afterthought. Add a step to your runbook: “Query VPC flow logs for the affected resource for the incident time window.” The query should already exist. This is the equivalent of having tcpdump in your toolbox on a physical network: you hope not to need it, but when you do, you need it immediately.
eBPF and In-Cluster Observability
VPC flow logs operate at the cloud network boundary. Inside a Kubernetes cluster, between pods on the same node, they see nothing. That’s where eBPF-based tools fill the gap.
Cilium’s Hubble component gives you flow-level observability for all traffic within a Kubernetes cluster: pod-to-pod, pod-to-service, and pod-to-external. Hubble captures connection metadata, DNS lookups, HTTP transactions, and kafka messages (with protocol-aware parsing), all without touching application code. The Hubble UI shows you a service dependency graph built from actual observed traffic, not from configuration. This is invaluable for understanding what your services are actually talking to versus what you think they’re talking to.
For teams not running Cilium, eBPF-based observability through tools like Pixie (now part of the CNCF ecosystem) or Deepflow gives similar in-cluster visibility. The key capability is that eBPF hooks into the kernel before packets reach any user-space handling, so it sees traffic that never shows up in application logs or even in VPC flow logs (intra-node communication never leaves the host).
The combination of VPC flow logs (cloud boundary) and eBPF-based observability (within-cluster) gives you end-to-end network visibility across your entire stack. Most teams are missing both. Having one without the other leaves gaps.
Understanding Egress Through Flow Logs
One of the more immediately ROI-positive uses of flow logs is understanding your cloud egress costs. If you’re running a meaningful workload in AWS, GCP, or Azure, you’re paying for egress, often more than you realize. The question is: what’s driving it?
Flow logs give you the raw data: bytes transferred, source, destination. With a bit of classification (is the destination IP in a known CDN range? A cloud provider’s service endpoint? Another region? The public internet?), you can build a traffic cost attribution model. I’ve done this analysis and found teams spending thousands of dollars per month on cross-AZ data transfer between services that could have been co-located, and other teams unknowingly exfiltrating compressed dataset snapshots to development workstations over the public internet.
Flow logs won’t tell you the dollar cost directly, but they give you the byte counts and the traffic paths that you can multiply by your pricing tier to get there. This is real FinOps work, not dashboard theater.
Correlating Network and Application Telemetry
The highest-value state is when you can correlate network-layer events with application-layer telemetry. A latency spike in your distributed traces that coincides with increased retransmit rates in CloudWatch Network Flow Monitor tells a much clearer story than either signal alone.
This correlation is currently manual in most toolchains. The standard stack (Prometheus, Loki, Grafana) has reasonable support for multi-source dashboards, but joining network flow metrics with application traces requires either building custom dashboards or using a commercial observability platform that ingests both.
OpenTelemetry’s distributed tracing propagates trace context through application code. Network telemetry doesn’t carry trace context because it operates below the application layer. Bridging them requires either adding correlation by timestamp and service identity (approximate), or deploying eBPF tools that can read trace context from TCP payloads and annotate flow records accordingly. Pixie does this to some extent. It’s still a rough area in the tooling landscape.
Practical Starting Point
If your team has zero network observability today, here’s the minimum viable practice to implement:
Enable VPC flow logs (or VNet flow logs for Azure) on your production networks. Send them to S3 or equivalent object storage with five-minute aggregation. Set a lifecycle policy to expire raw logs after 30-90 days (compliance may require longer).
Set up a partitioned Athena table (or BigQuery external table for GCP) for the flow log data. Run an ad-hoc baseline query once a week to know your top-10 traffic patterns.
Enable CloudWatch Network Flow Monitor (AWS) or Cloud Network Insights (GCP) or Azure Connection Monitor for your critical service-to-service paths. These are the paths where performance degradation would constitute an incident: app servers to databases, services to caches, services to downstream APIs.
Add a network layer query step to your incident response runbook. When something is slow or broken, one of the first questions is: does the network data show anything unusual?
If you’re running Kubernetes, deploy Hubble or equivalent eBPF observability alongside your existing cluster monitoring.
None of this is exotic. The tools are available on every major cloud provider, most are included in base pricing or charge modestly for storage. What they require is intention: deciding that understanding your network is worth the fifteen minutes of configuration and the ongoing practice of actually querying the data.
What Flow Logs Won’t Tell You
It’s worth being honest about the limits. Flow logs are connection-level metadata: source, destination, bytes, packets, timestamps, allow/deny. They don’t capture:
- Payload content (you need packet capture for that)
- Application-layer behavior (which HTTP paths were called, which queries were run)
- Sub-connection granularity (a long-lived TCP connection looks like one flow even if it’s doing many things)
- Timing within a flow (whether latency happened at connection establishment, during data transfer, or at close)
For security investigations requiring payload inspection, Traffic Mirroring (AWS), packet capture (Azure Network Watcher), or deploying a network detection and response (NDR) tool is necessary. For application-level performance analysis, you need application observability: traces, profiling, query logs.
Network observability and application observability are complements, not substitutes. The goal is to have both, so you can triangulate quickly when something goes wrong.
After twenty years of debugging production systems, the incidents that take longest to resolve are almost always the ones where the team lacks one of these layers of visibility. The network layer is typically the gap. The good news is that every major cloud provider has built reasonable tooling for it, and most teams could have meaningful network observability in production in a single day’s work. The only question is whether you do it before the next incident or during it.
Get Cloud Architecture Insights
Practical deep dives on infrastructure, security, and scaling. No spam, no fluff.
By subscribing, you agree to receive emails. Unsubscribe anytime.