In 2022, I helped a large e-commerce company investigate why their recommendation engine had been performing 18% worse than expected for three weeks before anyone noticed. The engineers assumed it was a model drift issue. The data scientists assumed it was a product catalog change. We spent two weeks auditing the model, retraining, A/B testing. None of it helped.
The actual problem: a partner integration had started sending null values for a product attribute that fed directly into the recommendation features. The null rate went from 0% to 34% over four days. Nobody saw it because nobody was watching for it. The pipeline didn’t fail. No exceptions were thrown. Data flowed, it was just wrong, and the downstream model quietly degraded until a business analyst noticed the recommendations were surfacing products people weren’t buying.
That three-week gap between failure and detection cost the company somewhere north of $2 million in lost recommendation revenue. The fix, once we found it, took 45 minutes.
This is the data quality failure pattern I see repeatedly: the pipeline succeeds, the data is wrong, and nobody knows until the business finds out first.
Data observability is the discipline of building the monitoring layer that catches these failures. It’s not a new concept, but it’s finally getting the infrastructure investment and tooling it deserves, and in 2026, I’d argue it’s as essential as application performance monitoring was in 2015.
What Data Observability Is (and Isn’t)
The term gets muddied because “observability” is already used heavily in the infrastructure world. OpenTelemetry and distributed tracing gave us a framework for understanding what’s happening inside our services. Data observability is the parallel concept for the data layer: understanding what’s happening inside your data pipelines, not just whether they executed.
The distinction matters. A pipeline can run to completion with green checkmarks in your orchestrator while producing catastrophically wrong data. Traditional infrastructure monitoring (is the job running? did it finish? how long did it take?) tells you nothing about the quality of what the job produced.
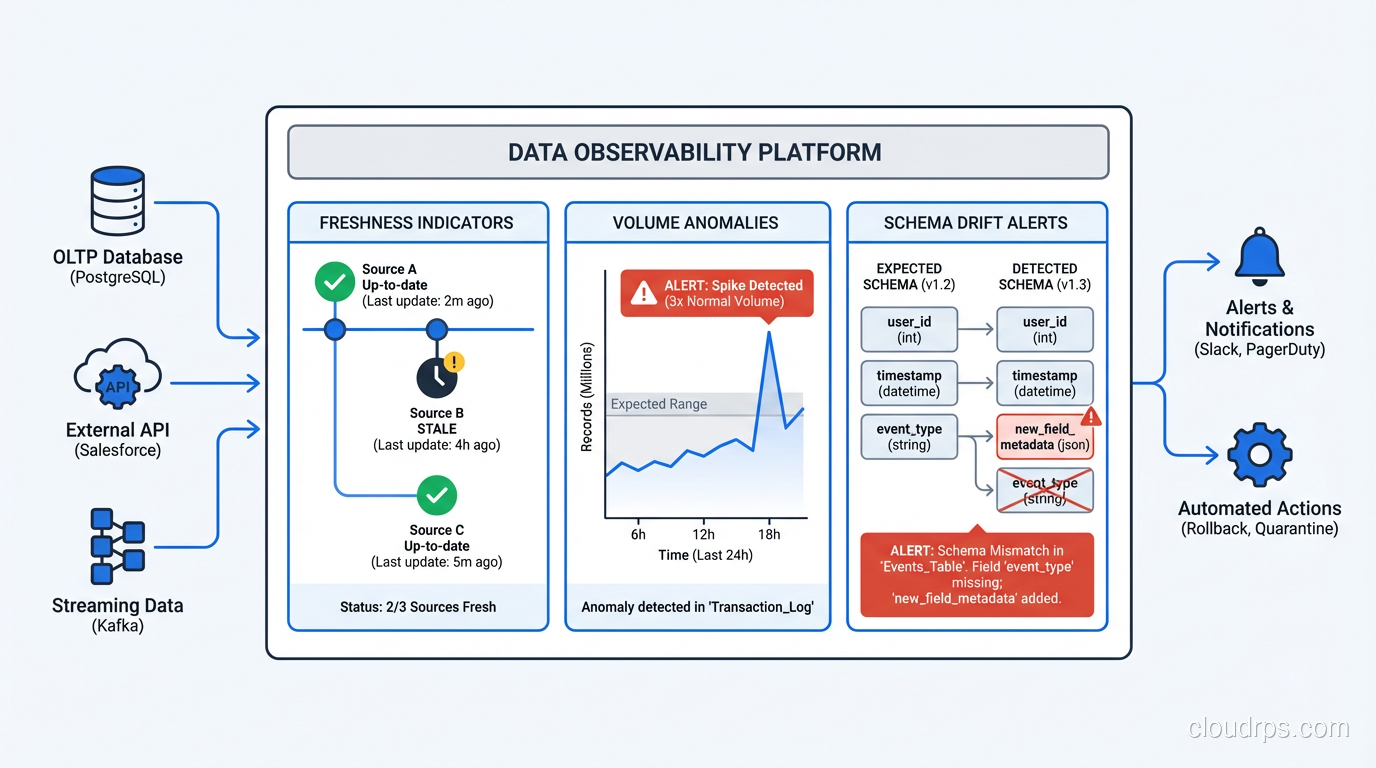
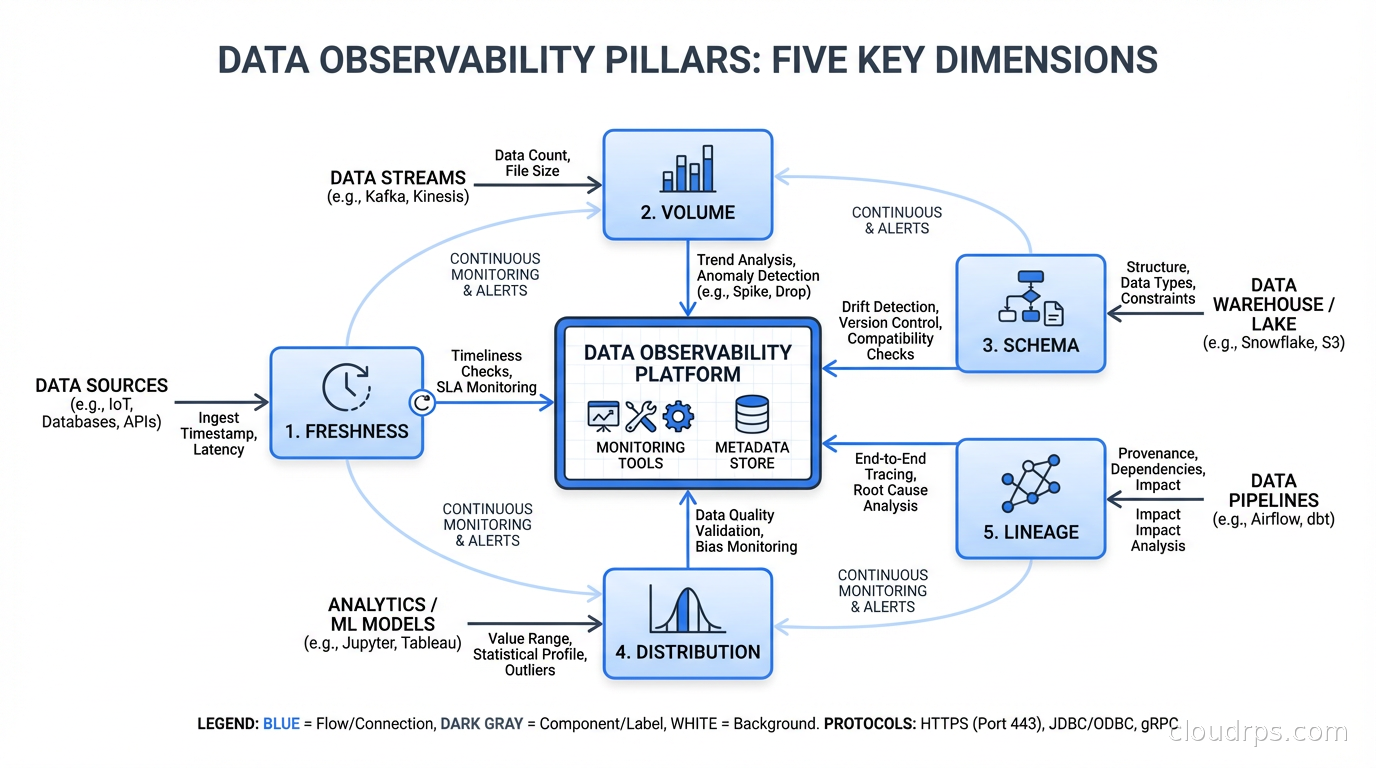
Data observability specifically covers:
Freshness: Is the data arriving when it’s supposed to? If a table should be updated every hour and it’s been three hours since the last update, something is wrong. This sounds obvious but I’ve seen production data warehouses where entire analytics dashboards were running on day-old data because nobody had set up freshness monitoring.
Volume: Is the expected amount of data flowing? A sudden 40% drop in row count isn’t always a pipeline failure. Sometimes the source system had a slow day. But sometimes it means you lost a partition, or an upstream process stopped sending data, or someone accidentally filtered out 40% of your events. Volume monitoring catches these.
Schema: Are the columns still what you expect them to be? Schema drift is one of the most common failure modes in data pipelines. An upstream team changes a field name, makes a nullable field required, or drops a column entirely. Your pipeline might not break immediately, it might just silently drop that field or propagate nulls. Schema change detection catches this before it propagates.
Distribution: Are the values within the expected range? If a field that normally has values between 0 and 1 starts showing values of 10,000, that’s a unit conversion error or a data bug. If a categorical field that normally has 5 distinct values suddenly has 500, something changed upstream. Statistical distribution monitoring is the hardest of these to implement well, but it catches the most subtle bugs.
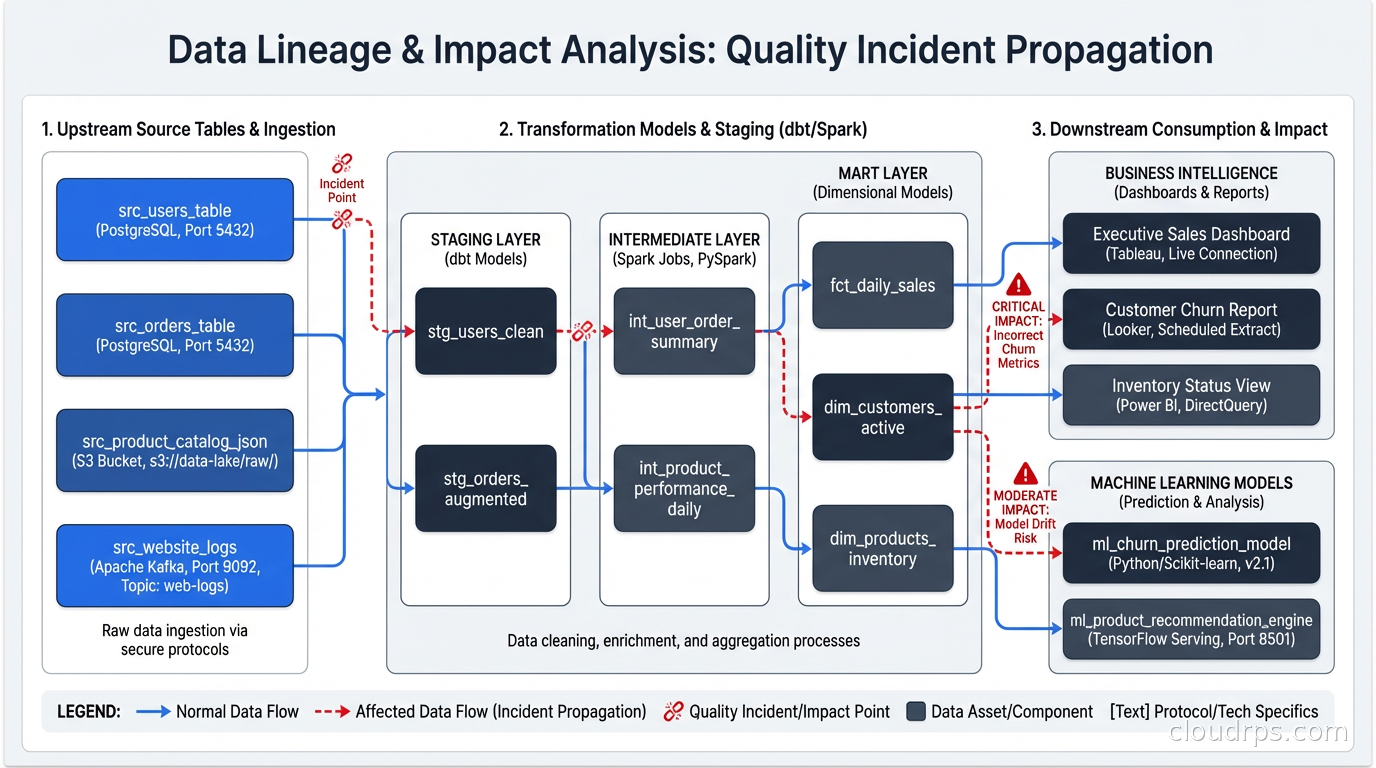
Lineage: When something goes wrong, can you trace which upstream sources and which downstream consumers are affected? Data lineage is the “who’s calling whom” map for your data, and without it, impact analysis during an incident is essentially guesswork.
Why This Is Different From Traditional Monitoring
Engineers who come from an infrastructure monitoring background often ask why they can’t just add checks to their pipeline code. The answer is that you can, and that’s actually a fine starting point. But there are a few reasons this gets hard at scale:
The combinatorial explosion. A moderately complex data platform might have 500 tables, 10,000 columns, and dozens of pipelines feeding them. Writing explicit assertions for every column in every table is not realistic. You need statistical baselines and anomaly detection, not just threshold checks.
The schema evolution problem. Your data contracts with upstream systems change constantly. The most dangerous scenario isn’t a sudden schema change, it’s a gradual one: a team slowly migrating from one field to another over months, with the old field having decreasing data while the new one fills up. Rule-based monitoring misses this. Statistical monitoring catches it.
The lineage requirement. When you discover a quality issue, the first question is “what’s affected?” Without lineage tracking, you’re manually tracing dependencies through documentation that’s either out of date or doesn’t exist. Automated lineage lets you answer “which dashboards, models, and downstream pipelines consumed this bad data?” in seconds rather than hours.
The cross-pipeline nature of failures. In a stream processing architecture with Kafka and Flink, a data quality issue in an upstream topic propagates downstream in real time. By the time you notice it in the output, the bad data has already contaminated multiple consumers. Catching it at the source requires monitoring at the ingestion layer.
For teams building on a data mesh architecture, data observability becomes even more critical because you’ve decentralized ownership. Each domain team is responsible for their data product’s quality. Without automated observability, “responsible for quality” becomes “responsible for figuring out when someone complains.”
The Tooling Landscape in 2026
The data observability market has matured significantly. The main options:
Monte Carlo: The most enterprise-complete solution. Connects to your data warehouse, infers baselines from historical data automatically, and provides lineage through metadata scanning. The strength is setup time: you can get freshness, volume, and schema monitoring running in a day without writing any rules. The weakness is cost (it’s expensive) and the fact that the automatic baseline detection can take weeks to tune and still misses domain-specific edge cases.
Great Expectations: The open-source option. You write expectations (assertions about your data) in Python, run them as part of your pipeline, and get a data docs site that shows pass/fail history. The strength is precision: you define exactly what you’re checking. The weakness is maintenance overhead. As your schema evolves, someone has to update the expectations. It’s excellent for critical tables where you want rigorous, explicit contracts. It doesn’t scale across hundreds of tables without significant investment.
Soda: Somewhere between the two. YAML-based checks that are more maintainable than Great Expectations Python, with a commercial cloud layer for lineage and collaboration. The sweet spot for teams that want something explicit but don’t want to write Python for every check.
dbt tests: If you’re already using dbt for transformations, dbt’s built-in test framework handles basic schema validation and referential integrity. It won’t do statistical anomaly detection, but it catches null violations, uniqueness constraints, and accepted value ranges without additional tooling. Start here if you’re already in the dbt ecosystem.
Native warehouse features: Snowflake, BigQuery, and Databricks all have native data quality features now. Snowflake’s Dynamic Data Quality Metrics, BigQuery’s Data Quality dashboards, Databricks’ Lakehouse Monitoring. These are worth evaluating before purchasing a separate tool, especially if you’re all-in on one platform.
My practical recommendation: start with dbt tests for your most critical models, layer in Great Expectations for high-value tables with complex requirements, and evaluate Monte Carlo or Soda once you’re at scale and the manual approach is breaking down.
Building the Foundation: The Five Checks You Need First
If you’re starting from zero, don’t try to instrument everything at once. Start with the checks that catch the highest-impact failures:
Row count over time. For every critical table, track the row count after each pipeline run and compare it to the rolling average for that time period. A 30% or greater deviation from expected should alert immediately. This single check would have caught roughly half the data quality incidents I’ve investigated.
Null rate on critical columns. Identify the 10-20 columns that downstream models and dashboards depend on most. Track their null percentage after each load. Set alerts when null rate increases by more than a defined threshold (10% is a reasonable starting point, tune from there based on what’s normal for your data).
Freshness timestamps. For every table that’s supposed to be updated on a schedule, monitor the max timestamp of the most recent record and alert if it falls behind by more than one update interval. This catches stuck pipelines that appear to succeed in your orchestrator but haven’t actually loaded new data.
Schema change detection. Before each pipeline run, compare the current schema to the last known-good schema. Alert on column additions, deletions, type changes, or nullability changes. Column additions are usually fine; deletions and type changes are dangerous.
Referential integrity. If you have fact-dimension relationships, check that your fact table foreign keys actually exist in the dimension tables. This catches upstream data that references entities that haven’t been loaded yet, or entities that were deleted from the source.
These five checks won’t catch everything. But they’ll catch the majority of the incidents that actually matter to the business.
Freshness Monitoring Done Right
Freshness monitoring deserves more depth because it’s both the most important check and the most commonly implemented wrong.
The naive implementation: set a maximum age threshold (say, 2 hours) and alert if the data is older than that. This works until you have daily-loaded tables (which are always stale by this definition), tables that are only loaded on business days, or tables that are loaded in partitions where some partitions are intentionally historical.
The better implementation is to understand the expected update cadence for each table and define freshness relative to that cadence. A table that’s supposed to update every 15 minutes should alert if it hasn’t updated in 30 minutes. A daily batch table should alert if it hasn’t updated in 25 hours. A weekly table should alert if it hasn’t updated in 8 days.
This seems obvious but the implementation requires you to actually document and encode the expected update schedule for each table. That documentation exercise alone usually surfaces a dozen tables where nobody is quite sure how often they’re supposed to update, which is itself a signal that those tables need ownership.
For data lake architectures built on S3 or GCS, freshness monitoring often means watching for file arrival events (via S3 event notifications or equivalent) rather than querying a table timestamp. Build this into your orchestration layer.
Connecting Data Quality to Downstream Impact
The hardest part of data observability isn’t detecting problems. It’s understanding what to do when you detect one.
When Monte Carlo fires an alert saying that table X has anomalous volume, the natural next questions are: which dashboards are using table X? Which ML models are using table X? Which downstream tables are built from X? Who owns table X and who are the stakeholders affected?
Without lineage, these questions take hours to answer manually. With lineage, you can answer them in seconds and immediately notify the right people.
Building lineage in practice means capturing metadata at the transformation layer. dbt does this automatically for SQL models. For Python pipelines, you need to emit lineage events to a catalog (Apache Atlas, Amundsen, DataHub) or use a tool that captures lineage automatically from query logs (Monte Carlo, Atlan).
The payoff for lineage investment is in incident response. A P1 data quality incident where you can immediately identify the blast radius and notify affected stakeholders is a very different experience from one where you spend the first two hours figuring out what’s even affected.
Integrating Data Observability Into Your Pipeline
Data quality checks should be part of your pipeline execution, not a separate process that runs afterward. The two patterns I see work:
Pre-load validation: Before loading data into your target table, validate the source data against your expectations. If the data fails validation, fail the pipeline before loading anything. This requires idempotent pipelines (run them again when fixed and they do the right thing), but it prevents bad data from entering your warehouse at all.
Post-load validation: Run checks after loading and alert if they fail, but don’t block the load. This is safer operationally (a pipeline doesn’t stay broken while you investigate a data quality issue), but it means bad data enters the warehouse and downstream consumers might process it before you fix it.
The right answer depends on the criticality of the table and the tolerance for bad data downstream. For tables that feed financial reporting or ML models with direct business impact, pre-load validation is worth the operational overhead. For exploratory analytics tables, post-load validation with alerting is usually sufficient.
In either case, integrate the checks into your orchestration tool. If you’re running Airflow, the checks are tasks in the DAG. If you’re running Prefect or Dagster, they’re tasks in the flow. The goal is a single audit trail that shows pipeline execution and data quality results together.
Handling Alerts Without Alert Fatigue
The last thing you want is to build a data observability system that creates so many alerts that the team starts ignoring them. Alert fatigue in data engineering is real, and it kills the value of the entire system.
The solution is the same as in infrastructure monitoring: start with high-precision alerts rather than high-recall alerts. It’s better to catch 80% of real issues reliably than to catch 100% of issues while generating so much noise that engineers stop paying attention.
Practical guidance:
Alert on things you can act on immediately. “Row count dropped 50%” is actionable. “Row count dropped 3%” might not be.
Use tiered severity. P1 for freshness failures on production dashboards. P2 for volume anomalies on critical tables. P3 for distribution changes that might be normal business variation. Route these to different channels.
Suppress alerts during known maintenance windows. If you’re running a backfill job over the weekend, mute the volume alerts for affected tables.
Set acknowledgment requirements for critical alerts. An unacknowledged P1 data quality alert should escalate automatically.
Review your alert history quarterly. Alerts that have never resulted in a real issue should be tuned or removed.
Data observability is infrastructure for trust. When your business stakeholders trust the data, they use it. When they don’t, they either stop using it or they spend engineering time building their own shadow data products to verify what you’re telling them. The investment in observability pays back in the quality of decisions that get made with your data and the engineering time you don’t spend chasing down “why is this number wrong” tickets.
Build this infrastructure before you need it. You’ll find out you needed it on the day your recommendation engine starts performing 18% worse, and at that point you’ll wish you’d started earlier.
Get Cloud Architecture Insights
Practical deep dives on infrastructure, security, and scaling. No spam, no fluff.
By subscribing, you agree to receive emails. Unsubscribe anytime.