The worst database incident I ever worked through started at 11pm on a Friday and was not actually a database problem. The primary was healthy, replication was lagging but not broken, and all our dashboards showed green. What we had was a cascade: a slow query introduced by a deploy that afternoon was holding row-level locks, those locks were blocking writes, the write queue was growing, and within forty minutes every background job in the system had piled up waiting for a connection to a database that was technically alive but functionally useless.
We fixed it by killing the offending query. The fix took thirty seconds. The diagnosis took four hours because we had monitoring but no observability, we had runbooks but no automation, and we had a DBA on call who knew PostgreSQL deeply but had never thought about what database reliability meant at a system level.
That incident is what finally pushed our team to take Database Reliability Engineering seriously. Not as a job title, but as a practice.
What DBRE Actually Is
Database Reliability Engineering emerged from applying the principles of Site Reliability Engineering directly to the database layer. The concept was formalized by Charity Majors and Laine Campbell in their O’Reilly book of the same name, but the underlying idea is straightforward: databases are the most critical, most failure-prone, and historically least-automated components in most production systems. They deserve the same engineering rigor that SRE brought to everything else.
The difference between a DBRE and a traditional DBA is not about PostgreSQL knowledge. The DBA I worked with that Friday knew more about query planner internals than I will ever know. The difference is orientation. A traditional DBA optimizes for database health in isolation: schema design, index efficiency, backup schedules, query tuning. A DBRE starts with the system and works backward: what does the database need to deliver for the application to meet its SLOs, and what are all the ways it can fail to do that?
This shift matters because database failures are almost never simple. They are usually interactions: a schema change that invalidates a query plan, a connection pool configured without a statement timeout, a long-running transaction that holds a lock while auto-vacuum is trying to do maintenance, a replication lag spike that causes a read replica to serve stale data that breaks a critical business flow. Understanding these interactions requires thinking about the database as part of a system, not as a standalone component.
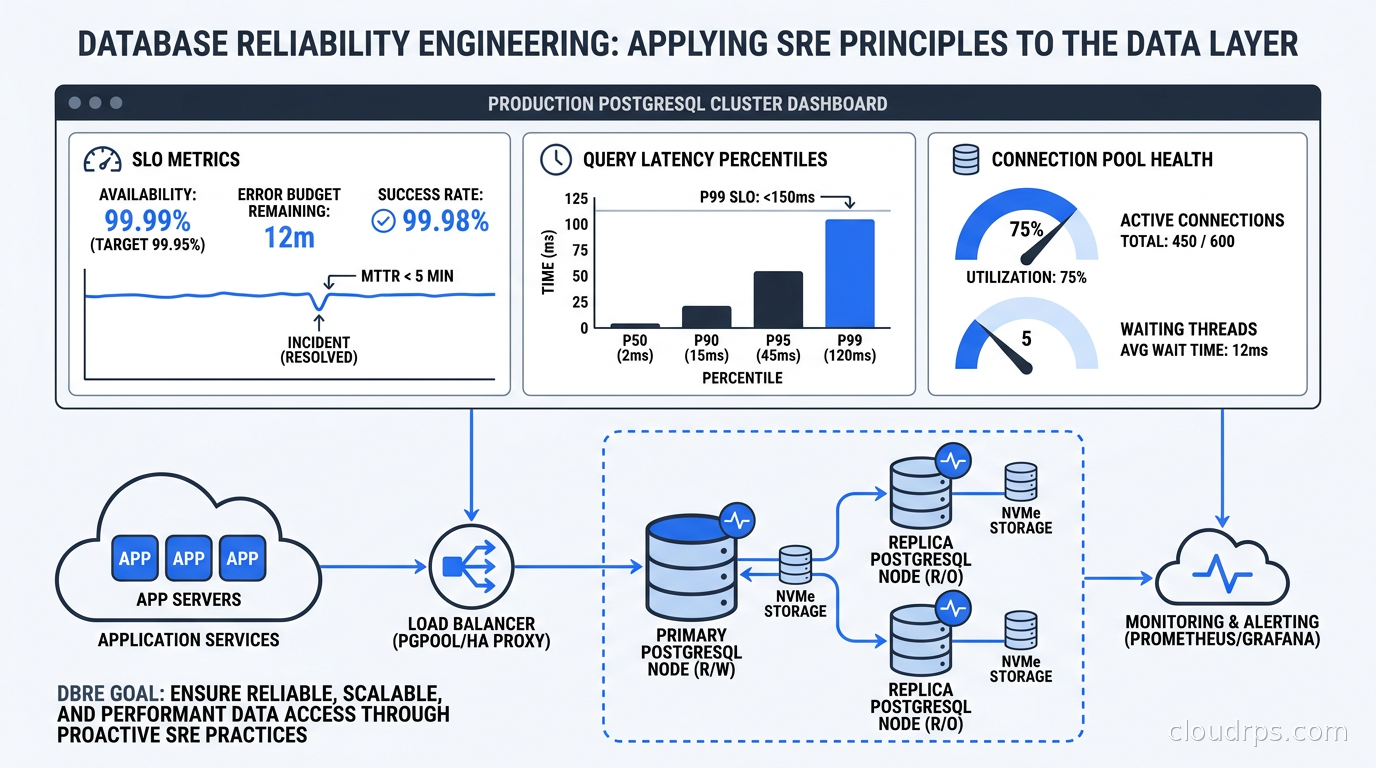
The DBRE practice has four pillars: observability, reliability engineering (SLOs and error budgets), chaos testing, and toil reduction through automation. All four are necessary. Most teams have fragments of one or two.
Defining Database SLIs and SLOs
The first question every DBRE engagement starts with is: what does a reliable database actually look like? This is harder than it sounds, because “the database is up” is not an SLO. I have been in incidents where the database was up and processing queries but the system was in a death spiral. The database being alive is a necessary condition, not a sufficient one.
Useful database SLIs fall into four categories.
Availability is the fraction of database requests that succeed. Not “is the primary up” but “are queries actually returning results within an acceptable time?” The distinction matters because a primary that is processing queries 50% slower than baseline due to a runaway vacuum job is technically available but is violating your application’s reliability contract.
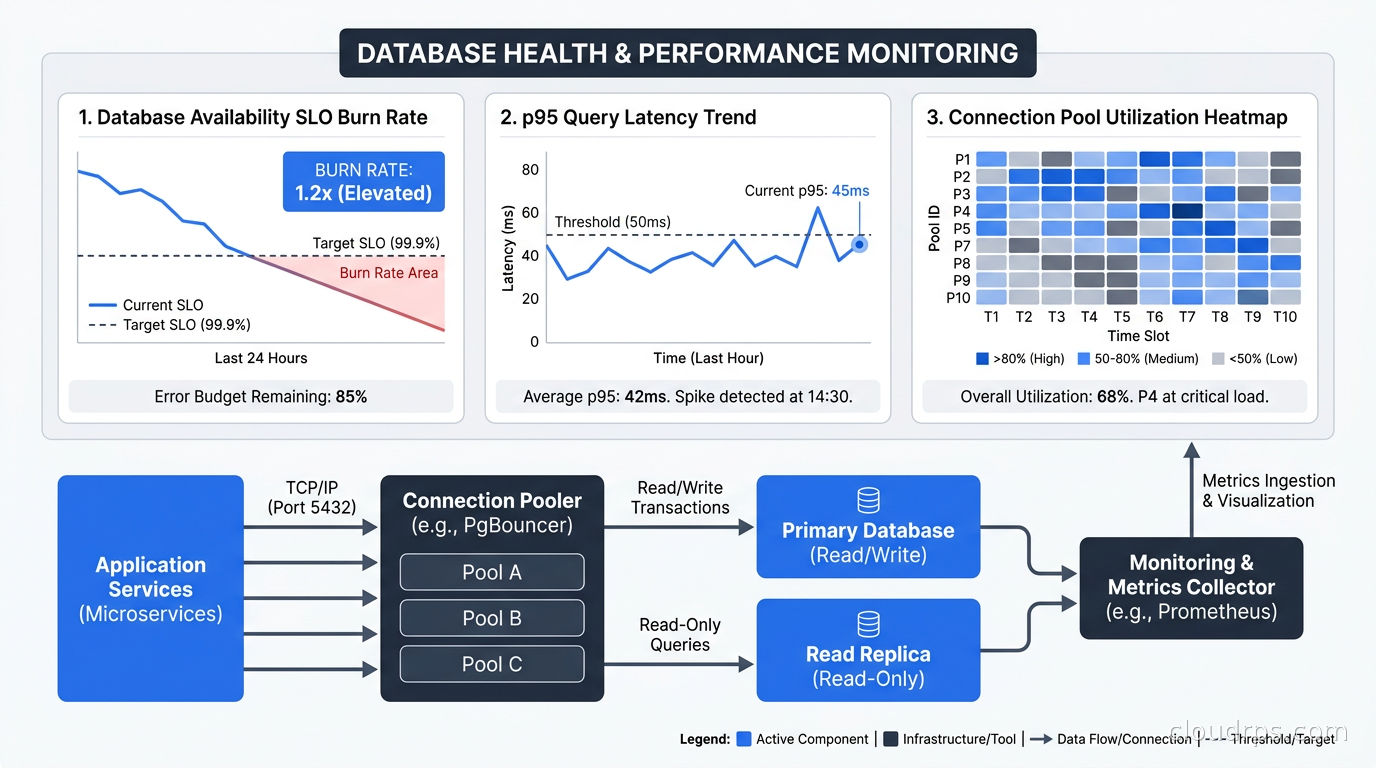
Latency is what most teams already track, but they track it wrong. Average query latency is useless for reliability. You need p95 and p99 latency for each query class. A database that serves 95% of queries in 2ms but takes 800ms on the 99th percentile is going to cause timeout failures in exactly the cases that matter most: high load, right when your users are most active.
Replication lag is the SLI that most teams ignore until it causes an incident. If your application reads from a replica, replication lag directly translates to data staleness. For an e-commerce platform I worked on, 30 seconds of replication lag meant customers could see an “in stock” status for an item that had already sold out. We defined our replica lag SLI as: the 95th percentile of replication lag, measured over 5-minute windows, should stay below 5 seconds during normal operation.
Connection health is the most frequently overlooked. Your application’s connection pool has a fixed number of connections to the database, and once it is exhausted, requests queue or fail. The SLI here is connection pool utilization: how close to your pool limit are you, and how often does request queuing start? I set alerts at 70% pool utilization, which sounds conservative but gives enough runway to diagnose the cause before the pool saturates. See the deeper dive on connection pooling architectures for how to configure this correctly.
Once you have SLIs you can define SLOs. I typically work toward a 99.9% availability SLO for transactional databases, which allows roughly 44 minutes of downtime per month. For latency: p95 query time under 50ms for OLTP workloads, measured across all application-tier-initiated queries. For replication lag: p95 under 5 seconds with a hard threshold of 60 seconds triggering a PagerDuty alert. These are starting points, not prescriptions. Your actual numbers depend on your application’s requirements.
Error budgets follow directly from the SLOs. If you have a 99.9% availability SLO and your actual availability last month was 99.97%, you burned 0.03% of your error budget and have 0.07% remaining for the month. The error budget is what makes conversations about risk concrete: “should we do this schema migration during peak traffic?” becomes “we have 40 minutes of downtime budget remaining and this migration has a 10% chance of causing 5 minutes of elevated error rates.” Read the SLO and error budget primer if the framework is new to you.
Building Real Database Observability
Most teams think they have database observability because they have Datadog or Grafana showing CPU, memory, and replication lag. What they actually have is monitoring. Monitoring tells you something is wrong. Observability lets you understand what happened and why, with the data you already have, without needing to reproduce the failure.
For PostgreSQL, the starting point is pg_stat_statements. Enable it, leave it running, and query it regularly. It gives you aggregate statistics for every distinct query the database has executed: total calls, total time, mean time, stddev time, rows returned. When an incident happens, your first question should be “what query changed?” and pg_stat_statements can answer that by comparing current statistics to a snapshot from before the incident.
SELECT
  substring(query, 1, 80) AS short_query,
  round(total_exec_time::numeric, 2) AS total_ms,
  calls,
  round(mean_exec_time::numeric, 2) AS mean_ms,
  round(stddev_exec_time::numeric, 2) AS stddev_ms,
  rows
FROM pg_stat_statements
ORDER BY total_exec_time DESC
LIMIT 20;
Pair this with pgBadger for log-based analysis. pgBadger parses PostgreSQL’s slow query log (set log_min_duration_statement = 100 to capture anything over 100ms) and produces detailed HTML reports showing query frequency, duration distributions, and which queries are responsible for the most total database time. This is the tool I reach for first after a production incident: run pgBadger against the logs from the incident window and let it tell you what was happening.
For real-time observation, pg_activity is the PostgreSQL equivalent of top. It shows you active queries, their duration, wait events, and lock states. In the middle of an incident, watching pg_activity update every second tells you which queries are piling up and what they are waiting on. The lock contention view is particularly valuable: if you see multiple queries in Lock wait state, you have a blocking chain you need to trace.
Wait events deserve special attention. PostgreSQL exposes the wait event type and name for every backend process via pg_stat_activity. When a query is not executing but is also not idle, it is waiting for something. Common wait events in production incidents:
Lock/relationorLock/tuple: classic blocking lock scenarioIO/DataFileRead: the database is hitting disk, not buffer cacheClient/ClientRead: the query finished but the client has not consumed the resultIPC/BgWorkerShutdownorLWLock/WALWrite: replication or WAL-related pressure
When I see an IO/DataFileRead storm, I immediately check pg_statio_user_tables to find which tables are generating the most disk I/O, then cross-reference against pg_stat_user_indexes to identify missing indexes. Every slow query is telling you something about your indexing strategy.
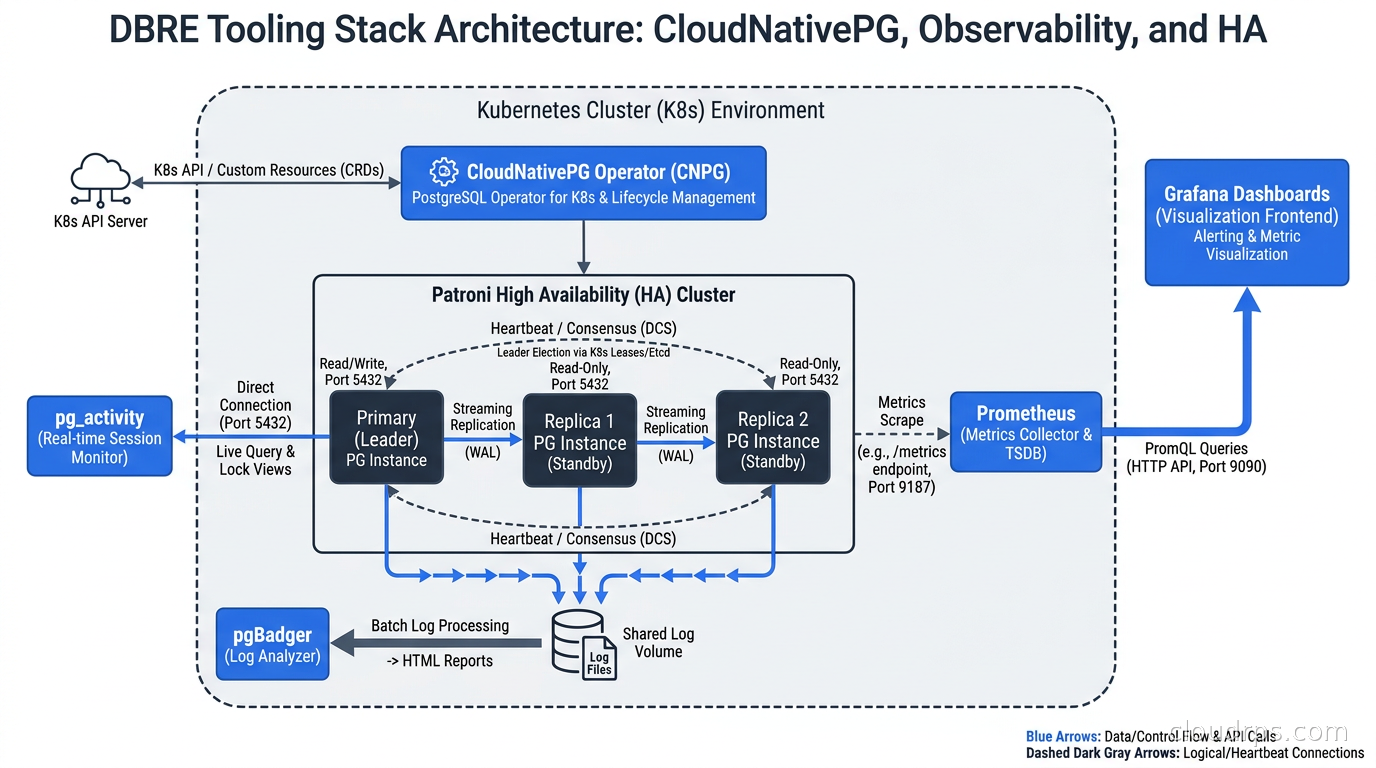
The observability stack I run for production databases: Prometheus with postgres_exporter for metrics, pgBadger for log analysis, pg_activity for real-time observation, and OpenTelemetry traces from the application layer with query spans so I can correlate slow database calls with the application code paths that triggered them.
Chaos Testing for Databases
Every team that runs databases in production should be doing regular failover drills. Almost none of them are. The usual excuse is that failover is too risky to test in production, which is exactly backwards: if you cannot safely test failover, you cannot safely fail over during an actual incident.
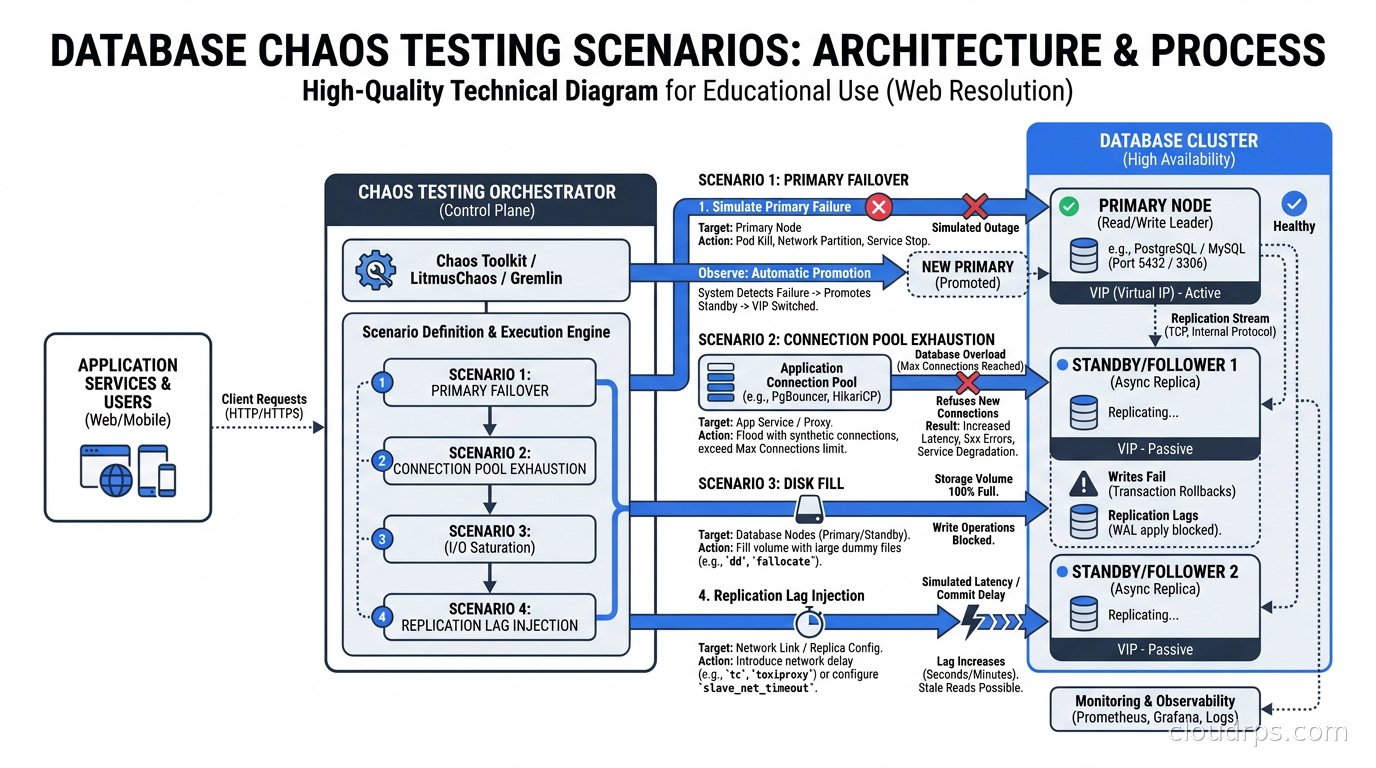
A production failover drill looks like this. You pick a maintenance window (or better, you do it without a maintenance window to test your actual response capability). You trigger a primary failover using your HA manager. For Patroni-managed PostgreSQL clusters, this is patronictl switchover --master <current-primary>. Your HA manager promotes a replica, updates the cluster configuration, and your connection layer (PgBouncer or HAProxy) reroutes connections. The question you are answering is: how long does this actually take, and what breaks during the transition?
The first time most teams run this drill, they discover one of three problems. First, the connection pool does not handle the primary change gracefully and starts returning errors until pool connections are recycled. Second, an application somewhere has a hardcoded connection string pointing to the old primary’s IP address. Third, the failover works but some in-flight transactions are lost and the application does not handle transaction failures correctly.
Beyond failover testing, I run three other classes of database chaos experiments:
Connection pool exhaustion: I deliberately eat all available connection pool slots to see what happens to the application. This is usually a one-liner that opens N connections and holds them. The goal is to verify that the application returns correct error responses (not timeouts), that your connection pool exhaustion alert fires within 60 seconds, and that automated remediation (if you have it) kicks in.
Disk fill testing: I fill the database disk to 85% capacity and verify that your disk usage alerts fire and that the database does not start corrupting data. PostgreSQL will stop accepting writes when disk is full but will continue to serve reads, which is the correct behavior and worth verifying.
Slow replica simulation: I introduce artificial replication lag using pg_sleep() in a long transaction on the primary, verify that replication lag alerts fire at your defined thresholds, and test whether your application correctly handles potential stale reads from the replica.
The broader chaos engineering practices apply here, but databases require domain-specific experiments because the failure modes are specific to how databases manage state.
Toil Reduction and Automation
In twenty years of working on production systems, I have seen the same database failure modes repeat across companies. The same alerts go off, the same runbook steps get followed, the same fixes get applied. The manual execution of these steps is toil, and toil is the thing DBRE exists to automate away.
The highest-value automations for database reliability:
Automatic connection recycling on primary change: When your HA manager promotes a new primary, application connection pools often need to be recycled to pick up the new endpoint. Write automation that hooks into your HA manager’s callback mechanism and triggers pool recycling across your application tier. With Patroni, this is done via the on_role_change callback. The manual version of this takes several minutes of toil during an already-stressful incident. The automated version takes seconds.
Slow query alerting with context: When a query exceeds your p99 threshold, the alert should include the query fingerprint, the table it operates on, the current index usage from EXPLAIN ANALYZE, and the number of times it has fired in the last hour. This turns a “something is slow” alert into an actionable incident brief. I have this wired to our incident management platform so the on-call engineer gets a Slack message with the query, the plan, and a direct link to the relevant pgBadger report.
Vacuum monitoring and intervention: Auto-vacuum falling behind is one of the most insidious PostgreSQL failure modes. Tables with high update or delete rates accumulate dead tuples, table bloat grows, queries slow down, and eventually you hit transaction ID wraparound which causes the database to go into a self-protective shutdown. Track n_dead_tup, last_autovacuum, and last_analyze from pg_stat_user_tables. If any table has more dead tuples than your threshold and auto-vacuum has not run recently, trigger a manual VACUUM ANALYZE via automation. The mechanics of MVCC, autovacuum cost throttling, per-table tuning, and XID wraparound prevention are covered in detail in our PostgreSQL VACUUM and autovacuum guide.
Schema migration gating: Never allow zero-downtime database migrations to run without pre-flight checks. I have a pre-migration hook that verifies: no long-running transactions (more than 5 seconds), connection pool utilization below 60%, replication lag below 1 second. If any of these fail, the migration is blocked until conditions improve. This single automation has prevented more incidents than any other operational change I have made.
The standard response to these automations is “but what if the automation makes things worse?” My response is always the same: write the automation carefully, test it, and run it in your chaos testing. The alternative is 3am manual execution of the same steps by an engineer who has been asleep for four hours and is working from a runbook that was last updated eight months ago.
Capacity Planning for Databases
Unlike application tiers, which can often scale horizontally with relative ease, databases have hard limits that require lead time to address. Running out of connections, IOPS, storage, or primary CPU cannot be solved instantly, and these failures cascade badly.
I track four capacity curves for every production database:
Storage growth rate: Plot database size over time and project when you will hit 80% disk utilization. For most OLTP databases, growth is relatively linear and predictable. The exceptions are audit tables and event logs, which tend to grow faster than the rest. Set an alert at 70% and a hard limit at 85% (above 85%, PostgreSQL can have trouble with WAL archiving depending on your setup).
Connection growth: As your application scales out, connection pressure grows. Track the ratio of active connections to max connections over time. If this ratio is climbing, you need to add PgBouncer nodes, tune pool sizes, or plan for a database upgrade that supports more connections.
IOPS headroom: For cloud databases (RDS, Cloud SQL, Aurora), IOPS is often a purchased parameter, not an automatic scale factor. Track your peak IOPS utilization over rolling 30-day windows. When peak regularly hits 70% of provisioned IOPS, it is time to provision more or rearchitect the write patterns.
Query throughput: Track queries per second on the primary. This is your fundamental capacity indicator. If QPS is growing 20% month over month, you need to be planning for a primary upgrade or a read-replica scaling strategy before that growth hits your latency SLOs.
The output of capacity planning is a single document per database that answers: what is the earliest date we will be forced to take an action, and what is that action? I review this monthly and use it to drive infrastructure roadmap conversations. It is dramatically more persuasive than “the database might be getting slow soon.”
The DBRE Toolkit in 2026
The tooling for DBRE has matured substantially. For PostgreSQL on Kubernetes, CloudNativePG has become my default choice. It handles the full lifecycle: provisioning, high availability, backup to object storage, point-in-time recovery, connection pooling via PgBouncer integration, and rolling upgrades. If you are thinking about running databases on Kubernetes, CloudNativePG removes most of the operational friction that made that decision historically painful.
For monitoring and observability: prometheus-postgres-exporter for metrics collection, pgBadger for log analysis, pg_activity for real-time introspection, and Grafana with the PostgreSQL Overview dashboard as a starting point. Percona Monitoring and Management (PMM) is worth evaluating if you want an all-in-one database observability platform; it covers PostgreSQL, MySQL, and MongoDB under one roof and includes built-in query analytics.
For chaos testing: I write custom scripts for database-specific experiments rather than using generic chaos engineering platforms. The experiments are simple enough (trigger a Patroni switchover, open N connections, run a long transaction) that custom scripts are more maintainable and more precisely controllable than a framework that was not designed with database failure modes in mind.
For schema change management, schema-as-code tools have become standard practice. Atlas in particular handles online migrations well and integrates with CI/CD pipelines in a way that makes pre-migration checks natural rather than bolted on.
What DBRE Actually Changes
The teams I have seen implement DBRE practices well share a common outcome: database incidents go from a whole team stuck on a lengthy bridge call to one engineer fixing it quickly and moving on. Not because the failures stop happening, but because the observability makes diagnosis fast, the automation handles the obvious cases before they become incidents, and the chaos testing means failover is a practiced drill rather than a novel emergency.
The other thing DBRE changes is the relationship between database operations and development. When developers can see database SLOs, they understand why slow queries get escalated as reliability issues rather than just performance concerns. When chaos testing is regular, the team stops treating database failover as a catastrophe and starts treating it as a routine operation with a known playbook. When schema migrations have automated pre-flight checks, engineers stop dreading schema changes and start treating database evolution as a normal part of feature development.
None of this requires a dedicated DBRE headcount. At most companies the size where DBRE becomes valuable, it is a practice adopted by the platform or infrastructure team, not a separate function. The investment is mainly in instrumentation (which pays back immediately in better incident response), automation (which pays back in reduced toil within weeks), and chaos testing (which pays back the first time you have a real incident and your team is not surprised by what failed).
Start with observability. Add pg_stat_statements and a slow query log today if you do not have them. Set up pgBadger to run nightly against your log files. Build the dashboards around the four SLIs I described. From there, the rest of the practice follows naturally because you will be able to see the problems you have been missing.
The database is almost always the deepest point of failure in a distributed system. It deserves to be the most engineered.
Updated September 1, 2026: removed unsourced statistics as part of an accuracy review.
Get Cloud Architecture Insights
Practical deep dives on infrastructure, security, and scaling. No spam, no fluff.
By subscribing, you agree to receive emails. Unsubscribe anytime.