
I spent three years as a staff engineer at a company where the VP of Engineering had a firm belief that deploying to production was risky, so we should do it as infrequently as possible. We deployed once a month. We had elaborate release ceremonies, multi-hour deployment windows, and a dedicated “release engineer” role that existed purely to coordinate the monthly deploy. Every deployment was high-stakes because it carried four weeks of changes. Every deployment had incidents. Every incident confirmed the belief that deploying was risky.
The State of DevOps Report research told a different story. The teams with the lowest deployment risk were the ones deploying most frequently. Frequent deployments mean small batch sizes, which means less that can go wrong. Small deployments are easier to roll back. The causal arrow points the opposite direction from where that VP assumed it did.
This is what DORA metrics reveal when you measure them honestly: the counterintuitive truth that speed and stability are not in tension. The elite performers on all four metrics are both faster and more reliable than low performers. Understanding why, and then building toward it, is one of the most valuable things an engineering organization can do.
What DORA Is and Why It Matters
DORA stands for DevOps Research and Assessment, a research program that ran out of Google (originally as an independent research firm) and produced the State of DevOps Report starting in 2014. Over eight years of surveys across thousands of organizations, they identified four metrics that together predict software delivery performance and organizational outcomes (revenue growth, market share, profitability, employee satisfaction).
The four metrics are:
- Deployment Frequency: How often you deploy to production
- Lead Time for Changes: Time from a code commit to that code running in production
- Mean Time to Restore (MTTR): How long it takes to recover from a production failure
- Change Failure Rate: Percentage of deployments that cause a degradation requiring remediation
These four metrics cover two distinct axes: throughput (deployment frequency and lead time) and stability (MTTR and change failure rate). Elite performers are in the top tier across all four, which is the key finding: there’s no tradeoff between going fast and being reliable. The teams doing both well have solved something architectural and cultural that the low performers haven’t.
The 2023 State of DevOps Report introduced a fifth metric, reliability, which measures whether services meet their reliability targets. This operationalizes the connection between delivery performance and SLOs and error budgets. I’ll focus on the original four since they’re what most teams measure and the most actionable.
The Four Metrics In Depth
Deployment Frequency
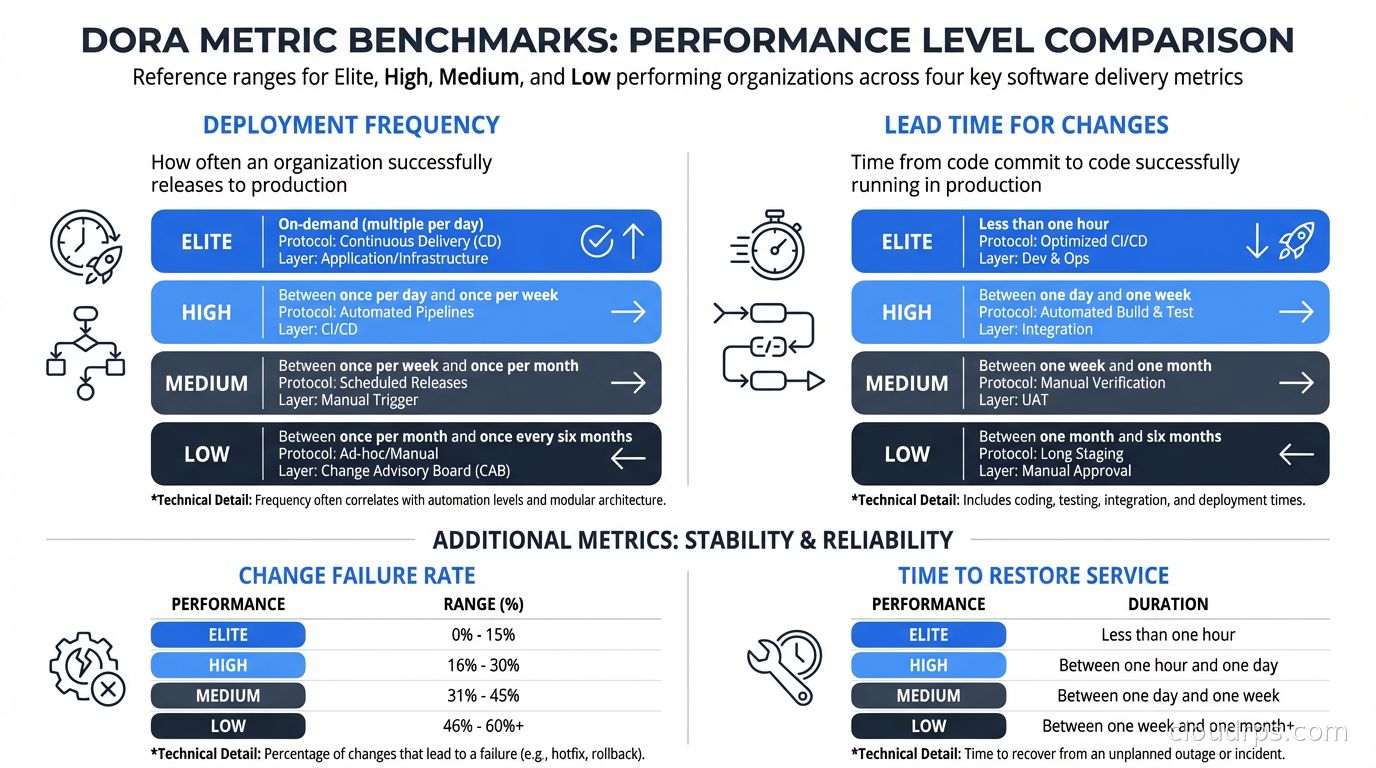
Deployment frequency measures how often you successfully release to production (or to end users for continuous delivery contexts).
Elite performers deploy on-demand, multiple times per day. High performers deploy between once per day and once per week. Medium performers deploy between once per week and once per month. Low performers deploy less than once per month, like that company I described above.
The measurement itself is simple: count production deployments in a time period. The hard part is defining “deployment” consistently. If you have 50 microservices and they each deploy independently, do you count each service’s deployment separately? Yes: the relevant unit is a service reaching production, not an organizational release event.
Deployment frequency is a leading indicator for batch size. Small, frequent deployments mean small batch sizes. Small batch sizes mean faster feedback, lower risk per deploy, and easier rollbacks. The teams deploying multiple times per day have evolved their entire engineering practice around making individual deployments small and safe. Everything else they do, feature flags, CI/CD automation, comprehensive testing, trunk-based development, flows from this commitment.
The thing that surprises most people when they start improving deployment frequency: you don’t become faster by optimizing your deployment pipeline first. You become faster by reducing the size of what you’re deploying. A 10-minute deployment pipeline matters much less than deploying code changes that are one day old instead of one month old.
Lead Time for Changes
Lead time for changes measures the time from a code commit to that commit running in production. Not “time from feature request to delivery” (that’s cycle time, a different metric), but specifically the pipeline time from code commit to production deploy.
Elite performers have lead times under one hour. High performers, under one day. Medium performers, between one day and one week. Low performers, between one week and one month.
To measure this accurately, you need to track commit timestamps and deployment timestamps and correlate them. Most CI/CD platforms log deployment events with the commits they contain. The calculation is: for each deployment, find the oldest commit in the deployment, calculate the difference between that commit’s timestamp and the deployment timestamp.
Lead time illuminates where your pipeline has bottlenecks. If your lead time is five days, but your CI pipeline finishes in 30 minutes, the bottleneck is between CI passing and production deploy. That’s likely a manual approval gate, a slow code review process, or a deployment process that only runs on a schedule. If your lead time is two days and CI takes 90 minutes, you might have both a slow pipeline and a process bottleneck.
The connection to feature flags is important here. Feature flags decouple deployment from release. You can deploy code with a feature flag disabled (low lead time), then release the feature to users by flipping the flag (instant). This gets your lead time metric down without forcing every feature to be fully ready before deployment.

Mean Time to Restore (MTTR)
MTTR measures how long it takes to recover from a production incident. Specifically: from the time a failure starts (not when it’s detected, which is a different and worse metric to optimize for detection time separately) to when the service is restored.
Elite performers have MTTR under one hour. High performers, under one day. Medium performers, between one day and one week. Low performers, more than one week.
A few things to be careful about when measuring MTTR. First, “restored” should mean fully restored, not “we deployed a fix that mostly works.” Partial recovery doesn’t count. Second, you should track MTTR by severity level. An MTTR of four hours might be acceptable for a minor incident and unacceptable for a P0. Aggregate MTTR across all severities can mask a problem with critical incident response.
To improve MTTR, the research consistently points to the same interventions: deployment automation (manual rollback is slower than automated rollback), good monitoring and alerting (faster detection means faster response even though detection time isn’t in MTTR), runbooks and playbooks (incident responders shouldn’t be figuring out recovery procedures during an incident), and practice through chaos engineering.
The cultural dimension of MTTR is significant. Teams with blameless postmortem cultures tend to have better MTTR because engineers engage more quickly with incidents when they’re not afraid of being blamed for them. Teams with blame-heavy cultures see incident responders being cautious and slow to make changes during incidents because they’re worried about making things worse and getting blamed. Psychological safety directly affects incident response speed.
Feature flags improve MTTR dramatically. If a bad deployment is causing an incident, disabling the feature flag often recovers the service in seconds. This is faster than any rollback process. Teams that instrument their deployments with feature flags have a recovery option that bypasses the entire deployment pipeline.
Change Failure Rate
Change failure rate measures the percentage of deployments that cause a production failure requiring remediation (rollback, hotfix, or incident response).
Elite performers have change failure rates of 0-15%. High performers, 16-30%. Medium and low performers, above 30%, sometimes significantly above.
Measurement requires linking deployments to incidents. When you have a P1 or P2 incident, was it caused by a recent deployment? If yes, that deployment counts as a failure. Some organizations track this automatically using their incident management tooling: the incident system prompts responders “was there a recent deployment?” and marks the associated deployment as a contributing factor.
The most important thing about change failure rate: it is not the same as bug rate. Some code changes that introduce bugs don’t cause production incidents (bugs caught by monitoring before users notice, bugs in low-traffic paths, bugs that appear only under edge conditions). Those don’t count. Only changes that require incident response count. This keeps the metric focused on what matters: production stability.
Change failure rate improves through better pre-production validation. This means comprehensive automated testing, better staging environments that match production, canary deployments (deploy to 1% of traffic before full rollout), and progressive delivery. The connection to deployment frequency is real here: when your batch size is small, you have fewer changes to validate and it’s easier to write comprehensive tests.
Don’t try to improve change failure rate by deploying less frequently. That’s the failure mode I described at the beginning of this article. Infrequent deployments with large batches have higher failure rates than frequent deployments with small batches. The research is unambiguous on this.
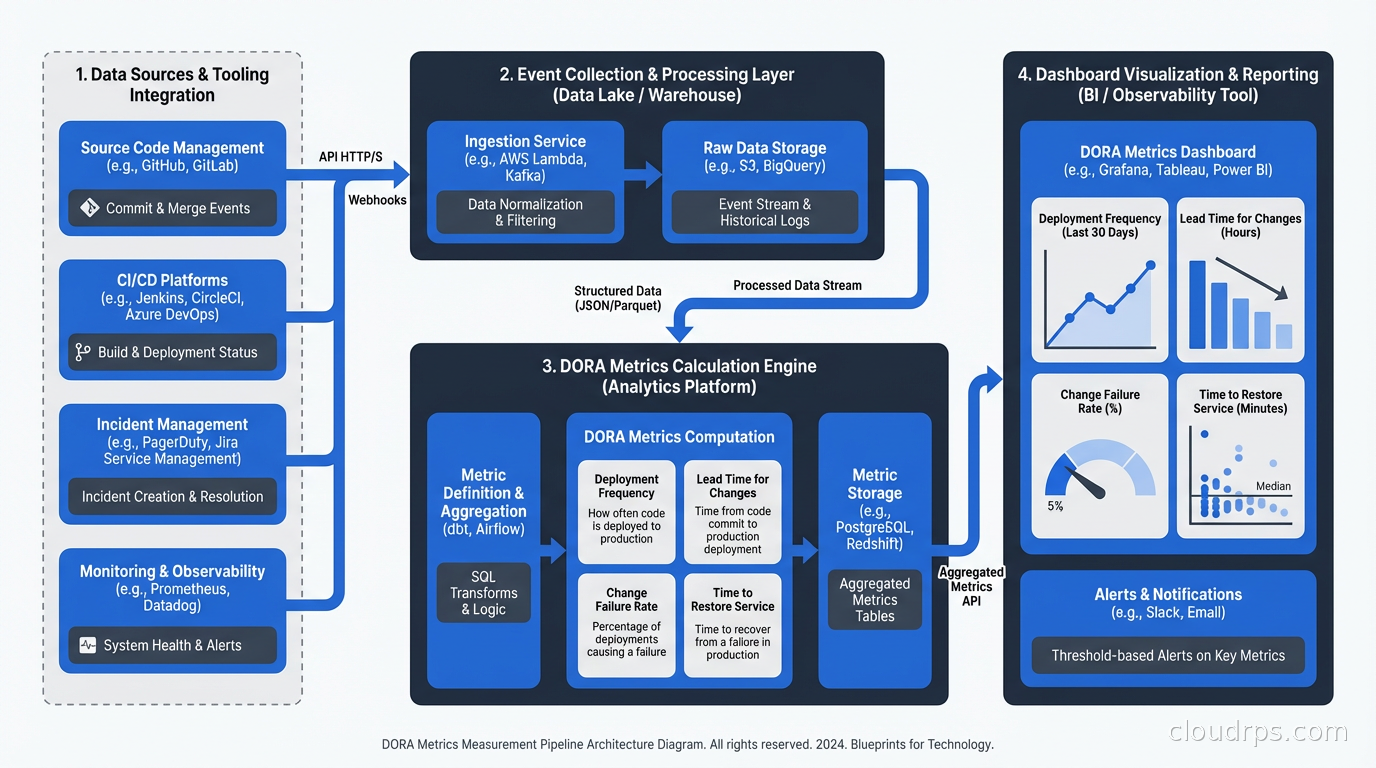
Measuring in Practice
The tooling landscape for DORA metrics has matured significantly. Four Keys is the open-source reference implementation from Google that collects deployment events, incident events, and change events from GitHub/GitLab and calculates DORA metrics from them. Linear, PagerDuty, and most major incident management platforms have built-in DORA dashboards. Sleuth, Jellyfish, and Faros are commercial platforms focused specifically on DORA metrics and engineering analytics.
For teams just starting, the simplest viable measurement approach:
- Deployment frequency: Query your CI/CD platform’s deployment API. GitHub Actions, GitLab CI, and most platforms expose deployment history via API.
- Lead time: Calculate from commit timestamp to deployment timestamp. Your CI/CD system has both data points.
- MTTR: Export incident start time and resolution time from your incident management tool. Aggregate by severity. Note that Opsgenie is being sunset in April 2027, so teams still on it need to migrate. For a comparison of PagerDuty, incident.io, and Grafana OnCall as MTTR data sources, see the incident management platform comparison.
- Change failure rate: Require incident responders to mark whether a recent deployment was a contributing factor. Calculate failures / total deployments.
The accuracy of your metrics depends on the accuracy of your data collection. If deployments don’t generate events in a system you can query, you can’t measure deployment frequency. If incidents aren’t recorded in an incident management system, you can’t measure MTTR or change failure rate. The investment in instrumentation is the investment in measurement.
Common Ways Teams Game the Metrics
Once metrics are visible and tied to performance reviews, some teams find creative ways to look better without actually improving. Knowing these patterns helps you design measurement that’s harder to game.
Splitting deployments artificially: If you’re measured on deployment frequency, you can increase the count by splitting one logical deployment into multiple smaller events, even if those events are tightly coordinated and effectively one deploy. Mitigation: measure deployment frequency alongside lead time. A team gaming frequency will often have flat or worsening lead time.
Closing incidents quickly without full resolution: MTTR improves if you close the incident ticket when the immediate symptom resolves, even if the root cause is still present and will re-trigger the incident. Mitigation: track repeat incidents (the same service having incidents within 72 hours) and weight them in your MTTR calculation.
Not counting some deployments as failures: If you’re measured on change failure rate, there’s temptation to classify an incident as “infrastructure” rather than “deployment-caused” even when a deployment was in the contributing factors. Mitigation: have incident classification done by a neutral party or by clear written criteria, not by the team whose metrics are being measured.
Cherry-picking the time window: Teams can look elite by reporting DORA metrics during quiet periods and excluding the weeks with major incidents or slow deployments. Mitigation: always measure over rolling 30-day or 90-day windows and track trends over time.
The best protection against gaming is a culture where metrics inform learning rather than judge performance. When engineers feel safe being honest about slow lead times and high failure rates because the organization treats those as signals for improvement rather than evidence of failure, they don’t need to game the metrics.
Moving from Low to Elite
The path from low to elite is reasonably well-documented by the DORA research. The technical capabilities most strongly associated with elite performance, in rough priority order:
Trunk-based development: Working in small, short-lived branches that merge to trunk (main) frequently. Feature branches that live for two weeks accumulate the large batches that cause high change failure rates.
Comprehensive automated testing: Unit, integration, and end-to-end tests that run in CI and block deployment on failure. The research is clear: teams with comprehensive test coverage deploy more frequently and have lower failure rates.
Deployment automation: Every production deployment should be a button press or an automatic trigger, never a manual sequence of steps. Manual deployments are slow and error-prone.
Monitoring and observability: You can’t have good MTTR if you don’t detect failures quickly. The monitoring and logging practices that support good incident detection directly support good MTTR. Coupling this with OpenTelemetry and distributed tracing gives you the observability to diagnose failures quickly once detected.
Feature flags and progressive delivery: Decoupling deployment from release, enabling fast rollback, and supporting canary deployments for risky changes. The feature flags and progressive delivery patterns directly improve both MTTR (fast rollback) and change failure rate (canary catches issues before full rollout).
The sequence matters. Most teams can’t implement trunk-based development overnight if they have weak automated test coverage; the fear of breaking main without tests is legitimate. Start with test coverage, then move toward shorter-lived branches, then toward higher deployment frequency. The platform engineering investment in deployment automation pays back immediately because it removes a bottleneck from every deployment cycle.
What DORA Doesn’t Measure
DORA metrics are a useful compass but they don’t capture everything that matters.
They don’t measure code quality or technical debt. A team can have elite DORA metrics while accumulating significant architectural debt. DORA measures deployment pipeline health and incident response; it doesn’t directly measure the quality of what you’re building.
They don’t measure developer experience or team health. Developer satisfaction survey scores (which are in the DORA research as a separate dimension) correlate with DORA performance but aren’t captured in the four metrics themselves.
They don’t measure user outcomes. Deploying frequently is meaningless if you’re deploying features users don’t want or that don’t move the metrics you care about. Product analytics, A/B testing results, and user satisfaction scores complement DORA metrics by measuring outcomes, not just process.
Treat DORA as the floor, not the ceiling. Elite DORA performance is necessary for a high-performing engineering organization but not sufficient. You can have great DORA metrics and still be building the wrong thing, accumulating technical debt, or burning out your engineers. Use DORA alongside qualitative signals: team retrospectives, developer satisfaction surveys, architecture reviews.
The teams that use DORA well treat the metrics as conversation starters, not scorecards. When lead time climbs, they ask why and what’s in the way. When change failure rate spikes, they look at the incidents and find the patterns. The metrics tell you where to look; they don’t tell you what you’ll find.
Get Cloud Architecture Insights
Practical deep dives on infrastructure, security, and scaling. No spam, no fluff.
By subscribing, you agree to receive emails. Unsubscribe anytime.