In 2016, when I first heard that Lyft had open-sourced a proxy written in C++, my instinct was to dismiss it. We had Nginx. We had HAProxy. Those were battle-tested, well-documented, and I could find engineers who understood them. Who needed another proxy?
I was wrong in a spectacular way. Eight years later, Envoy is the data plane underneath Istio, AWS App Mesh, Google Cloud Traffic Director, Contour, and the Kubernetes Gateway API. If you are running microservices at any reasonable scale, Envoy is almost certainly handling your traffic whether you know it or not. And if you do not understand how it actually works, you will spend a lot of time confused by cryptic configuration errors, mysterious circuit breaker trips, and filter chains that silently drop your requests.
This article covers the real architecture: how Envoy models network traffic, what xDS actually does, how filter chains compose into a processing pipeline, and the threading model that makes all of it performant. I will be direct about the rough edges too, because there are several.
The Problem Lyft Was Solving
Before diving into architecture, you need to understand why Envoy exists. In 2015, Lyft was operating hundreds of services. The classic problems of a microservices adoption were hitting hard: retry storms, cascading failures, no visibility into inter-service traffic, inconsistent timeout behavior because every team set different HTTP client defaults.
The standard answer at the time was: library-based solutions. Put your circuit breaker logic in a shared library, import it in every service, update it centrally. The problem is that this only works if every service is in the same language, and if every team actually upgrades the library. Lyft had Python, Java, and Go services. Library updates were adoption disasters.
Envoy’s insight was to move this logic out of the application layer and into the network layer. Put a proxy next to every service. Make it handle retries, circuit breaking, timeouts, observability. Now none of that logic lives in application code, and none of it is language-specific.
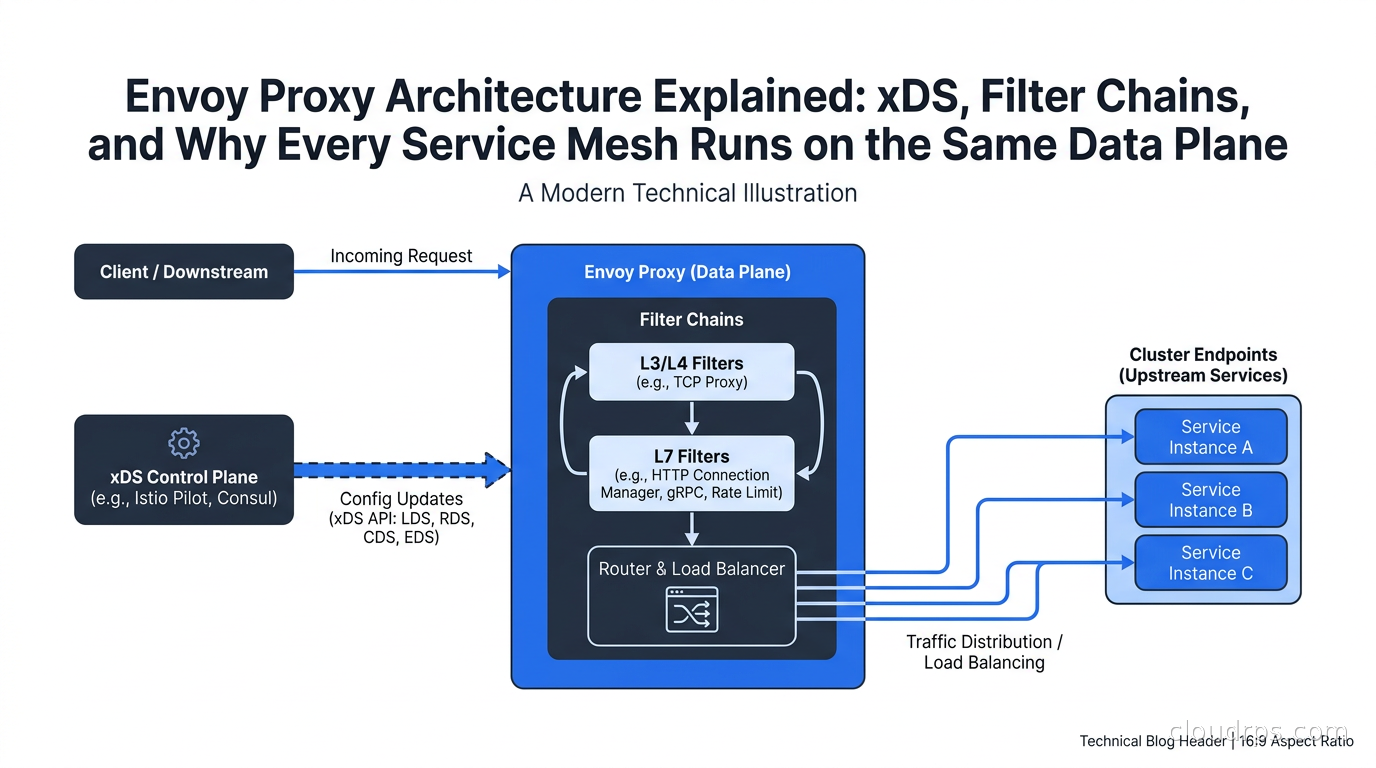
This is the sidecar pattern. Every service pod gets an Envoy container running alongside it. The application connects to localhost; Envoy intercepts outbound traffic and proxies it to the destination. Inbound traffic hits Envoy first and is forwarded to the application only after passing through the filter chain.
Listeners, Routes, Clusters, Endpoints
Envoy’s configuration model has four fundamental concepts. Understanding how they compose is the key to understanding everything else.
A listener is a port that Envoy binds to, waiting for connections. You configure listeners with an IP address, port, and a filter chain. When a connection arrives, Envoy matches it against the filter chain and begins processing.
A route maps request attributes (path, headers, method) to a cluster. Routes live inside the HTTP Connection Manager filter. This is where you define path-based routing, header matching, traffic weighting for canary deployments.
A cluster is a named upstream service. It has a load balancing policy, health check configuration, circuit breaker settings, and a list of endpoints. When Envoy needs to forward a request, it picks a cluster, applies the load balancing algorithm, and selects an endpoint.
An endpoint is a specific IP/port combination within a cluster. Endpoints can be configured statically or discovered dynamically via service discovery.
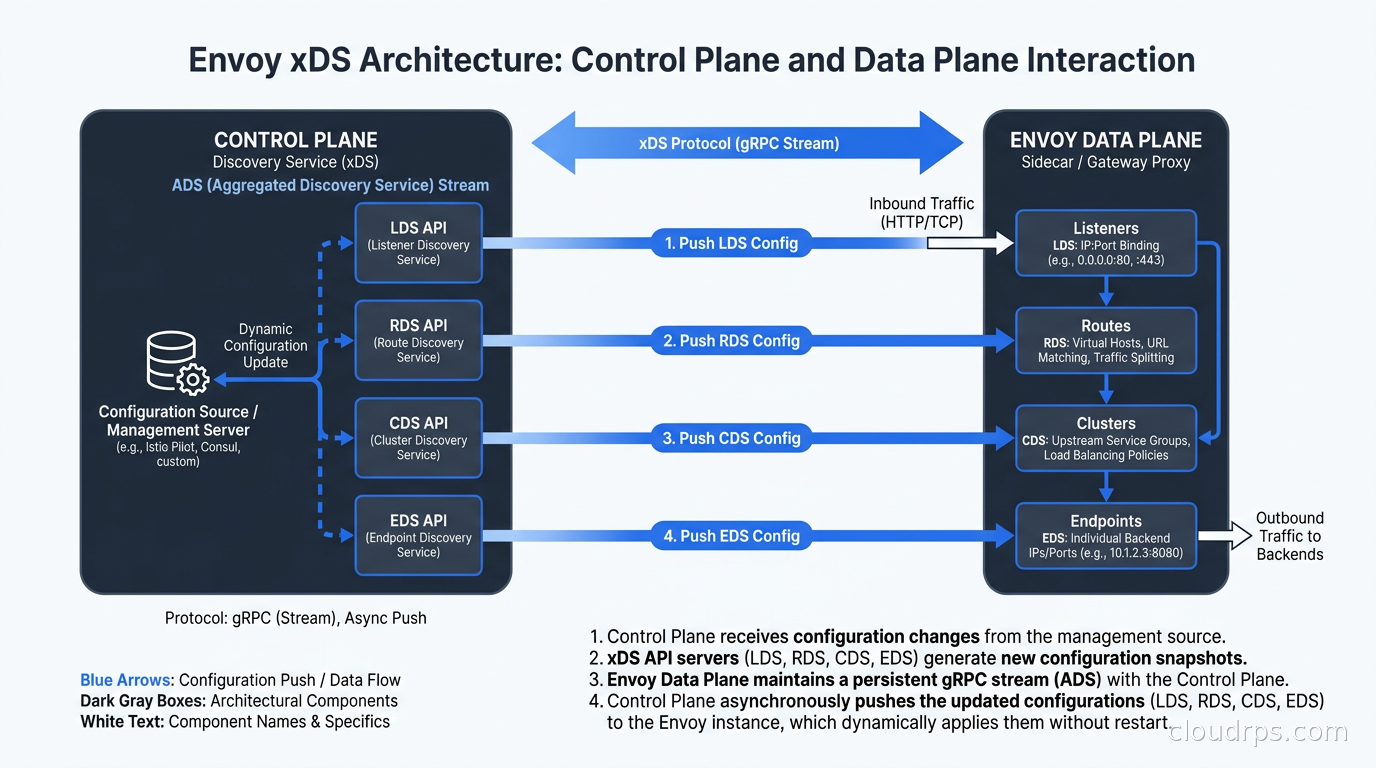
The acronym you will see everywhere is LDS, RDS, CDS, EDS: Listener Discovery Service, Route Discovery Service, Cluster Discovery Service, Endpoint Discovery Service. These are the xDS APIs that a control plane uses to push configuration to Envoy dynamically. The “x” in xDS is a wildcard: any of these can be referred to individually or collectively.
The xDS Protocol: How Control Planes Talk to Envoy
This is where most people get confused, so I am going to be precise.
Envoy can be configured two ways: static configuration in a YAML file, or dynamic configuration via xDS. In production, you almost always use xDS for at least some resources, because you cannot know endpoint IP addresses at build time, and you need to push route changes without restarting proxies.
The xDS protocol runs over gRPC. Envoy establishes a bidirectional streaming connection to a management server (the control plane) and subscribes to resource types. The management server pushes updates whenever resources change. Envoy acknowledges updates, and if it rejects a resource (because it is invalid), it NACKs the update with an error detail.
There are two delivery modes: SotW (State of the World) and Delta. SotW sends the full list of resources on every update, which is simple but does not scale well for large clusters with thousands of endpoints. Delta xDS sends only the changed resources, which is what you want at scale. Istio switched to Delta xDS several versions ago for exactly this reason.
There is also ADS: Aggregated Discovery Service. Instead of four separate gRPC streams, ADS multiplexes all resource types over a single stream. This matters because Envoy has ordering constraints: you should not reference a cluster in a route until the cluster exists, and you should not reference an endpoint in a cluster until the cluster exists. With ADS, the control plane can sequence updates correctly because everything flows through one stream.
The management server sends a DiscoveryResponse, Envoy processes it, and sends a DiscoveryRequest as an ACK or NACK. The version_info field increments with each successful update. If Envoy rejects an update, the version_info in the subsequent request stays at the last accepted version, and the error_detail field explains what went wrong.
I have spent more than one late night debugging xDS NACK loops where Envoy was rejecting updates and the control plane kept resending them. The error messages in Envoy’s error_detail field are often helpful, but sometimes they point to a secondary constraint violation that requires reading the Envoy source code to decode. If you are building a control plane, invest heavily in validation before you call xDS send.
Filter Chains: The Processing Pipeline
A filter chain is an ordered list of network filters that process each connection or stream. This is Envoy’s composability model: instead of a monolithic proxy with fixed behavior, Envoy is a framework where behavior is assembled from filters.
The most important network filter is the HTTP Connection Manager (HCM). It handles HTTP/1.1 and HTTP/2 framing, parses requests, and runs a secondary pipeline of HTTP filters. Most of your configuration lives inside the HCM.
Inside the HCM, HTTP filters execute in order for each request. Common HTTP filters include:
- Router: Makes the actual forwarding decision based on the route table. This is always last.
- rate_limit: Calls an external rate limit service (or local rate limiting) to enforce per-request limits.
- jwt_authn: Validates JSON Web Tokens before forwarding requests upstream.
- ext_authz: Calls an external authorization service for fine-grained access control. This is how Istio’s AuthorizationPolicy feature works under the hood.
- fault: Injects delays and errors for chaos testing.
- cors: Handles CORS preflight requests and adds response headers.
- lua: Runs Lua scripts inline, which I have used for quick header manipulation when a proper filter was overkill.
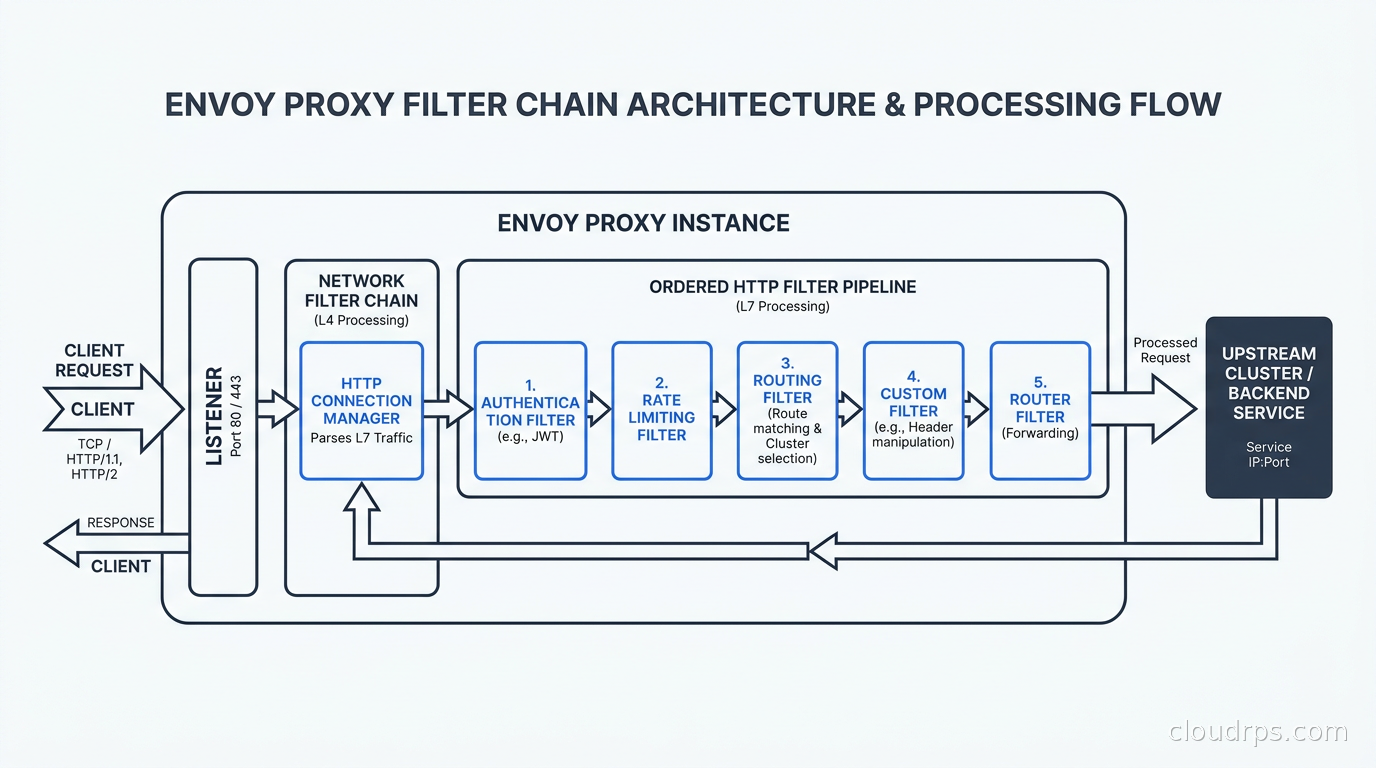
For non-HTTP traffic, TCP-level network filters handle the connection directly. The tcp_proxy filter simply forwards TCP bytes to an upstream cluster. There are also filters for MySQL protocol inspection, Redis proxying (with command routing and sharding), Kafka protocol support, and MongoDB metrics. Envoy speaks several application protocols natively.
Transport socket filters operate below the network filter layer, handling TLS termination and origination. This is how mTLS works in service mesh: the inbound listener terminates TLS from the calling service’s Envoy, and the outbound connection to the upstream service originates TLS with a client certificate. The application sees plaintext on both sides; Envoy handles the encryption.
The key thing to internalize is that filter chains are matched. A listener can have multiple filter chains, and Envoy selects the right one based on connection attributes: destination IP, destination port, source IP, server name (SNI from TLS ClientHello), application protocol (from ALPN). This is how Istio handles both plain HTTP and mTLS on the same port: different filter chains match different connection types.
Threading Model: Why Envoy Is Fast
Envoy’s threading model is worth understanding because it explains the performance characteristics and influences how you think about stateful filters.
Envoy is multi-threaded. There is a main thread and N worker threads, where N typically matches the CPU count. The main thread handles server lifecycle: reading xDS updates, updating configuration, accepting new connections, and distributing connections to worker threads. Worker threads handle the actual I/O using a non-blocking event loop (libevent under the hood).
Each connection is pinned to a single worker thread for its entire lifetime. This is important: there is no cross-thread locking for per-connection state. A filter running in a worker thread can store connection-level state without synchronization overhead. This is what makes Envoy’s filter model composable without sacrificing performance.
Configuration updates are a special case. When xDS pushes new configuration, the main thread creates a new routing table snapshot and distributes it to worker threads via a “drain” mechanism. Worker threads hold a reference to the current configuration snapshot and switch to the new one when convenient (at request boundaries). Old snapshots are deleted when all references are dropped. This is reference-counted lock-free configuration propagation, and it is why Envoy can take live configuration updates without dropping connections.
The global stats store is lock-free, using per-thread counters that are aggregated periodically. This is why Envoy can emit thousands of metrics per second without being bottlenecked by counter updates.
If you are running Envoy and wondering why CPU utilization is high, the first thing to check is the worker thread count and whether any HTTP filters are doing synchronous I/O (like calling an external service without using Envoy’s async filter API). Synchronous blocking in a filter will stall the worker thread and tank throughput.
Deployment Modes: Where Envoy Lives in Your Architecture
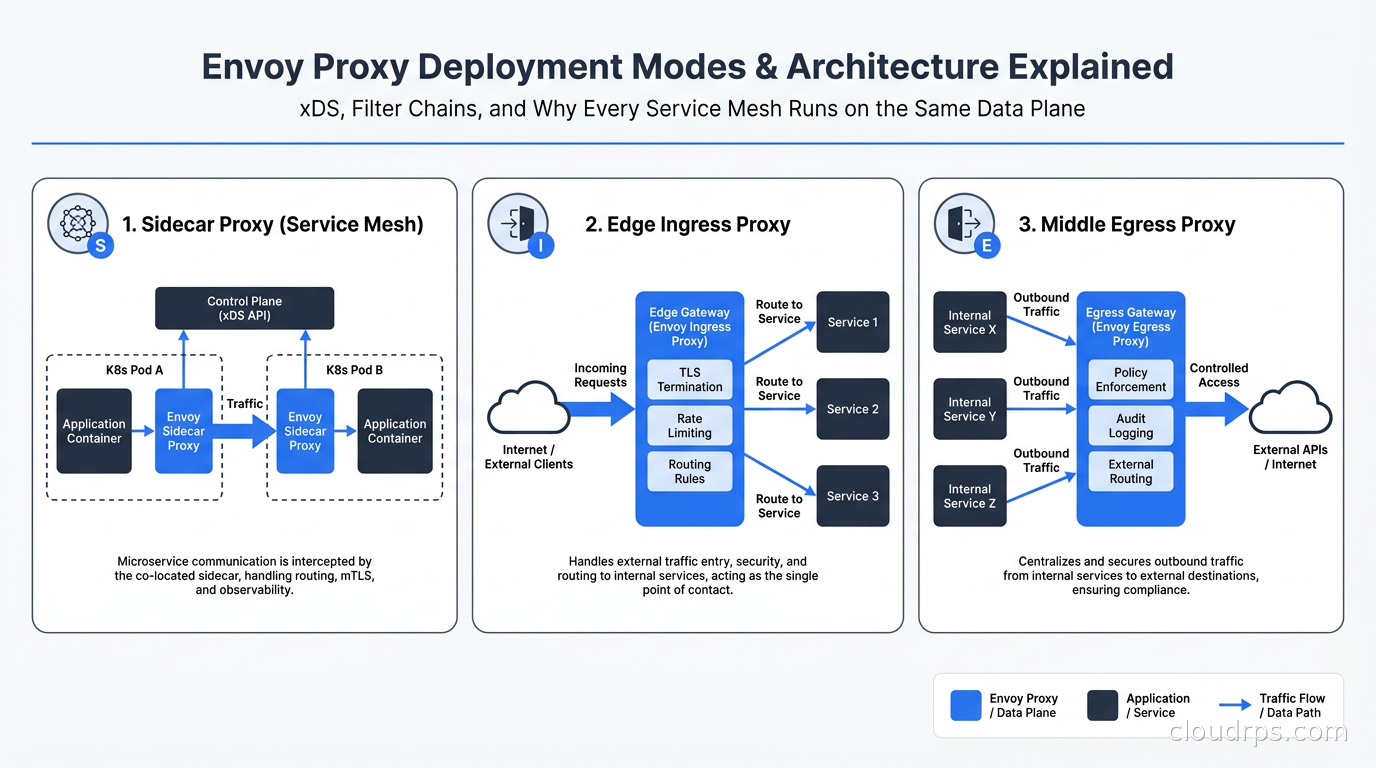
Envoy is not just a sidecar. Understanding the three deployment modes helps you see why it is so versatile.
Sidecar proxy: Each application pod gets an Envoy container. The application sends outbound traffic to localhost on a port Envoy binds to; Envoy proxies it to the destination. Inbound traffic is captured by iptables rules and redirected to Envoy’s inbound listener before reaching the application. This is the service mesh model, and it is what Istio uses in its original sidecar mode. The advantage is that the control plane can configure policies (retries, circuit breaking, mTLS, authorization) without application changes.
Edge proxy (ingress): A single Envoy instance (or a deployment of several) sits at the perimeter of your cluster, handling external traffic. This is what Contour does as an Kubernetes Ingress controller, and it is what the Kubernetes Gateway API uses when the implementation is Envoy-based (Envoy Gateway, Contour). You configure Envoy with listeners bound to public IPs, routes that map to internal services, and TLS termination for your hostnames.
Middle proxy (egress): Envoy sits between internal services and external dependencies. All outbound traffic from your cluster goes through a central Envoy deployment, which handles TLS origination, retries, circuit breaking, and logging for all egress. This is less common than sidecar or edge deployments but useful when you need centralized control over external service calls.
For the Kubernetes Gateway API, multiple implementations are Envoy-based. Envoy Gateway is the official Kubernetes project implementation, and Contour has been Envoy-backed since its inception. When you write an HTTPRoute resource, the control plane translating it into Envoy configuration is doing xDS configuration: creating listeners, route configurations, and clusters from your Kubernetes objects.
Circuit Breaking, Retries, and Timeouts
These are the features that actually motivated Envoy’s creation, and they are worth covering precisely because the defaults are not always what you expect.
Circuit breaking in Envoy is configured per cluster, not per request. You set limits on the maximum number of concurrent connections, pending requests, retries, and requests. When a limit is hit, Envoy returns a 503 immediately without forwarding the request. This is cluster-level protection, preventing a slow upstream from accumulating connection backlogs that cascade into your service.
The circuit breaker configuration has a concept of “priority.” Each cluster has a DEFAULT priority and a HIGH priority budget. HIGH priority traffic (you set this via a request header or route config) gets a separate pool. I have used this for health check traffic that should never be circuit-broken even when the default pool is exhausted.
Retries are configured on routes. You specify the number of retry attempts, the retry conditions (5xx, gateway-error, reset, connect-failure), the per-try timeout, and optionally a retry budget. The retry budget is important: it limits retries to a percentage of active requests, preventing retry amplification. If you have 100 active requests and your retry budget is 20%, Envoy will only permit 20 concurrent retries at any time. Without a retry budget, a flapping upstream can trigger a retry storm that overloads the service even more. For a deeper look at retry and rate limiting coordination at scale, the rate limiting architecture article covers the distributed rate limiting side of this equation.
Timeouts exist at multiple layers. There is a route-level timeout (total time for the request including all retries), a per-try timeout (maximum time for each individual attempt), and an idle timeout on connections. Getting these right requires understanding the interaction: if your route timeout is 5 seconds and your per-try timeout is 3 seconds, you can get at most one retry before the route timeout fires.
I spent several days debugging a latency issue at a previous job where our Envoy timeouts were misconfigured. The per-try timeout was longer than the route timeout, so retries were triggering but the route timeout was firing before the retry could complete. Every failed request was returning a 504, but the retry metrics showed retries happening. The fix was making the route timeout equal to (per-try timeout * max_attempts) + buffer. It sounds obvious written out, but when you are looking at a live production incident at 2 AM, it is not obvious at all.
Observability: Stats, Tracing, and Access Logs
This is one of Envoy’s strongest features. Out of the box, Envoy emits hundreds of metrics covering every aspect of its operation: request counts, error rates by response code, upstream connection pool state, circuit breaker state, filter-level metrics.
Stats follow a naming convention: envoy.<listener|cluster|http|tcp>.<name>.<metric>. For example, envoy.cluster.my_service.upstream_rq_5xx is the count of 5xx responses from the my_service cluster. Stats are exposed via an admin interface on port 9901 and can be scraped by Prometheus directly (Envoy has a native Prometheus metrics endpoint at /stats/prometheus). If you are running the Prometheus/Grafana observability stack, connecting it to Envoy is straightforward.
Distributed tracing is handled by trace filter integration. Envoy supports Zipkin, Jaeger, and OpenTelemetry-based tracing. When using OpenTelemetry (the preferred approach in 2026), Envoy propagates trace context headers (traceparent for W3C context, or the legacy B3 headers for Zipkin/Jaeger compatibility) and reports spans to the configured OTLP endpoint. This means every hop through Envoy shows up as a span in your trace, giving you complete visibility into inter-service latency without any application-level instrumentation for the transport layer. This integrates naturally with the OpenTelemetry distributed tracing setup you may already have.
Access logs are configurable using Envoy’s command operators syntax, which lets you log any request attribute, header, dynamic metadata, or filter state. You can emit JSON-formatted logs directly to stdout (for Kubernetes log aggregation), or use the gRPC access log service to stream logs to a centralized collector. The granularity is excellent: you can log upstream response time, downstream bytes sent, retry count, and which cluster and endpoint handled the request.
The Rough Edges
I promised honesty, so here it is.
Envoy’s configuration is verbose. A simple HTTP proxy that routes based on path to two upstream clusters requires hundreds of lines of YAML. This is manageable with a control plane that generates the config, but if you are trying to hand-write static Envoy config for a quick test, you will spend most of your time hunting for the right nesting level.
The documentation has improved significantly, but it is still dense. The proto definitions are authoritative, but reading proto definitions to understand configuration options is not friendly for operators who are not already familiar with the codebase. The envoy.yaml validation errors, when xDS pushes invalid config, can be cryptic in a way that Nginx’s nginx -t never is.
The upgrade path between major Envoy versions requires attention to deprecated fields. Envoy deprecates configuration options aggressively, and if you are consuming Envoy via Istio or another control plane, you are typically at the mercy of that project’s upgrade cadence. When Istio moves to a new Envoy major version, the xDS API shapes sometimes change and filter names get reorganized. This is getting better, but it has bitten me during Istio upgrades.
The admin interface (port 9901) is powerful and completely unauthenticated by default. In a service mesh deployment where Envoy is not exposed externally, this is acceptable. As an edge proxy with the admin port accidentally exposed, it is a serious security issue: the admin interface allows you to drain connections, change log levels, and reset circuit breakers. Lock it down.
Why Envoy Won
The service mesh ecosystem converged on Envoy for several reasons. First, the extensibility: the filter model is powerful enough that Istio’s entire policy and observability feature set is implemented as Envoy filters (ext_authz, JWT authn, Wasm filters, telemetry v2). Second, the xDS protocol: having a standard API for configuring a data plane means that different control planes (Istio, Consul Connect, AWS App Mesh) can all target the same proxy. Third, the observability: Envoy’s stat emission out of the box was far superior to what you got from Nginx or HAProxy, and for microservices debugging, visibility into the data plane is critical.
Linkerd, which we cover in the service mesh comparison, took a different path and built its own Rust-based proxy (the Linkerd2-proxy). This proxy has much lower resource overhead than Envoy but lacks Envoy’s extensibility. The tradeoff is real: in memory-constrained environments (edge nodes, small clusters), Linkerd’s proxy profile can be compelling. But for organizations running complex routing policies, Wasm plugins, or custom authorization, Envoy’s filter model wins.
The Istio ambient mesh architecture changes the deployment model but not the proxy. The waypoint proxy in ambient mode is still Envoy, now handling L7 traffic for an entire namespace rather than per-pod. The ztunnel, which handles L4 encryption, is a new Rust component. But the complex policy enforcement still runs in Envoy. This is telling: even as the architecture evolves away from per-pod sidecars, the Envoy filter model remains the right tool for complex L7 processing.
For gRPC services specifically, Envoy is the native proxy. It understands HTTP/2 framing, speaks the gRPC protocol, and can load balance at the individual RPC level rather than the connection level. Nginx and HAProxy can handle gRPC traffic over HTTP/2, but they do not understand gRPC trailer frames or provide RPC-level metrics. Envoy does all of this out of the box.
Getting Started Without the Pain
If you are running Kubernetes and want to explore Envoy without the complexity of a full service mesh, Envoy Gateway (the official CNCF project) is the easiest path. It implements the Kubernetes Gateway API, so your configuration is in HTTPRoute and Gateway objects that the Gateway API controller translates into Envoy configuration. You get Envoy’s power without hand-writing a single xDS resource.
For understanding the raw internals, the envoyproxy/envoy Docker image with a static envoy.yaml config is the right approach. Start with the simplest possible config: one listener, one route, one cluster pointing to a known upstream. Add complexity one piece at a time. The admin interface at port 9901 has a /config_dump endpoint that shows you the complete current configuration as Envoy understands it, which is invaluable for debugging.
The envoy.yaml bootstrap config looks intimidating until you understand that it follows exactly the same structure as xDS: node identity, static resources (optional), dynamic resources (pointing to your management server), and admin config. Everything else is just filling in the listener, route, and cluster objects you already understand.
Twenty years of working in infrastructure has taught me that the tools that win are not always the simplest ones. Envoy is not simple. But it is principled: the listener, filter chain, cluster, endpoint model is internally consistent, the xDS protocol solves a real configuration management problem, and the observability is genuinely excellent. Once you understand the architecture, the complexity is manageable. The engineers who shipped Lyft’s service mesh saw a real problem, made opinionated choices about how to solve it, and open-sourced something that has outlasted almost every alternative. That is not an accident.
If you are dealing with Kubernetes networking decisions or choosing between API gateway solutions, understanding Envoy’s capabilities will inform those choices regardless of what you pick. Most of the tools you are evaluating are running Envoy underneath. Might as well know what is actually happening.
Get Cloud Architecture Insights
Practical deep dives on infrastructure, security, and scaling. No spam, no fluff.
By subscribing, you agree to receive emails. Unsubscribe anytime.