
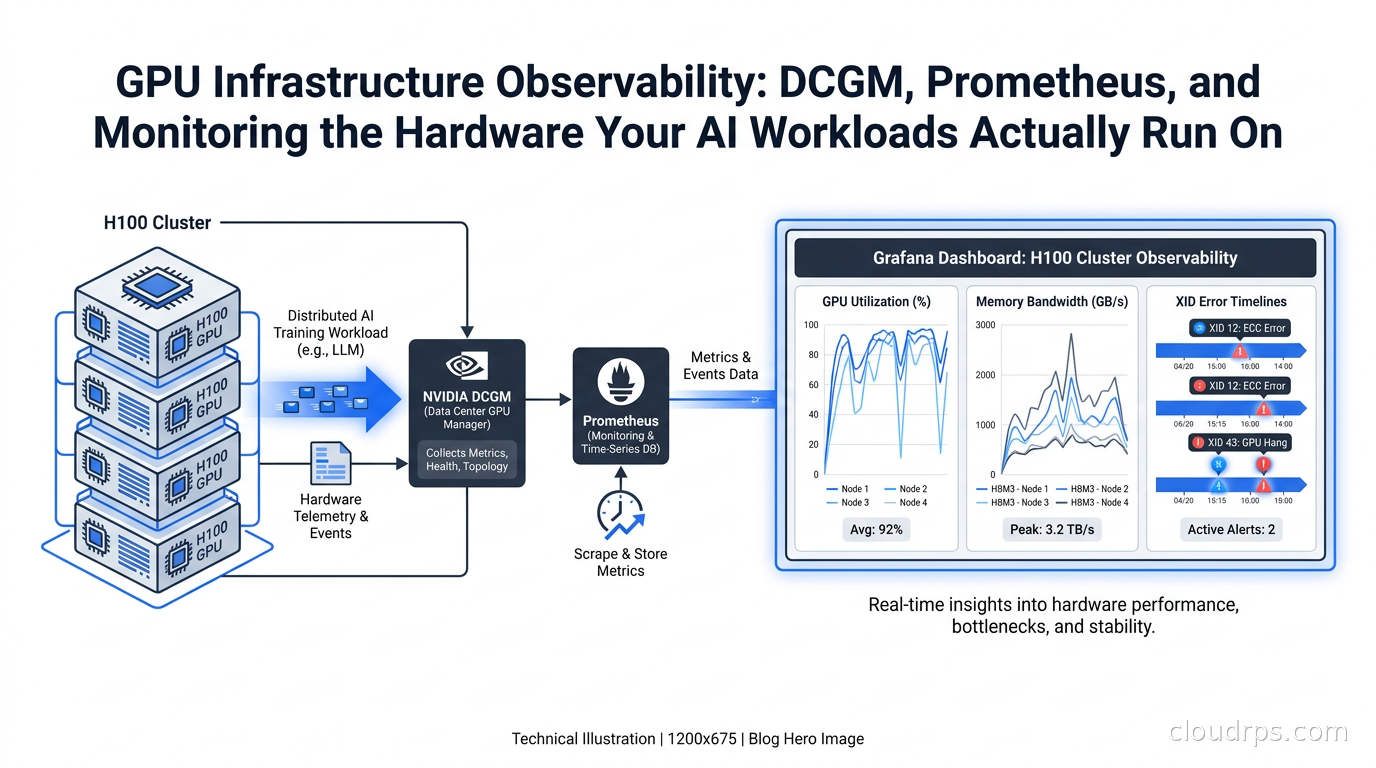
Twenty years in this industry and I can count on one hand the number of teams I’ve encountered that had genuinely good GPU observability before they needed it. They always discover the gap the same way: a multi-day training run stalls somewhere around epoch 40, the on-call engineer stares at a flat CPU dashboard, shrugs, and restarts the job. Hours later it stalls again. The GPUs have been trying to tell you something the entire time; you just weren’t listening.
CPU and memory metrics are not enough for GPU infrastructure. A GPU can sit at 99% “utilization” by the standard nvidia-smi definition while your actual compute kernels execute at a fraction of theoretical throughput. Memory bandwidth can be saturated while SM (streaming multiprocessor) cores idle. A single GPU in a 64-node cluster can be running 15 degrees hotter than its peers, throttling its clocks, and quietly lengthening every collective operation in your ring-allreduce. Standard monitoring shows you none of this. DCGM does.
This article covers the practical architecture for GPU infrastructure observability: what NVIDIA’s Data Center GPU Manager actually is, how to deploy the Prometheus exporter in Kubernetes, which metrics separate meaningful signal from noise, how to read XID events and ECC error counters, and how to build alerting that earns your team’s trust instead of crying wolf.
What DCGM Actually Is
Most engineers encounter DCGM through dcgm-exporter, the Prometheus sidecar. That framing undersells it. DCGM is a host daemon that maintains a persistent connection to every GPU on the node, sampling telemetry at sub-second granularity, running active health diagnostics, and tracking state that would be lost between individual nvidia-smi invocations. The exporter is just the metrics aggregation layer that sits in front of it.
The daemon matters because some GPU state is cumulative and order-dependent. XID error counts, ECC error accumulators, PCIe replay counters: these are only meaningful when you track them continuously from a known baseline. A tool that polls the GPU on demand every 15 seconds will miss a burst of XID events that resolved themselves between scrapes. DCGM catches them because it is always watching.
NVIDIA released DCGM 4.5.2 in February 2026, updating base containers to the latest Go runtime and adding support for monitoring GPU bind and unbind events, which is useful for bare-metal nodes that dynamically reassign GPUs between workloads. For most teams running static Kubernetes GPU nodes, the differences between recent major versions are minor. The deployment pattern has been stable for several years.
The GPU metrics ecosystem in 2026 also includes vendor integrations from Datadog, Dynatrace, and others that wrap DCGM internally. These are fine if you already pay for one of those platforms. This article focuses on the open-source path: DCGM Exporter, Prometheus, and Grafana.
Deploying DCGM Exporter in Kubernetes
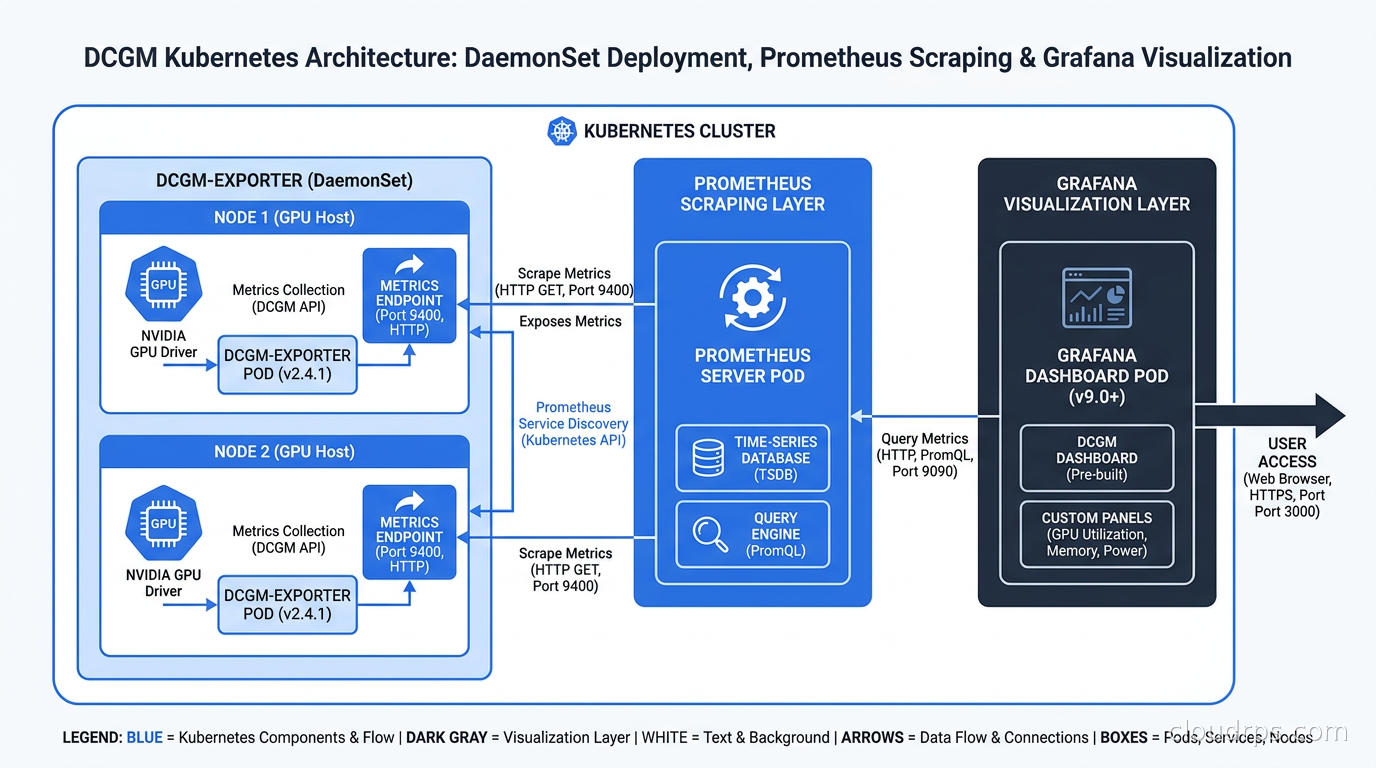
The canonical deployment is a DaemonSet: one exporter pod per GPU node, never one per GPU. The exporter talks to the DCGM daemon on the host through a Unix socket and exposes a /metrics endpoint that Prometheus scrapes. Running one pod per GPU instead wastes memory and duplicates host-level telemetry.
# Minimal ServiceMonitor for Prometheus Operator
apiVersion: monitoring.coreos.com/v1
kind: ServiceMonitor
metadata:
  name: dcgm-exporter
  namespace: gpu-monitoring
spec:
  selector:
    matchLabels:
      app: dcgm-exporter
  endpoints:
    - port: metrics
      path: /metrics
      interval: 15s
One configuration decision that trips teams up: the default scrape interval for GPU metrics should be shorter than your default Prometheus scrape interval for application metrics. GPU utilization can spike and collapse within seconds during inference workloads. If you let it alias against a 60-second scrape window, your utilization graphs will look deceptively smooth while actual workloads thrash. NVIDIA’s own guidance recommends a sub-30-second interval for production GPU nodes.
The exporter ships with a default set of metrics defined in a configurable CSV file. You can expand or restrict which DCGM fields get exported. The default set covers the basics; production clusters running distributed training benefit from also enabling NVLink bandwidth counters and PCIe replay counters, which are disabled by default because they add collection overhead.
For node selector and tolerations, ensure the DaemonSet only schedules on GPU nodes:
nodeSelector:
  accelerator: nvidia-gpu
tolerations:
  - key: nvidia.com/gpu
    operator: Exists
    effect: NoSchedule
DCGM Exporter as of 2026 sets a default memory limit of 512Mi per pod, increased from earlier versions. On nodes with many GPUs (8 or more H100s), you may need to bump this further depending on how many metrics fields you enable.
The Metrics That Actually Matter
GPU utilization as reported by DCGM_FI_DEV_GPU_UTIL measures the percentage of time at least one kernel was executing on the device. This is the metric that looks great in reports and lies to you constantly in production. A GPU executing a tiny kernel that finishes in 100 microseconds then idles for 900 microseconds shows 10% utilization by this definition even though it is completely saturated from the application’s perspective. The number means “is something running” not “is this GPU working efficiently.”
The metrics that actually diagnose problems:
SM Clock and Memory Clock (DCGM_FI_DEV_SM_CLOCK, DCGM_FI_DEV_MEM_CLOCK): GPU clock throttling happens silently. When a GPU exceeds thermal or power limits, it reduces its SM clock to stay within bounds. If your training throughput is lower than expected, check whether the SM clock is consistently below the GPU’s rated base clock. Thermal throttling on H100 SXM nodes in high-density racks is more common than vendors admit, particularly in the first 12-18 months after deploying a new cluster.
Memory Bandwidth Utilization (DCGM_FI_DEV_MEM_COPY_UTIL): This tells you whether you are memory-bandwidth-bound. Many LLM inference workloads are memory-bandwidth-bound rather than compute-bound, meaning you are limited by how fast you can move weights through the memory subsystem, not by how many FLOPs the tensor cores execute. If this metric is near 100% while SM utilization is moderate, the GPU is waiting on memory, not compute. The fix is usually a different batching strategy or quantization.
Framebuffer Memory (DCGM_FI_DEV_FB_USED, DCGM_FI_DEV_FB_FREE): VRAM utilization. You want this tracked because OOM kills in GPU training are catastrophic: they abort the entire job, not just the offending process. For inference workloads, tracking VRAM headroom tells you how much batching headroom you have before you hit the wall.
Temperature (DCGM_FI_DEV_GPU_TEMP): Individual GPU temperature per device. In a multi-GPU node, uneven temperatures indicate airflow problems or a failing GPU. A GPU that runs 10-15 degrees hotter than its siblings on the same node deserves investigation before it starts throttling.
Power Usage (DCGM_FI_DEV_POWER_USAGE): Power draw per GPU. More useful than you might think: a GPU that suddenly drops power draw during training without a corresponding checkpoint event often means it hit an error condition and reduced activity to protect itself.
NVLink Bandwidth (DCGM_FI_DEV_NVLINK_BANDWIDTH_TOTAL): Critical for distributed training. NVLink is the high-bandwidth interconnect between GPUs on the same node; for multi-node training, the inter-node equivalent is tracked separately through networking telemetry (covered in the GPU cluster networking deep dive). If NVLink bandwidth drops during an allreduce operation, you have a topology or hardware problem affecting collective communication.
PCIe Replay Counter (DCGM_FI_DEV_PCIE_REPLAY_COUNTER): PCIe replays indicate link errors between the GPU and host. An occasional replay is normal. A consistently increasing counter means the PCIe link is degraded, which can cause intermittent errors in GPU memory copies and mysterious training failures.
XID Events: Learning the GPU’s Error Vocabulary
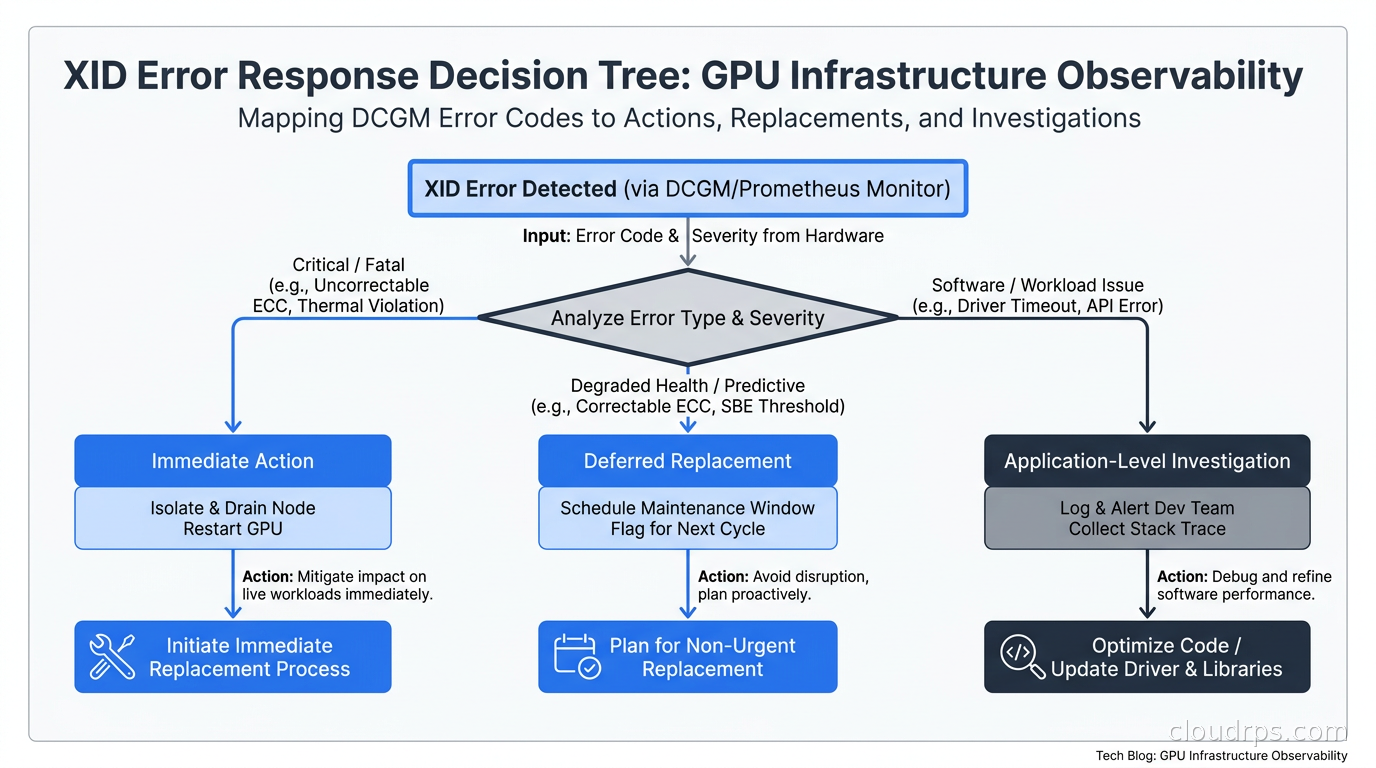
XID events are NVIDIA’s internal error reporting system. Every time the GPU encounters an error condition, it logs an XID event with a specific code. Understanding XID codes is the difference between knowing “the GPU had a problem” and knowing what kind of problem it had and what to do about it.
DCGM surfaces XID events through DCGM_FI_DEV_XID_ERRORS. This counter increments each time an XID event fires. The raw count is less useful than the event stream, which you get by also watching kernel log output (/var/log/messages or dmesg) on GPU nodes. The Prometheus counter tells you something happened; the kernel log tells you which XID code and, for most codes, what it means.
Common XID codes and their production implications:
XID 13 (Graphics Engine Exception): Typically a faulty application, a driver bug, or a corrupted instruction stream. Isolated occurrences are often driver version conflicts. If it repeats persistently on a specific GPU, suspect hardware.
XID 31 (MMU Fault): The GPU’s memory management unit raised a fault, typically because a CUDA kernel accessed a virtual address it did not have a valid page table entry for. Usually an application bug. If it appears outside of application crashes, investigate whether you have a kernel or driver regression.
XID 48 (DBE ECC Error): A double-bit ECC error that could not be corrected. This is hardware-level memory corruption. A GPU that generates XID 48 events should be taken out of production and evaluated for replacement. No amount of ECC scrubbing will make this reliable.
XID 63, 64 (Row Remapping): The GPU’s ECC hardware is remapping bad memory rows. A small number of these is expected over the GPU’s lifetime. Consistent accumulation suggests the memory subsystem is degrading.
XID 74 (NVLink Error): A NVLink communication error. In multi-GPU training, this can corrupt gradient communication without necessarily killing the process. Training continues with wrong gradients. The model trains toward gibberish, and you do not find out until evaluation.
XID 79 (GPU Off-Bus): The GPU has been removed from the PCIe bus. This is almost always a hardware problem: thermal stress, power fluctuation, or a physical hardware failure. In high-density H100 racks running near their thermal envelope, XID 79 can indicate inadequate cooling rather than GPU failure.
XID 92 (High Single-Bit ECC Error Rate): Single-bit errors are normally corrected transparently by ECC hardware. A high rate of them suggests the memory is degrading faster than normal and should be flagged for replacement planning.
I have seen teams ignore persistent XID 74 events for weeks because the training jobs kept running. The symptom was models that trained to worse-than-expected evaluation metrics for no apparent reason. Gradient corruption from NVLink errors is insidious precisely because it does not crash the job.
ECC Errors: Transient Faults vs Hardware Failure
GPU memory uses error-correcting code (ECC) hardware to detect and correct single-bit memory errors. DCGM exposes two critical counters: volatile (cleared on driver reload) and aggregate (cumulative).
DCGM_FI_DEV_ECC_SBE_VOL_TOTAL: Single-bit ECC errors, volatile count. These are corrected automatically by hardware. A small number during a long training run is normal. A rapidly accumulating count suggests the memory is unusually error-prone.
DCGM_FI_DEV_ECC_DBE_VOL_TOTAL: Double-bit ECC errors, volatile count. These cannot be corrected and result in the GPU reporting an uncorrectable error. Any nonzero value here is serious. A double-bit ECC error means data in GPU memory has been corrupted beyond what ECC can fix.
For operational purposes: track the aggregate ECC SBE count per GPU over time. A GPU that accumulates SBEs significantly faster than its peers on the same node is degrading faster. Flag it for the next maintenance window before it reaches the point of generating DBEs.
This integrates naturally with the GPU cost optimization workflow: a degrading GPU costs just as much as a healthy one per reservation but delivers less reliable throughput and higher job failure rates. Tracking ECC trends gives your FinOps practice GPU health data, not just utilization data.
Distributed Training Observability
Single-GPU metrics tell one part of the story. Distributed training introduces collective communication operations (allreduce, allgather, broadcast) where a single slow GPU can stall the entire job. This is the straggler problem: one GPU running at 80% of expected throughput can reduce the effective throughput of a 64-GPU cluster to 80% of its theoretical maximum.
The observable signature: during allreduce operations, most GPUs will show a pattern of compute bursts followed by synchronization waits. In a healthy cluster, these synchronization windows are tight. In a cluster with a straggler, some GPUs will spend disproportionate time in the synchronization phase waiting for the slow GPU to complete its local gradient computation.
You detect this by correlating per-GPU SM utilization timelines. When one GPU consistently shows lower utilization during phases when its peers are at high utilization, you have identified a straggler. The root cause can be clock throttling (check temperature and power), NVLink errors (check XID 74 counters), a PCIe link issue (check PCIe replay), or simply a GPU with degraded memory bandwidth.
For teams using MIG (Multi-Instance GPU) partitioning, DCGM supports per-MIG-instance metrics, though some counters (NVLink, PCIe) are only available at the physical GPU level. Plan your monitoring topology around what granularity you actually need before committing to a MIG configuration.
Building the GPU Grafana Dashboard
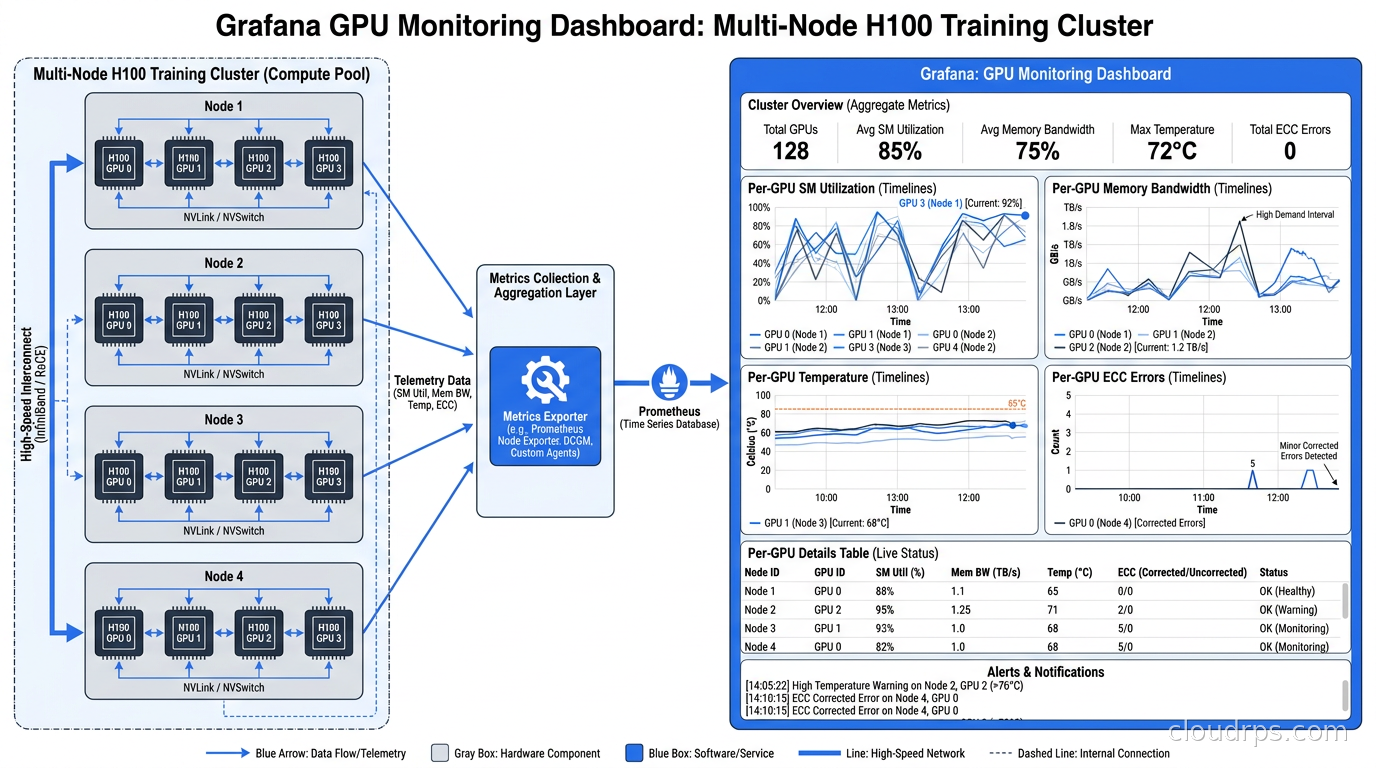
A GPU dashboard that earns daily use in production has three sections.
The first section is fleet health: a row-per-GPU grid showing temperature, SM clock (with a reference line at base clock to make throttling instantly visible), and ECC error counts. Color thresholds should highlight any GPU running significantly hotter than the fleet median or with a nonzero DBE count. This section answers “does anything need attention right now” in one glance.
The second section is per-job utilization: time series panels for SM utilization and memory bandwidth utilization, faceted by job or training run label. This answers “is this job using the GPU efficiently” and is where you diagnose whether a workload is compute-bound or memory-bandwidth-bound. The LLM observability layer handles the model-level view; this GPU dashboard handles the hardware layer below it.
The third section is trend analysis: aggregate ECC accumulation rates per GPU over weeks or months, PCIe replay counter trends, and thermal history. This section is for the platform team’s weekly review, not for the on-call engineer. It is where you identify GPUs that are degrading before they fail catastrophically.
The DCGM Exporter ships with a community Grafana dashboard (dashboard ID 12239 on the Grafana catalog) that covers the basics. Treat it as a starting point, not a finished product. The default dashboard does not include NVLink bandwidth, PCIe replay trends, or ECC trend analysis. Add those panels before you claim your GPU monitoring is production-ready.
For the underlying metrics infrastructure, this fits naturally into the same Prometheus and Grafana stack that handles the rest of your cluster observability. GPU metrics do not require a separate time-series database. The one consideration: GPU nodes in large clusters can generate substantial metric cardinality if you enable every available DCGM field. Profile your Prometheus ingestion rate before enabling the full metric set.
Alerting That Earns Trust
GPU alerting fails in two ways: it either fires too liberally (every SM utilization dip triggers a page, on-call ignores all alerts) or it fires too late (a GPU failed three hours ago and nobody noticed until the training run died). Neither is acceptable.
Alerts I run in production GPU clusters, roughly in order of operational urgency:
High-severity, page immediately:
- Any
DCGM_FI_DEV_ECC_DBE_VOL_TOTALcounter greater than zero on any GPU. A double-bit ECC error is a hardware event that requires investigation before the GPU runs production workloads again. - XID 79 (GPU off-bus) detected in kernel logs. The GPU has disconnected from the PCIe bus. The node needs attention.
- GPU temperature exceeding the GPU’s published max junction temperature. At that point, hardware protection mechanisms are actively throttling the device.
Medium-severity, notify and investigate:
- SM clock consistently below base clock for more than a few minutes during a training run. The GPU is throttling. Investigate whether it is thermal (check temperature), power (check power draw against node power budget), or a hardware issue.
DCGM_FI_DEV_PCIE_REPLAY_COUNTERincreasing rapidly. PCIe link errors degrade reliability.- NVLink bandwidth significantly below expected values during active distributed training.
Low-severity, track in dashboard:
- Single-bit ECC error rate that is an outlier compared to peers on the same node. Not urgent, but flag for maintenance planning.
- GPU utilization consistently low during periods when jobs should be running. Might indicate scheduling inefficiency; worth investigating but not paging.
Avoid alerting on absolute SM utilization thresholds. A GPU at 40% utilization might be perfectly healthy if the workload is memory-bandwidth-bound. Alerts that require understanding the workload context to evaluate are alerts that on-call engineers learn to dismiss.
Cost Attribution Through GPU Telemetry
One underutilized application of GPU metrics is cost attribution for shared clusters. If you run a multi-tenant GPU cluster, every GPU-hour consumed by each tenant should map to billing or showback. The Kubernetes cost visibility tools can report GPU-hour consumption per namespace or team. DCGM gives you a richer view: actual SM utilization per job, not just GPU-hours reserved.
A team that reserves a GPU for 8 hours but uses it at 30% SM utilization has a different cost profile than one that drives the same GPU at 90% SM utilization for 4 hours. Tracking effective GPU utilization, not just GPU reservation time, reveals which teams are hoarding capacity versus which are genuinely compute-constrained. This is the data that justifies fractional GPU allocations or time-slicing policies for teams whose workloads do not actually saturate a full GPU.
On bare-metal and on-premises clusters where GPU hardware choices include H100 SXM, A100, and L40S nodes with different per-hour costs, DCGM-driven utilization tracking also tells you whether workloads are well-matched to the hardware they run on. An inference workload that fits on an L40S running at 80% utilization does not belong on an H100 SXM at 20% utilization. That insight pays for the entire observability stack.
GPU Health Automation
The final step beyond monitoring is automating the response to GPU health events. Production GPU clusters running 24-hour training jobs cannot wait for a human to page on an XID 48 event, investigate manually, and decide to drain the node. The response needs to be fast and consistent.
The pattern I use: DCGM generates a Prometheus alert for critical XID events. The alert fires an Alertmanager webhook. The webhook calls a small automation service that labels the affected Kubernetes node with a gpu-health=degraded taint, which evicts scheduled GPU pods and prevents new scheduling. The training job reschedules to a healthy node from its last checkpoint. The platform team gets a Slack notification to investigate the flagged node.
This loop: detection to eviction in under two minutes without human intervention. Without it, a training run on a cluster with a degraded GPU can run for hours generating garbage gradients before someone notices the evaluation metrics are wrong.
The tooling to build this exists entirely within the standard Kubernetes and Prometheus ecosystem. You do not need a specialized GPU management platform. What you need is the discipline to instrument the cluster before the first training run goes to production, not after the first mysterious failure.
GPU infrastructure observability is not a nice-to-have for clusters running expensive AI workloads. It is the foundation that makes everything else reliable: your FinOps numbers are only credible if you know what the hardware is actually doing, your SLOs for training jobs are only achievable if you know when hardware is degrading before it causes failures, and your incident response is only effective if you have the telemetry to diagnose GPU-layer problems without spending hours reading cryptic kernel logs.
DCGM has been the right tool for this job for years. It integrates cleanly into the Prometheus and Grafana stack most teams already operate. The investment to deploy it, configure meaningful alerts, and build a GPU health dashboard is measurably smaller than the cost of a single multi-day training run that stalls and requires restart because a GPU was silently throttling.
For teams already tracking GPU costs with AI FinOps and GPU networking with RDMA and NVLink telemetry, DCGM-based observability completes the picture. The hardware layer is finally visible.
Get Cloud Architecture Insights
Practical deep dives on infrastructure, security, and scaling. No spam, no fluff.
By subscribing, you agree to receive emails. Unsubscribe anytime.