I remember the first time a CFO walked into an architecture review not to talk about cost but to ask about carbon. It was 2023, and I thought he’d gotten lost on the way to the finance review. He hadn’t. The company had signed a net-zero commitment and suddenly the cloud bill had two numbers on it: dollars and tonnes of CO2.
GreenOps is what happens when you apply the rigor of FinOps to environmental impact. The good news: most techniques that reduce cloud costs also reduce carbon emissions. The interesting news: there’s a whole additional layer of optimization available when you start measuring and optimizing for carbon specifically, not just cost.
Why Cloud Infrastructure Has a Carbon Problem
Data centers consume roughly 1-2% of global electricity. That sounds small until you realize global electricity consumption is enormous and the percentage is growing as AI workloads scale. A single large language model training run can emit hundreds of tonnes of CO2. A company running thousands of cloud workloads adds up faster than most engineers realize.
The carbon footprint of cloud infrastructure comes from two sources. The first is operational emissions: the electricity consumed to run servers, cooling systems, and networking equipment. The second is embodied emissions: the carbon cost of manufacturing servers, storage hardware, and networking equipment.
For cloud users, operational emissions are where you have direct control. And the relationship to cost is tighter than you might think: energy costs make up a significant fraction of cloud provider bills, so wasting compute cycles wastes both money and electricity. The classic waste patterns I’ve seen across dozens of engagements share one trait. They all look the same on a carbon emissions report as they do on an AWS Cost Explorer: oversized instances, idle resources running 24/7, and workloads scheduled during peak grid demand hours.
How Cloud Providers Report Carbon (and Why the Numbers Are Complicated)
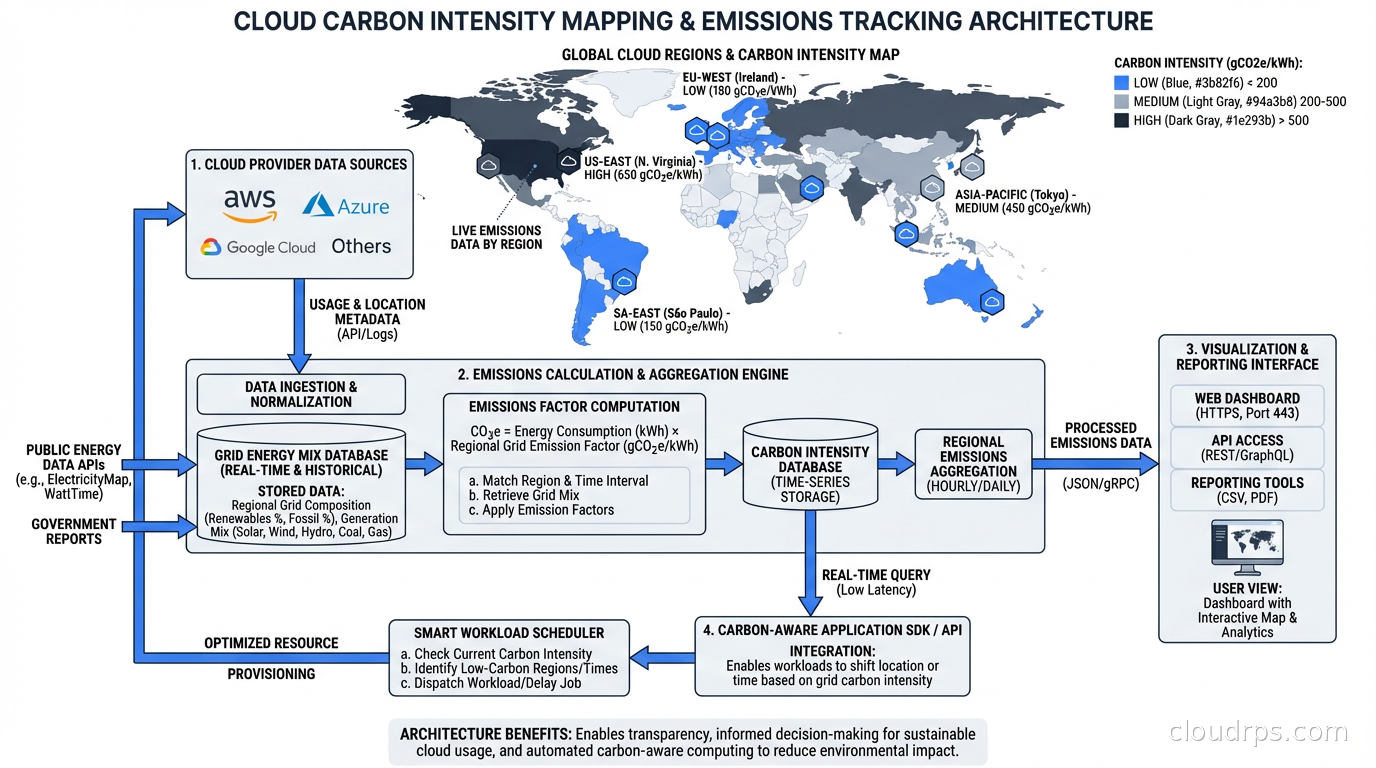
AWS, Google Cloud, and Azure all publish sustainability dashboards. AWS provides a Customer Carbon Footprint Tool. Google Cloud has carbon footprint reporting in the billing console. Azure has the Emissions Impact Dashboard. These tools exist and they’re useful starting points.
But the numbers are complicated for a few reasons.
Cloud providers often report market-based emissions, meaning they account for renewable energy certificates (RECs) and power purchase agreements (PPAs) that offset grid electricity. A data center region running on 100% renewable electricity (matched annually via PPAs) can report near-zero scope 2 emissions even during hours when the local grid is running on coal. The underlying grid emissions happened; they’ve just been offset on paper.
Location-based emissions reporting tells a different story. A workload running in a region powered by hydroelectric dams (like AWS us-west-2 in the US Pacific Northwest) genuinely has lower lifecycle emissions per kWh than one running in a region with a coal-heavy grid.
For most engineering teams, the practical implication is: region selection matters for carbon, not just for latency. I’ve seen teams blindly deploy to us-east-1 for every workload because “it’s closest to users” while leaving genuinely greener options on the table for batch workloads that have no geographic requirement.
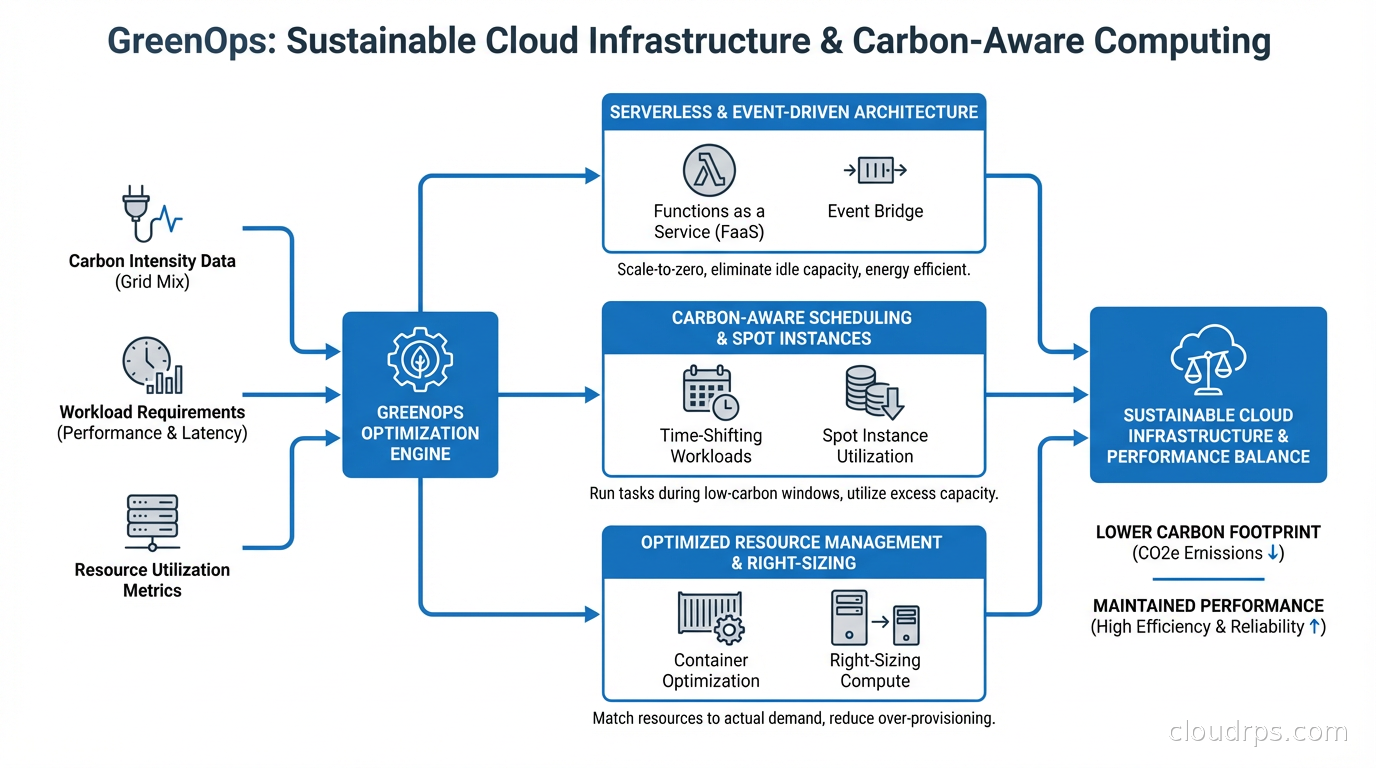
The GreenOps Toolkit: What Actually Works
Let me go through the techniques that I’ve seen deliver real carbon reductions, not just reductions in the carbon accounting.
Right-Size Before Anything Else
This is the foundation of both FinOps and GreenOps. Oversized instances waste electricity running CPUs and RAM that sit at 10% utilization. The fix is the same: use observability data to right-size.
The ARM architecture angle is important here. AWS Graviton and Ampere Altra processors deliver significantly better performance per watt than equivalent x86 instances. A Graviton3 instance running at 50% CPU utilization consumes less electricity than an equivalent x86 instance running at 30% utilization for the same workload. The efficiency gain is real and it compounds when you’re running hundreds of instances.
I’ve run migrations from M5 to M7g (Graviton3) on web application fleets and seen electricity consumption drop by 20-30% alongside cost savings of 15-20%. It’s one of the highest-leverage GreenOps actions available right now.
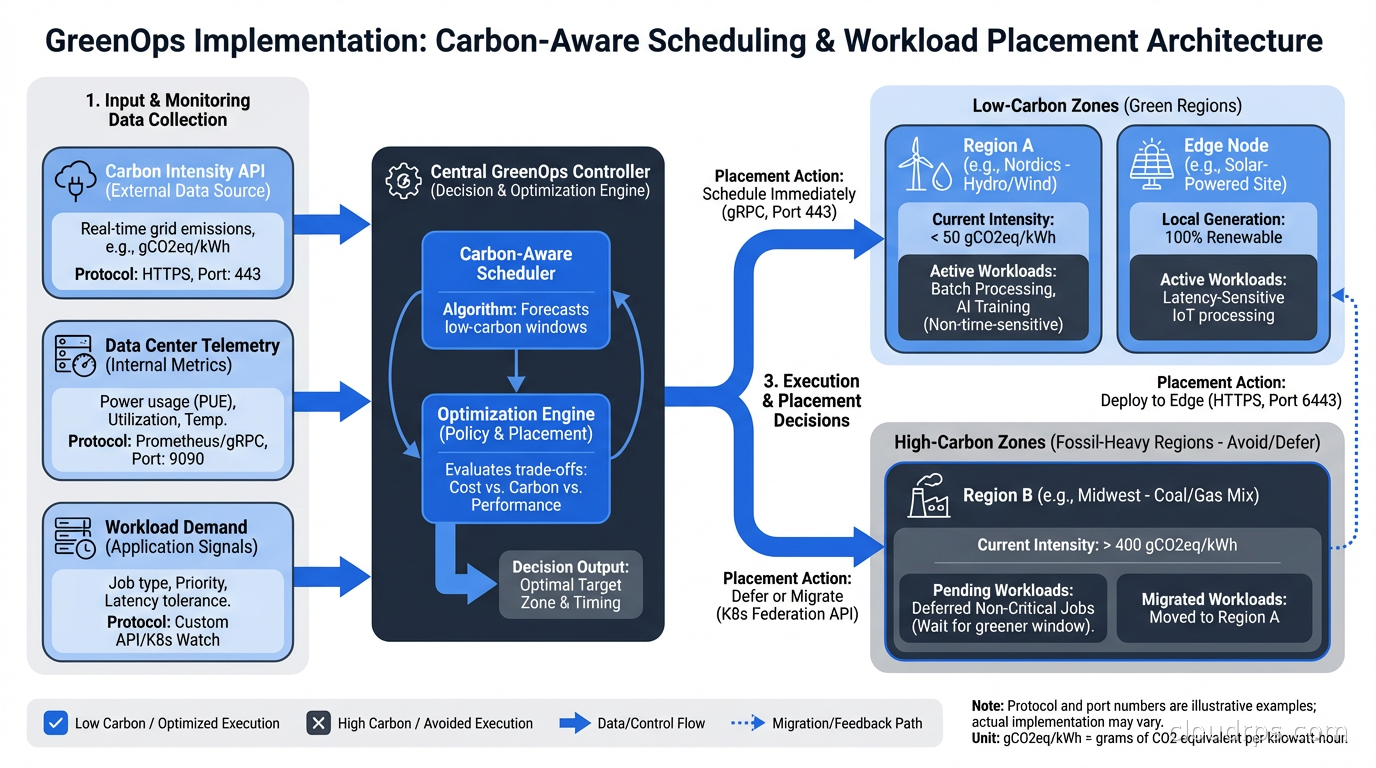
Carbon-Aware Scheduling
This is where GreenOps diverges most sharply from FinOps. The concept: schedule flexible workloads during times when the grid has more renewable energy available, or in regions with lower carbon intensity at the moment of execution.
The electricity grid is not a fixed thing. Wind and solar generation fluctuates throughout the day. Nuclear and hydro provide stable baseload. Natural gas and coal get dispatched to meet peaks. At any given moment, the carbon intensity of the grid (grams of CO2 per kilowatt-hour) varies based on what’s generating power right now.
Tools like WattTime and Electricity Maps provide real-time and forecast data for grid carbon intensity by region. The Carbon Aware SDK, an open-source project from the Green Software Foundation, provides an API abstraction for building carbon-aware applications.
The practical implementation: batch jobs, model training runs, data processing pipelines, and other non-latency-sensitive workloads can be scheduled to run at times of lower grid carbon intensity. This doesn’t require significant engineering investment. It’s fundamentally a scheduling problem. A workload that runs at 3am on a Tuesday versus 7pm on a Friday might have dramatically different carbon footprints depending on the region.
Autoscaling Aggressively, Not Conservatively
Most teams I’ve consulted with set their autoscaling policies conservatively: scale out early, scale in slowly, keep headroom. This is a reasonable position for reliability, but it has a carbon cost.
Kubernetes autoscaling with HPA, VPA, and KEDA gives you the tools to match compute to demand more tightly. Karpenter can bin-pack workloads onto fewer, denser nodes and terminate unused capacity aggressively. The environmental benefit of consolidating 50 nodes to 35 is proportional to the power reduction.
Serverless architectures take this further. A genuinely serverless workload consumes zero electricity when it’s not running. For sporadic, event-driven workloads, the environmental argument for serverless is compelling: you’re not paying the idle cost of a reserved server waiting for traffic that might not come for hours.
Region Selection for Batch Workloads
This is underutilized. If you’re running batch analytics, ML training, or data processing and have no geographic requirement for where the compute runs, you can select the region with the lowest carbon intensity.
As of 2025, the regions with the cleanest grids for major cloud providers tend to be: AWS us-west-2 (Pacific Northwest hydro), GCP northamerica-northeast1 (Quebec hydro), Azure swedencentral (Nordic renewables), and GCP europe-north1 (Finland, primarily renewables). Regions with historically higher carbon intensity include those in coal-heavy grids, which varies by provider and reporting period.
The multi-region complexity is real. You need to account for data transfer costs and latency. But for compute-intensive workloads where data can reasonably move to the compute, this optimization is worth the engineering investment.
Eliminating Zombie Resources
Idle resources are both a FinOps and GreenOps embarrassment. I audited a mid-size fintech’s AWS environment last year and found 340 EC2 instances that hadn’t served meaningful traffic in more than 30 days. They were running 24/7. The cost was significant; the carbon was proportional.
The detection tools are the same as for cost: AWS Trusted Advisor, GCP Recommender, Azure Advisor, or third-party FinOps platforms like Apptio Cloudability or CloudHealth. Tag hygiene matters here. Resources without ownership tags are the ones that never get cleaned up because nobody knows who to ask.
A specific pattern I’ve seen repeatedly: old development environments that were stood up for a project that ended. Nobody terminated them. They run forever. Enforce TTLs on non-production environments and you eliminate this category of waste entirely.
Storage Lifecycle Policies
Storage is easy to overlook in carbon discussions because it doesn’t have CPUs spinning. But storage consumes electricity (spinning disks especially) and involves embodied carbon in the hardware. More practically, unnecessary data sitting in expensive storage tiers is both a cost and emissions problem.
S3 intelligent tiering, Glacier deep archive, and equivalent features on other clouds move infrequently accessed data to lower-power storage tiers automatically. For large data-heavy organizations, this is meaningful. Retaining 10 petabytes of data that could be in cold archive in hot storage is energy waste at scale.
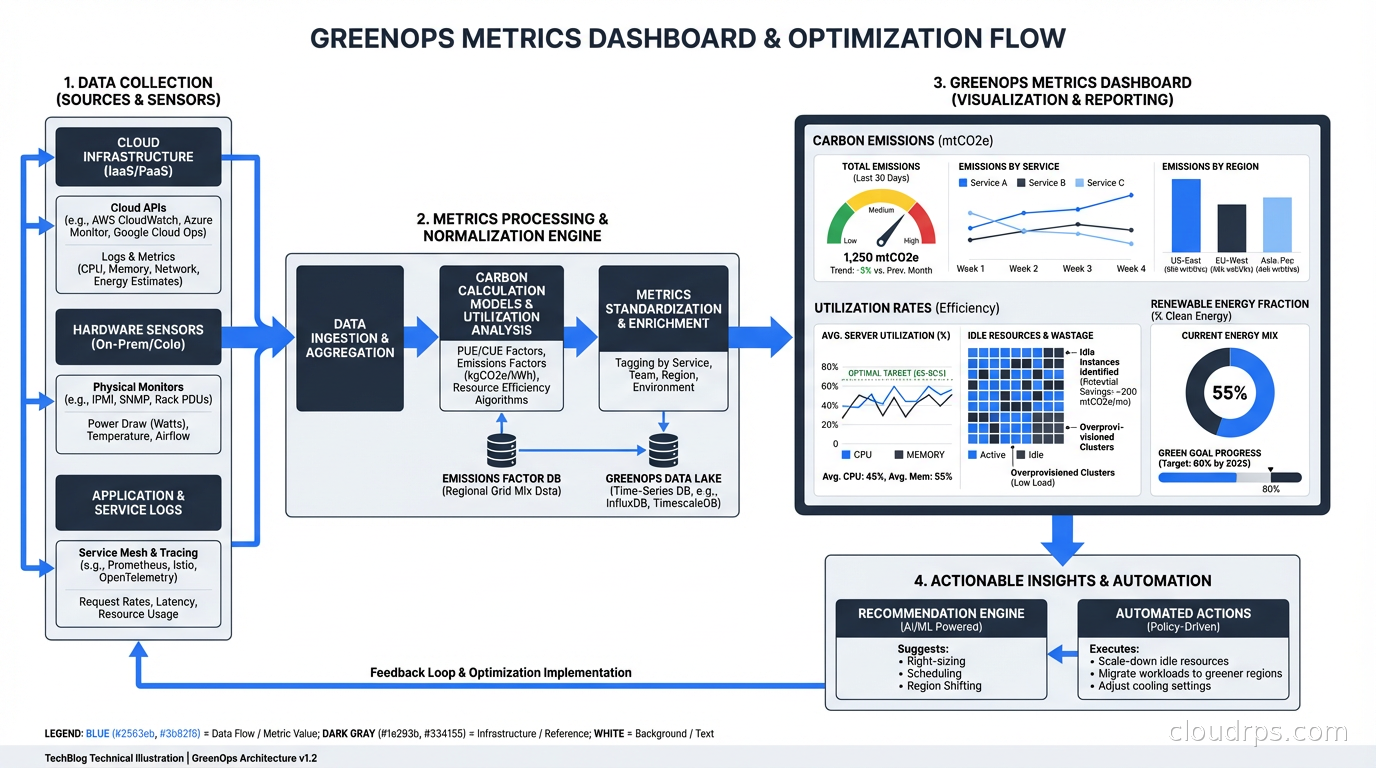
Measuring and Reporting GreenOps Progress
The core metrics for a GreenOps program:
Carbon emissions per workload (gCO2e): Cloud provider tools give you this at the account or project level. More sophisticated tooling like CloudZero or Infracost can break it down by team, service, or environment.
Carbon intensity of compute (gCO2e per vCPU-hour): Helps compare instance types and regions on a carbon basis, not just cost.
Utilization rate: A useful proxy. A fleet running at 15% CPU utilization has significant potential for both cost and carbon reduction. Target 50-70% average utilization as a healthier baseline.
Renewable energy fraction: What percentage of your compute hours ran in regions where your provider has renewable energy coverage? Cloud providers report this but it varies by region and the accounting methodology matters.
Building a GreenOps dashboard alongside your FinOps dashboard makes the data visible. Invisible problems don’t get fixed.
The Relationship Between FinOps and GreenOps
GreenOps builds on FinOps rather than replacing it. The organizational structures are similar: cross-functional teams, shared accountability, continuous optimization. But there are important differences.
Cost reduction is always good (within reason). Carbon optimization sometimes involves trade-offs: running workloads in a more distant region for carbon reasons adds latency and potentially complexity. Carbon-aware scheduling for batch jobs adds coordination overhead. These trade-offs exist and need to be evaluated explicitly.
The tools are also partially different. FinOps focuses on billing data. GreenOps needs carbon intensity data from grid operators, embodied carbon data from hardware manufacturers, and emissions reporting frameworks (GHG Protocol Scope 1/2/3, CDP, SBTi targets). The intersection of cloud billing APIs and environmental data APIs is where the interesting tooling is emerging.
The total cost of ownership calculation for cloud infrastructure increasingly needs a carbon component. As carbon pricing mechanisms mature and supply chain emissions regulations expand (EU CSRD, SEC climate disclosure rules), the carbon cost of infrastructure will become a real financial exposure, not just an ethical consideration.
Where to Start
If you’re starting a GreenOps program from scratch, here’s the sequence I recommend:
Baseline first. Enable cloud provider carbon reporting tools. Understand what your current footprint looks like before optimizing anything.
Right-size and migrate to ARM. This delivers the biggest immediate win with the lowest risk. Oversized instances and x86 where ARM works are pure waste.
Implement storage lifecycle policies. Low complexity, meaningful impact for data-heavy organizations.
Identify batch workloads for carbon-aware scheduling. Catalog which jobs have flexible timing and implement Carbon Aware SDK or simple region selection logic.
Enforce TTLs on non-production environments. Stop the zombie resource accumulation before it grows back.
Integrate carbon metrics into your engineering scorecard. Once it’s visible and someone owns it, it improves.
The engineers who will be most valued over the next decade are the ones who can optimize systems across multiple dimensions simultaneously: cost, performance, reliability, and carbon. That’s a harder problem than any single-axis optimization, and it’s where the interesting architecture work is happening right now.
Related: FinOps: Cloud Cost Optimization for Engineers for the cost angle, ARM in the Cloud: AWS Graviton and Ampere Altra for energy-efficient compute, What is Serverless? for the carbon case for serverless, Karpenter: Kubernetes Node Provisioning for cluster efficiency, and TCO in Cloud Computing for total cost analysis.
Get Cloud Architecture Insights
Practical deep dives on infrastructure, security, and scaling. No spam, no fluff.
By subscribing, you agree to receive emails. Unsubscribe anytime.