The page dropped on Atlassian’s site without much fanfare: Opsgenie stops accepting new purchases in June 2025 and shuts down entirely on April 5, 2027. Atlassian is folding incident management into Jira Service Management and walking away from the standalone product that tens of thousands of engineering teams depend on.
If you are running Opsgenie today, you have a deadline. The migration is not optional, and the teams that wait until 2027 will be doing it under pressure, which means they will be doing it badly.
But here is the honest truth: this forced migration is an opportunity most teams were going to need anyway. In twenty years of building and running production infrastructure, I have seen incident management done well a handful of times. Most organizations are running on legacy configurations, stale runbooks, escalation policies pointing to engineers who left eighteen months ago, and on-call rotations that are methodically burning people out. The tooling needed a refresh regardless.
This guide is about understanding the landscape, picking the right platform for where you are, and building the kind of on-call culture that actually reduces incidents over time rather than just processing them faster.
What Incident Management Actually Is (And What It Is Not)
Incident management is not alerting. This distinction sounds pedantic but it drives wrong decisions constantly. Alerting is the front door: a Prometheus rule fires, a synthetic check fails, a customer submits a P1 ticket. The signal gets created. Incident management is everything that happens after the signal arrives: who gets paged, how they coordinate, what runbook they execute, when they escalate, how they communicate with affected users, and critically, how the team learns so the incident does not recur.
Your monitoring and logging foundation is table stakes. You need high-quality signals before any paging platform can help you. I see teams spend months tuning incident management tooling while their alert quality is genuinely terrible, with seventy-percent false positive rates and pages firing for conditions that require no human action. The platform cannot fix that. Fix the signal first.
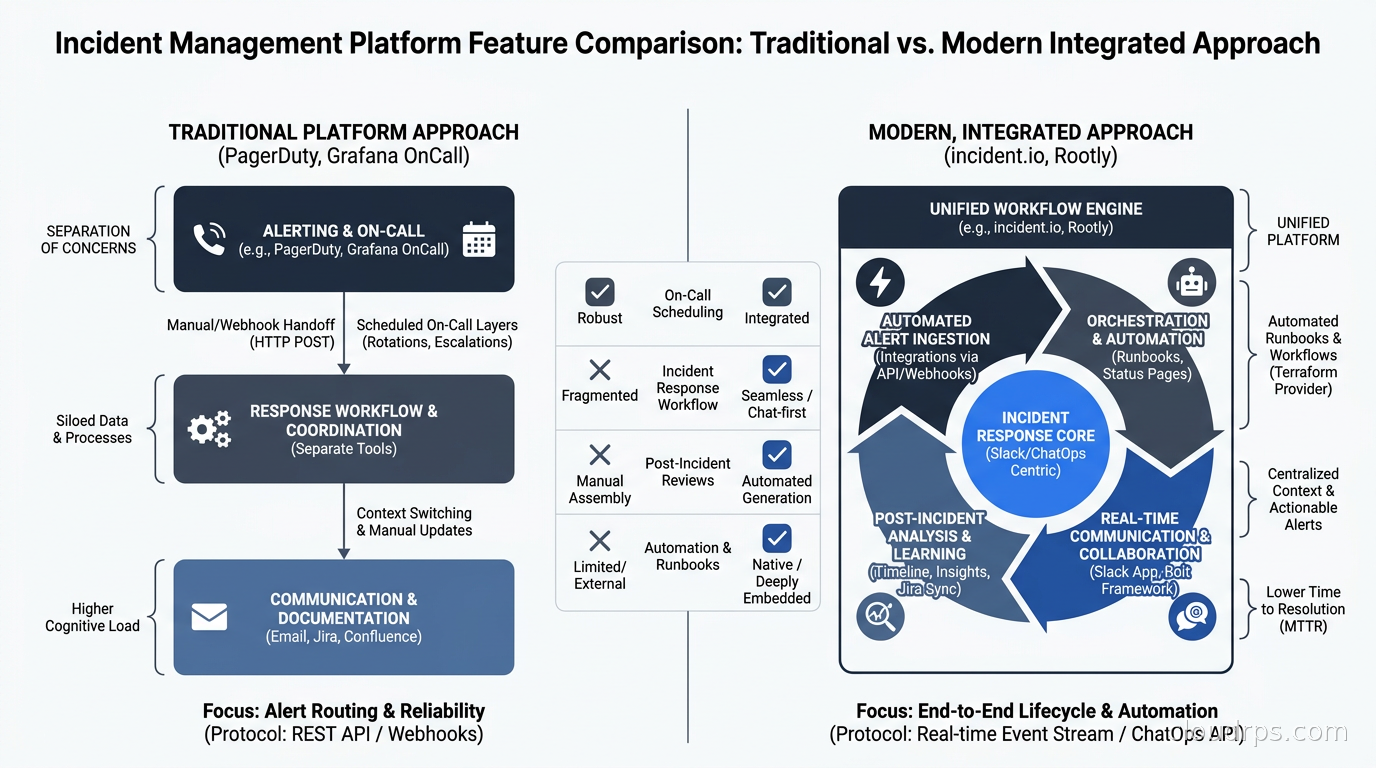
Once your signal quality is reasonable, incident management covers the organizational and tooling layer on top. The modern platforms have evolved to own the entire incident lifecycle, not just the paging layer. Understanding that scope is what separates good platform selection from accidentally buying the wrong thing.
The Four Phases Every Incident Goes Through
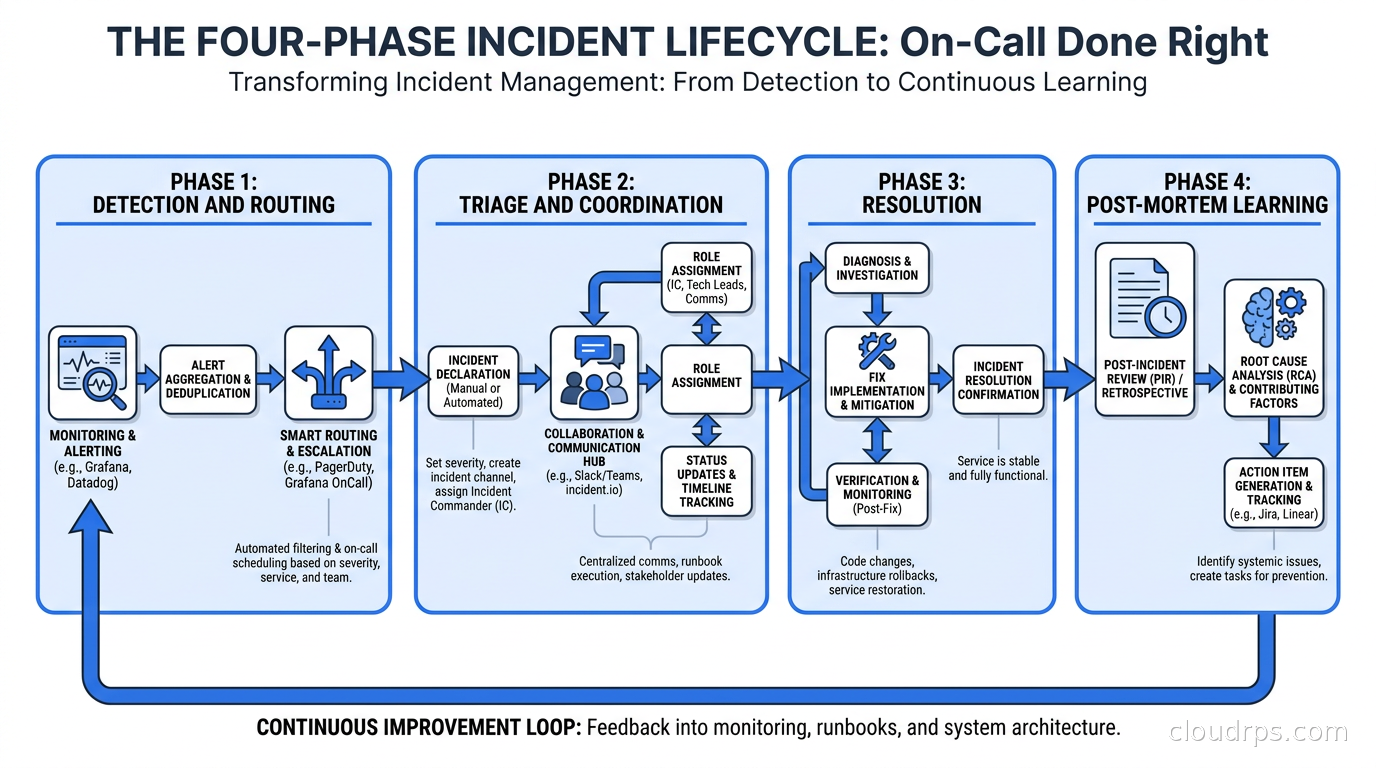
Every incident, whether it is a three-minute blip or a six-hour outage, goes through four phases. Your tooling needs to support all of them.
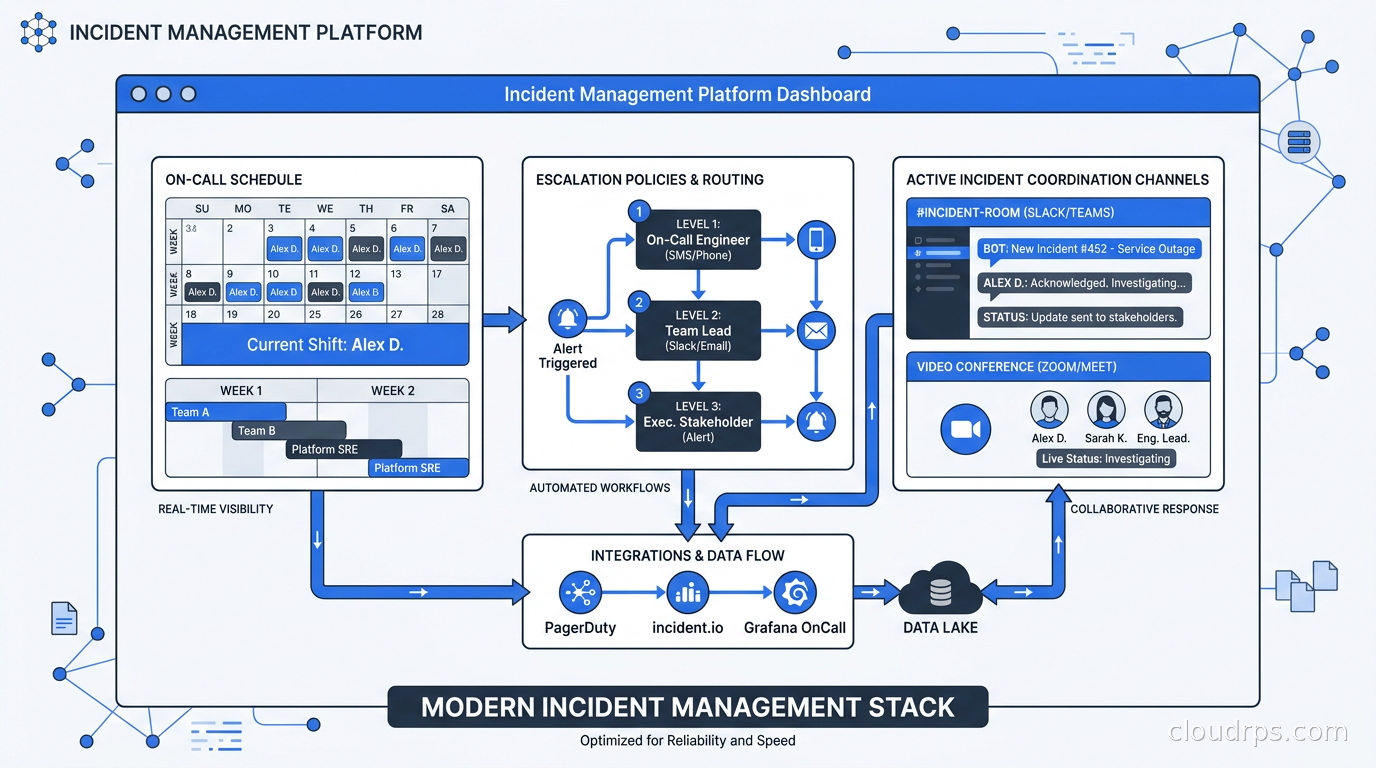
Detection and routing. An alert fires. Something generates a webhook. A customer reports an issue through your support tier. The platform takes that signal and routes it to the right on-call engineer with the right context. This is where escalation policies, on-call schedules, and service catalogs live. When this phase works well, the right person gets paged once within sixty seconds with enough context to start triage. When it works badly, alerts go to the wrong team, chain-page multiple engineers unnecessarily, or arrive with no context beyond a metric name.
Triage and coordination. The on-call engineer is now engaged, either at 3am or pulled from afternoon deep work. They need to understand scope quickly: is this a single service, a dependency failure, a platform-wide event? Do they need help? Who else should know? This is where incident channels, role assignment (incident commander, communications lead, technical responder), runbook access, and coordination tooling matter most. The difference between a well-run incident and a chaotic one often comes down to whether coordination is structured or improvisational.
Resolution. The actual fixing. Good tooling in this phase means automatic timeline tracking, audit trails, and context that does not require the engineer to reconstruct history mid-incident. When you are in a triage loop at 4am, you do not have spare cycles for documentation. The platform should be building the record while you work.
Learning. The post-mortem. This is where most organizations fall down. The platforms that do this well make post-mortem generation automatic: they reconstruct the incident timeline from the audit trail, surface contributing factors, and create a structured document that actually gets followed up. When post-mortems are manual, they end up as shallow summaries written three days later from memory. When they are generated from the incident record, they reflect what actually happened.
Your SLO and error budget framework is what determines severity thresholds that drive all of this. An incident burning ten percent of your monthly error budget in forty minutes is different in urgency from one that burns half a percent. Get that framework established before you spend time tuning incident management tooling, because the tooling should be configured around your actual reliability targets.
What Actually Matters When Evaluating Platforms
Before walking through the specific tools, here is the feature checklist I use when evaluating incident management platforms. Some of these are table stakes. Some are genuine differentiators.
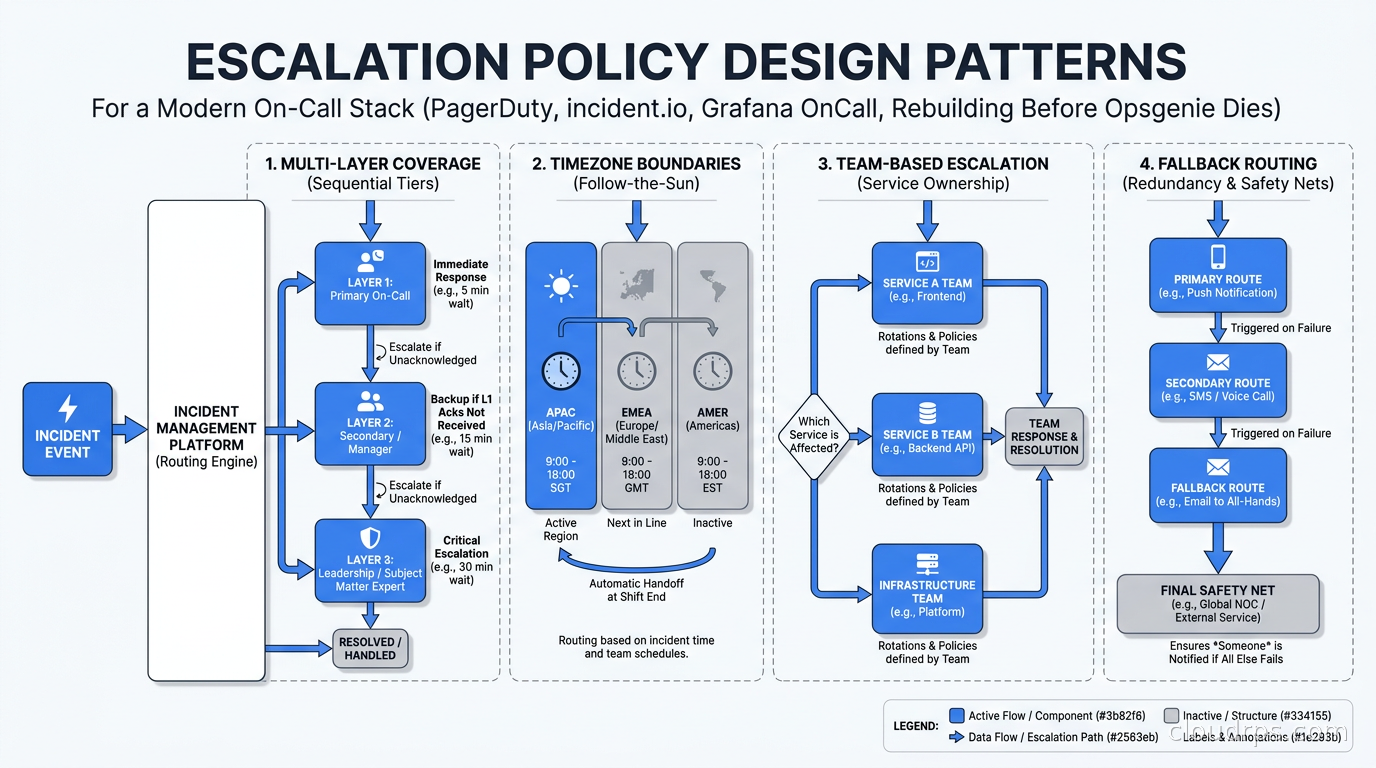
On-call schedule flexibility. Can the tool model your actual rotation structure? Multi-layer schedules, timezone-aware shift boundaries, override handling, vacation coverage workflows. Platforms that only support simple weekly rotations create workarounds, and workarounds break under pressure.
Escalation policy design. How many escalation levels can you configure? What happens when an alert goes unacknowledged for five minutes? Ten minutes? Can you escalate across team and service boundaries? Can policies reference other policies? In large organizations this gets complicated quickly, and brittle escalation policies are where incidents grow from a bad hour into a bad night.
Alert deduplication and grouping. Flapping alerts destroy morale and train engineers to ignore pages. When fifty hosts start failing simultaneously because a shared dependency went down, you need one incident, not fifty pages. Intelligent deduplication and grouping is a requirement, not a nice-to-have.
Runbook integration. A link to a wiki page is not enough. The best platforms embed relevant runbook content directly in the alert context so engineers are not hunting for documentation while the site is on fire. Some platforms now surface runbook steps dynamically based on the alert type.
Status page and stakeholder communication. Internal updates to affected teams and external status pages for customers are related but distinct workflows. Good platforms handle both without requiring a separate tool subscription.
Post-mortem tooling. Timeline reconstruction, contributing factors, action item tracking with assignment and due dates. If your post-mortem is a blank Google Doc that someone fills out from memory two days later, you will keep having the same incidents.
DORA metrics instrumentation. Mean time to recover is a DORA metric. Your incident management platform should be the authoritative source of that number. If you are tracking MTTR in a spreadsheet, you are working too hard and probably undercounting.
Pricing per user. PagerDuty pricing has become a serious grievance in the SRE community. At scale, you are paying thirty to fifty dollars per user per month before add-ons. A fifty-engineer team is a five-figure annual line item before you add the AI features or the status page module. That math is worth doing before you sign.
PagerDuty: The Incumbent
PagerDuty has dominated this space since 2009. If you have been in the industry more than five years, you have a strong opinion about it. Usually the opinion involves the word “powerful” and the word “expensive” appearing close together.
The strengths are real. PagerDuty’s integration ecosystem is legitimately impressive: 750-plus native integrations means it connects to almost every monitoring, observability, ticketing, and communication tool without custom webhook configuration. The on-call scheduling engine handles complex rotation structures including multi-layer coverage, timezone-aware handoffs, and automatic holiday handling. The escalation policy system is mature enough to model large enterprise organizational structures. And if you have compliance requirements, PagerDuty has done the hard work on SOC 2 audit trails, HIPAA logging, and FedRAMP authorization.
The weaknesses are also real. Pricing is the obvious one: the Business plan runs around forty-one dollars per user per month, and adding AIOps capabilities, the Advance AI features, and the status page module pushes a fifty-person team toward thirty-nine thousand dollars annually. For an enterprise with a negotiated procurement relationship, that number is defensible. For a growth-stage company watching its cloud bill, it is a harder conversation.
The UI has improved since the years when it was genuinely painful to navigate, but it still has a legacy feel in places. Configuration workflows that should take three clicks sometimes take eight. Engineers who grew up in Slack-native tools find the incident coordination workflow clunky.
PagerDuty still makes clear sense in specific contexts: large enterprises with complex multi-team escalation paths, organizations where compliance requirements are non-negotiable, teams heavily invested in ServiceNow or Jira ITSM workflows, and any organization where the cost-per-incident math justifies the price.
incident.io: The Challenger
incident.io launched what they called a PagerDuty Rescue Program in 2026, offering contract buyouts and automated migration tooling for teams willing to switch. That move signals clear confidence in the product and a direct bet that PagerDuty pricing frustration is creating a real market opening.
What incident.io does architecturally different is building the entire incident workflow inside Slack. When an engineer declares an incident, the platform creates a dedicated Slack channel, assigns roles (incident commander, communications lead, technical responder), starts a live timeline, pins the relevant runbook, and begins tracking action items. All coordination happens in Slack. When the incident is resolved, the platform generates a structured post-mortem draft from the timeline automatically.
This sounds like a gimmick until you think about it from the perspective of an engineer paged at 3am. The last thing you want is to log into a separate web application, authenticate, navigate to the right incident, and then switch back to Slack to coordinate. incident.io removes that context switch entirely. The tool is where the work happens.
The platform now covers on-call scheduling and alerting as well, making it a genuine full-stack replacement for PagerDuty rather than just the coordination layer.
Where incident.io is weaker: if your organization runs on Microsoft Teams rather than Slack, the value proposition is substantially diminished. The Teams integration exists but the experience is not the same. Also, the service catalog and dependency mapping features are less mature than PagerDuty’s, which matters in large organizations with complex service graphs.
Pricing is meaningfully lower than PagerDuty. That gap alone is driving many of the migration conversations I am seeing in 2026.
Grafana OnCall: The Right Answer for Grafana Shops
If your observability stack is already Prometheus, Loki, and Grafana, Grafana OnCall deserves serious consideration before you sign another SaaS contract. It is open source, integrates natively into Grafana, and the pricing model is structurally different from both PagerDuty and incident.io.
Grafana OnCall runs as either a managed cloud service inside Grafana Cloud or self-hosted. The self-hosted version is free. The cloud version starts at a price point that is dramatically lower than commercial alternatives. For teams already self-hosting Grafana, this is free operational capability.
The native integration with Grafana dashboards and alert rules is the key strength. When a Grafana alerting rule fires, the Grafana OnCall incident includes the panel visualization, the full alert context, and the runbook link in one place. No webhook configuration, no manual context gathering. The engineer arrives at the incident already seeing the relevant graph.
The weaknesses are worth naming honestly. The on-call scheduling interface is less polished than PagerDuty. The escalation policy configuration has real limits for complex organizational structures. The post-mortem tooling is basic compared to incident.io. And if you have enterprise compliance requirements, Grafana OnCall does not have the same certification portfolio as PagerDuty.
But for teams running self-hosted Grafana, already paying for Grafana Cloud, and looking to avoid yet another SaaS contract, it is a genuinely viable production option. I have helped two mid-size engineering teams deploy it and the feedback from their on-call engineers has been positive, specifically because alert context arrives with the dashboard already visible.
Rootly, Better Stack, and FireHydrant
The market has several other credible options worth naming.
Rootly sits in a similar position to incident.io: Slack-native, strong incident coordination workflow, good post-mortem generation, and reasonable pricing. The on-call and alerting features are functional but not as deep as PagerDuty. Rootly makes particular sense if your primary pain point is the coordination and post-mortem workflow rather than complex multi-team alerting. The service catalog features have improved significantly over the past two years.
Better Stack targets smaller engineering teams with a simpler combined package of uptime monitoring, log management, and on-call alerting in one product at one price. If you are a team of ten to thirty engineers and want a single tool that handles both observability basics and paging without the complexity of enterprise incident management platforms, Better Stack is worth evaluating. It does not handle complex escalation structures well, but for the teams it targets, it does not need to.
FireHydrant has built a strong service catalog and runbook management story. If your organization has complex service ownership structures and you want incident routing to automatically pull in the right on-call engineers based on which services are affected and their dependency graph, FireHydrant has gone deeper there than most competitors.
The Opsgenie Migration: What to Actually Do
If you are running Opsgenie today, here is the practical situation. New purchases stopped in June 2025. Existing access continues until April 5, 2027. Atlassian is pointing users toward Jira Service Management Operations, but that product has a different model, different pricing tiers, and the migration is not as simple as Atlassian’s documentation implies.
The first step is an honest audit of what you actually use in Opsgenie. I have done this exercise with several teams and the pattern is consistent: most organizations use roughly thirty percent of the platform’s capabilities. That thirty percent is usually on-call schedules, escalation policies, alert routing rules, and basic integrations. Everything else is either unused or partially used in ways that could be easily replicated.
That minimal footprint makes migration less painful than it initially appears. Start by exporting your on-call schedules and escalation policies. These are the most time-consuming things to recreate because the data formats are proprietary, and getting the schedules wrong means real engineers get missed alerts. incident.io has automated migration tooling specifically built for Opsgenie transitions. Grafana OnCall has import scripts. Both are reasonable starting points.
Do not wait until late 2026 to start this work. Migrations done under deadline pressure are migrations done badly. I watched a team attempt a forced tool migration in the last two weeks before a platform shutdown. The configuration errors, the lost institutional knowledge about why certain escalation rules existed, and the trust damage with the on-call engineers who got missed pages during the transition cost them three months of cleanup work after the migration was technically complete.
How to Choose
Here is the framework I use when advising teams on platform selection.
Choose PagerDuty if you are a large enterprise with compliance requirements that reduce optionality, you have dedicated tooling budget, your escalation structures are complex enough to need the most mature platform on the market, and you are already integrated into ServiceNow or Jira workflows at an organizational level. At scale, PagerDuty’s reliability track record and integration depth justify the price.
Choose incident.io if your team lives in Slack, you want incident coordination and on-call management integrated into the same tool, you are actively frustrated with PagerDuty pricing, and your team cares about the quality of the post-mortem workflow. This is where I would point most growth-stage companies and mid-market engineering organizations in 2026.
Choose Grafana OnCall if you are already running the Grafana observability stack, you are cost-sensitive, you prefer open source with the option to self-host, and you can accept a less polished UX. For teams where Grafana is already the operational center of gravity, the integration benefits are real.
Choose Better Stack if you are a small team that wants simplicity, wants a single bill for monitoring and alerting, and does not have complex multi-team escalation requirements.
The one thing I push back on in every platform evaluation: do not select based on features you think you might need in two years. Figure out the actual problem you have now. Is the issue that alerts are noisy and pages go to the wrong people? That is an alert routing problem. Is the issue that incident coordination is chaotic? That is a workflow problem. Is the issue that you keep having the same incidents repeatedly? That is a post-mortem and learning problem. Match the tool selection to your actual pain, then expand from there.
Building a Better On-Call Culture
The tooling is maybe thirty percent of the on-call equation. The other seventy percent is organizational. I have seen teams with excellent platforms that were still grinding their engineers into the ground, and teams with mediocre tooling that had healthy on-call cultures because the human elements were right.
Alert quality is a product, not a project. Tuning alerts is never done. You need explicit ownership of signal quality as an ongoing responsibility. When the on-call engineer receives fourteen pages in a night and eleven of them require no action, the problem is not the paging platform, it is the alert rules. Ruthlessly eliminate alerts that do not require immediate human action. Your observability pipeline should be routing signals to people only when those signals need human judgment. Everything else belongs in a dashboard, not a page.
On-call fairness matters for retention. Engineer burnout from on-call responsibility is real and it accelerates attrition in ways that show up in exit interviews but not in incident metrics. If your senior engineers are carrying disproportionate rotation burden while junior engineers are protected from it, you have a structural problem that compounds over time. If compensation does not reflect the burden of on-call, you are eroding the unspoken contract with your team. These are human problems that no SaaS platform fixes.
Blameless post-mortems are not soft. The blameless post-mortem framework is not about protecting individuals from accountability for their actions. It is about getting to systemic root causes rather than stopping at the human who made the most recent mistake. When post-mortems focus on who pressed the wrong button, teams optimize for covering their tracks rather than surfacing the process or tooling failures that made the mistake possible. That is how organizations keep having the same incident for five years running.
Practice incident response deliberately. Chaos engineering is not just about finding technical failure modes. It is about practicing the human coordination so that the first time your team has to run a real escalation with three services down is not at 3am on a Saturday. Scheduled game days with deliberately injected failures expose whether your runbooks are accurate, whether your escalation policies have gaps, and whether your newest engineer has ever actually declared a P1 incident before.
Closing
The Opsgenie sunset is a forcing function many teams were going to need eventually. Incident management tooling had accumulated organizational debt at most companies I have worked with. The platforms have also genuinely matured: incident.io and Grafana OnCall represent real step changes in usability and workflow design compared to where the space was five years ago.
If I were building from scratch today with a typical growth-stage team: incident.io for a Slack-native organization that wants one tool across the full incident lifecycle, Grafana OnCall for a team already running self-hosted Grafana that does not want another monthly SaaS charge, and PagerDuty only when enterprise compliance requirements are genuinely non-negotiable.
Whatever you choose, start the Opsgenie migration work before the deadline forces your hand. Export your data, audit what you actually use, and let your on-call engineers build muscle memory in the new tool during low-stakes periods rather than during their first real incident on the new platform. The teams that migrate calmly are the ones that come out with better infrastructure and healthier engineers.
Get Cloud Architecture Insights
Practical deep dives on infrastructure, security, and scaling. No spam, no fluff.
By subscribing, you agree to receive emails. Unsubscribe anytime.