I have spent twenty years watching organizations pour money into infrastructure with no real idea where it goes. In the mainframe era, at least you had a single line item on the invoice. With cloud, people started getting surprised by bills, and most companies built dashboards that told them how much they spent in aggregate, which is essentially useless. The number that matters is: which team, which service, which deployment is responsible for this cost, and is that spend justified.
Kubernetes made this worse before it made it better. When you are running workloads on shared nodes, the cost of any individual container is not what your cloud provider bills you for. AWS bills you for the EC2 instance. Azure bills you for the virtual machine. GCP bills you for the Compute Engine node. What runs on top of that node is invisible to the billing system. You have a $50,000 monthly compute bill and you can trace maybe 40% of it to specific teams if you are lucky. The rest is “shared infrastructure” and nobody owns it, which means nobody optimizes it.
This is the Kubernetes cost attribution problem, and it is the reason that in 2025 studies show average CPU utilization across enterprise Kubernetes clusters sits around 8%. Teams request resources based on worst-case scenarios, nobody revisits those requests, and the cluster runs at a fraction of its capacity while you pay for all of it.
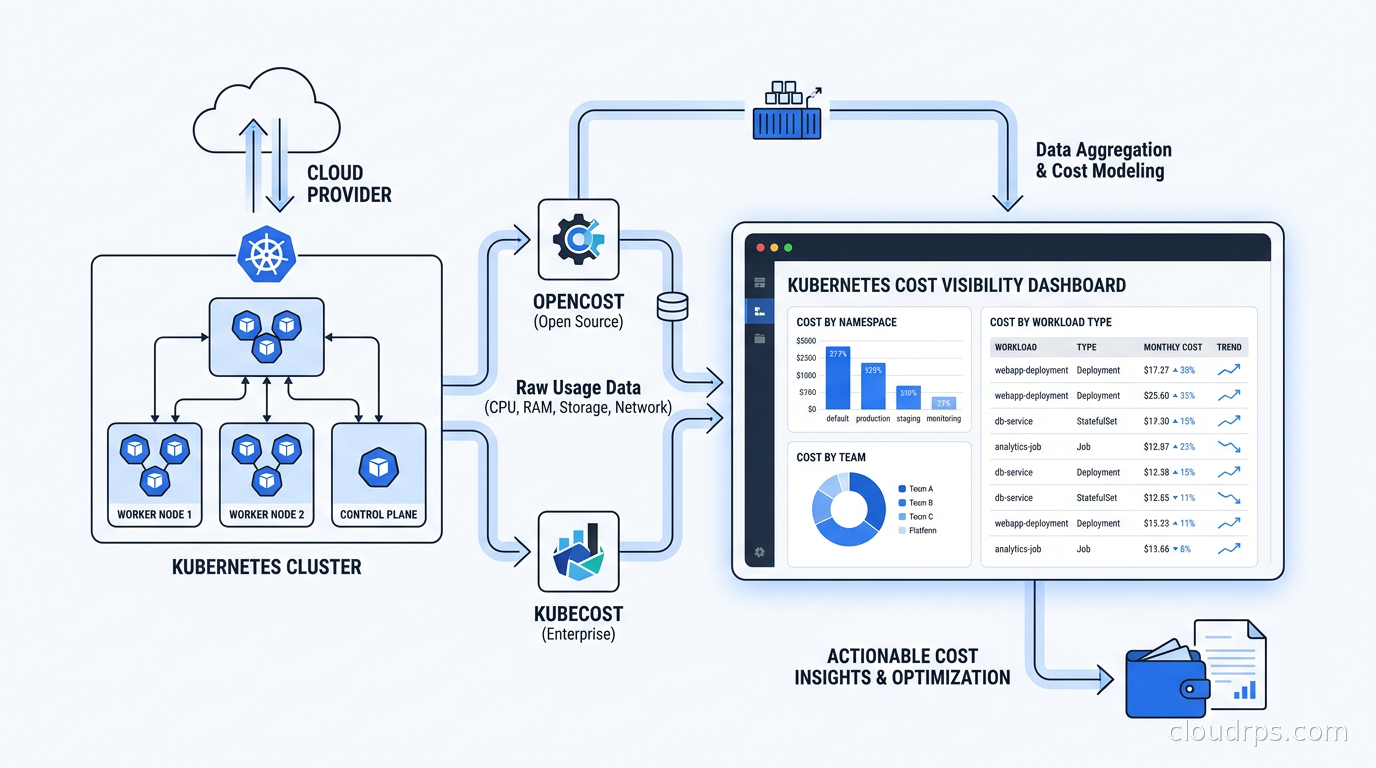
Two tools have emerged to solve this: OpenCost, a CNCF-graduated open standard and project, and Kubecost, the commercial product that built the ecosystem and now contributes to the open standard. Understanding what each does, how they differ, and how to actually implement cost governance around them is what I want to walk through here.
Why Kubernetes Makes Cost Attribution Hard
Before you can understand the solution, you need to understand exactly why the problem is hard.
In a traditional virtual machine model, the mapping from “resource” to “cost” to “team” is relatively straightforward. A team runs a VM, that VM has a tag, the tag maps to a cost center, finance gets a report. It is not elegant but it works.
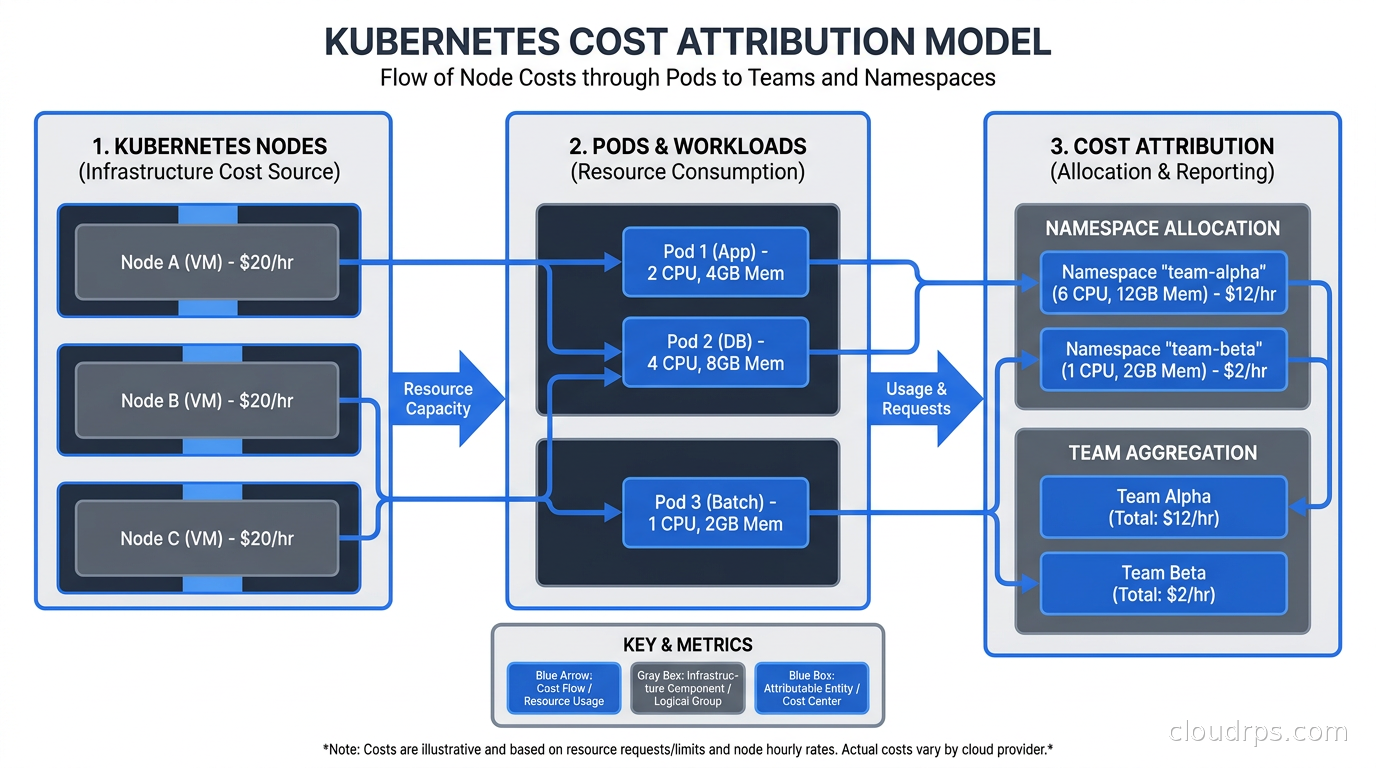
Kubernetes breaks this model in several ways. First, multiple pods from multiple teams share a node. You cannot simply allocate the full node cost to any one team. Second, Kubernetes resource requests (what you reserve) and actual usage (what you consume) are often dramatically different, and neither perfectly represents what you should be charged for. Third, cluster-level resources like the control plane, monitoring infrastructure, ingress controllers, and system daemonsets exist outside any team’s workload but consume real resources. Fourth, costs are dynamic: nodes spin up and down, pods migrate between nodes via the scheduler, and spot instances get reclaimed. The “cost” of running a pod for an hour is not static.
The naive approach, which I have seen at several large organizations, is to divide the monthly compute bill equally across all namespaces. This is mathematically simple and completely wrong. It penalizes teams running efficient, right-sized workloads and subsidizes teams that over-provision aggressively. It creates perverse incentives: if everyone pays the same regardless of usage, there is no reason to optimize.
The right approach requires a cost allocation model that reflects actual resource requests and usage, applied at the pod level, aggregated up to whatever organizational units you care about: namespace, team, label, deployment, or cost center.
For a broader picture of where Kubernetes costs fit in your overall cloud spend, understanding FinOps fundamentals is essential context. FinOps is the practice that gives cost visibility programs their organizational mandate. Without it, you are building dashboards that nobody acts on.
OpenCost: The CNCF Standard
OpenCost is a CNCF-graduated project that defines an open specification for Kubernetes cost attribution and provides a reference implementation. Before OpenCost, every cost visibility tool used its own proprietary model, and you could not compare apples to apples between vendors. OpenCost standardizes the math.
The core of the OpenCost specification is a cost allocation model that works as follows. For each pod, it looks at the resource requests (CPU cores and memory requested) and the actual node on which that pod ran. It takes the node’s hourly cost (pulled from cloud provider pricing APIs), divides it proportionally by the requested resources, and assigns that fractional cost to the pod. You can then aggregate pod costs by namespace, label, deployment, or any other dimension you choose.
The formula for CPU cost allocation looks roughly like this: pod_cpu_cost = (pod_cpu_request / node_cpu_capacity) * node_hourly_cost * cpu_cost_fraction. Memory follows the same pattern. The cost fractions for CPU and memory are configurable, typically defaulting to a split that reflects the actual pricing model of the cloud provider (on instance families where memory is proportionally more expensive, the model adjusts).
OpenCost installs as a Kubernetes deployment alongside Prometheus. It reads pod metadata and resource requests from the Kubernetes API, node pricing from cloud provider APIs (supporting AWS, GCP, Azure, and on-premises with custom pricing), and pushes metrics into Prometheus. From there, you can query the data in Grafana or expose it via the OpenCost API.
The fact that OpenCost exports to Prometheus is significant. If you are already running the Prometheus and Grafana observability stack, you can add Kubernetes cost data alongside your performance metrics. You start seeing cost on the same timeline as latency and error rate, which is how cost optimization conversations should happen.
What OpenCost does not do is provide a polished user interface, budget alerting, or integration with external billing systems. It is infrastructure-level tooling, not a product. It gives you the data; you build the experience on top.
Kubecost: The Product Built on OpenCost
Kubecost predates OpenCost. The company (acquired by Splunk in 2024) built the original cost allocation engine that became the basis for the OpenCost specification. They contribute the core allocation logic to the open source project and sell Kubecost, a commercial product that wraps that engine with a full UI, budget alerts, multi-cluster federation, Slack/PagerDuty notifications, savings recommendations, and enterprise features like RBAC and audit logs.
The free tier of Kubecost runs on a single cluster with 15 days of retention. It is genuinely useful and not a crippled demo version. For teams getting started with Kubernetes cost visibility, the free Kubecost tier is often the right entry point.
Installing Kubecost takes about five minutes via Helm:
helm repo add kubecost https://kubecost.github.io/cost-analyzer/
helm install kubecost kubecost/cost-analyzer \
  --namespace kubecost \
  --create-namespace \
  --set kubecostToken="<your-token>"
After installation, you get a dashboard that shows cluster costs broken down by namespace, deployment, controller, pod, and label. The default view is namespace-level, which is usually where organizations start. You can see which namespaces are responsible for what fraction of the monthly bill, broken down by CPU, memory, GPU, network, and storage.
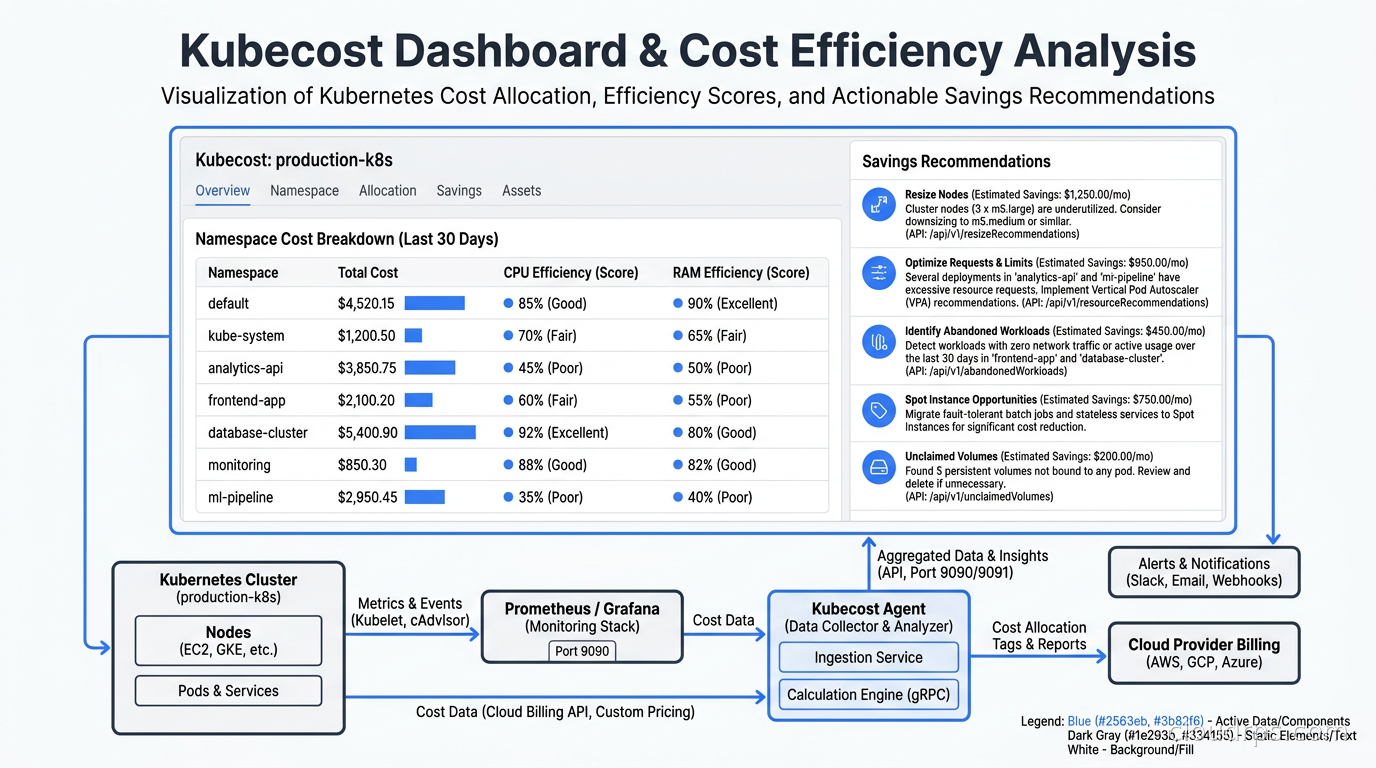
The feature I find most valuable is the efficiency score. Kubecost takes the ratio of actual usage to requested resources and gives each deployment an efficiency score. A deployment requesting 4 CPUs but consistently using 0.3 CPUs has an efficiency score around 7%. Kubecost surfaces these deployments in a “savings” view and tells you exactly how much you would save by right-sizing the resource requests.
This integrates naturally with Kubernetes autoscaling. The Vertical Pod Autoscaler (VPA) can automatically adjust resource requests based on actual usage, but you need visibility into which workloads are over-provisioned before you know where to apply VPA. Kubecost gives you that visibility; VPA gives you the automation to fix it.
For node-level cost reduction, combining Kubecost’s insights with Karpenter’s node provisioning is the right architecture. Karpenter provisions nodes of exactly the right size for the workloads scheduled on them. When Kubecost tells you that your requests are oversized and you right-size them, Karpenter’s bin-packing becomes more efficient and you provision fewer, smaller nodes.
Building a Cost Allocation Model That Actually Works
The technical installation is the easy part. The hard part is deciding what your cost allocation model should look like and getting teams to agree on it.
There are two primary approaches: allocation by namespace and allocation by label.
Namespace-based allocation is simple. If each team owns its namespaces, you have a direct mapping from namespace to team to cost. This works well for organizations that enforce namespace-per-team discipline. The problem is that many organizations do not. They have shared namespaces, platform namespaces owned by nobody specifically, and developers who deploy to whatever namespace is convenient.
Label-based allocation is more flexible and more accurate, but it requires discipline. You define a set of labels (team, service, environment, cost-center) and require that all deployments carry these labels. Kubecost and OpenCost can then allocate costs along any label dimension. The challenge is enforcement: if 30% of your deployments are missing the “team” label, 30% of your costs are unallocated.
I have seen organizations handle this with admission webhooks that reject deployments missing required labels. This is the right long-term approach, but it needs to be rolled out carefully: require labels on new workloads, give existing workloads a migration window, and have the platform team handle the exceptions rather than blocking deploys.
The third dimension in your allocation model is shared infrastructure. The Prometheus stack, the ingress controller, CoreDNS, kube-system daemonsets, and the cluster control plane costs (on managed Kubernetes services, the control plane has a fixed hourly fee) do not belong to any single team but consume real resources. Kubecost lets you define a shared cost allocation policy: distribute shared costs proportionally by usage, split evenly across namespaces, or assign them to a specific cost center labeled “platform.” Each approach has trade-offs. Proportional distribution is fairest but opaque. Even split is simple but penalizes small teams. The platform cost center approach is my preference: it makes the cost of shared infrastructure visible to whoever owns the platform budget, which creates accountability for keeping that footprint lean.
Showback vs. Chargeback: The Organizational Dimension
There is a distinction in FinOps between showback and chargeback that determines how your cost visibility program interacts with the rest of the organization.
Showback means: I will show you what your team is spending, but your engineering budget is not directly affected by that number. It is informational. Showback is a good starting point for organizations that do not yet have mature cost governance. It raises awareness without creating conflict.
Chargeback means: your engineering team’s budget is directly debited for the cloud costs attributable to your workloads. Chargeback creates real financial accountability. It also creates friction. Teams start asking hard questions about cost allocation methodology. Platform costs become contentious. You will spend time in meetings arguing about whether the Prometheus scrape interval should be charged to the data platform team.
My advice is to start with showback, run it for a quarter, let teams absorb the data and voluntarily optimize, then move to chargeback for teams that are clearly over-spending. The organizations that jump straight to chargeback without a showback phase tend to spend the first three months fixing their allocation model under political pressure rather than optimizing workloads.
Regardless of which model you choose, the cadence matters. Weekly cost reports sent to team leads via Slack integration create habit. Monthly reports get ignored until budget review season. The tools support both: Kubecost has Slack and email alerting, and you can set budget thresholds that trigger alerts when a namespace’s spend exceeds a configured percentage.
GPU Cost Attribution: A Special Kind of Problem
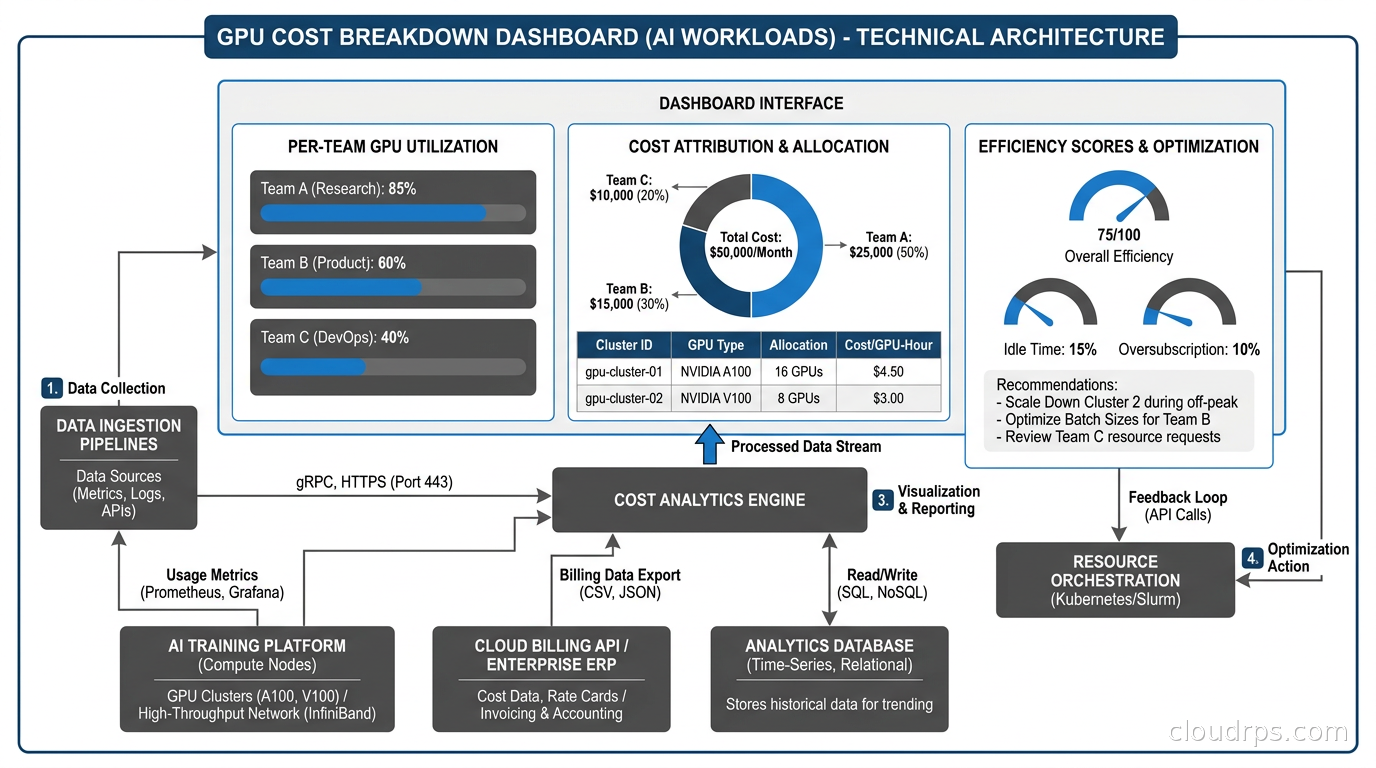
If you are running AI workloads on GPU nodes, cost attribution becomes significantly more complex and significantly more important. GPU nodes are expensive. An NVIDIA H100 node on AWS costs around $32 per hour. If that node is shared between multiple training jobs and inference services, you need to know precisely who is consuming what fraction of the GPU and charge accordingly.
The challenge is that GPU sharing in Kubernetes is not as mature as CPU sharing. By default, a GPU is allocated to a single container exclusively. You cannot request 0.5 GPUs the way you request 0.5 CPU cores. This means either a container gets the full GPU (and potentially underutilizes it) or you implement GPU sharing via time-slicing, NVIDIA MIG (Multi-Instance GPU), or CUDA MPS.
NVIDIA MIG, available on A100 and H100 GPUs, partitions a physical GPU into isolated instances with guaranteed memory and compute. Each MIG instance can be allocated to a separate container and has distinct resource boundaries. For multi-tenant inference serving, MIG is the right approach, and it integrates with Kubecost’s GPU cost tracking via device plugin metrics.
GPU time-slicing, where multiple containers share a GPU through time-multiplexing, is simpler to deploy but provides no isolation between workloads. Kubecost tracks GPU cost by pod in this model based on the GPU resource requests rather than actual GPU utilization (which is harder to measure at the container level). This means you are back to relying on accurate resource requests for correct cost attribution.
The Kubernetes Dynamic Resource Allocation (DRA) framework changes this picture significantly. DRA allows fine-grained GPU resource specification and structured parameters that can describe exactly which MIG slice or GPU instance a workload is requesting. As DRA matures and OpenCost adds DRA-aware cost attribution, GPU cost tracking will become more accurate. For now, the combination of MIG partitioning and Kubecost’s GPU tracking gets you to useful accuracy.
One operational lesson I learned the hard way: GPU nodes should be in dedicated node groups with distinct pricing applied in your cost model. If you are using spot instances for your GPU fleet, the on-demand price and the spot price are dramatically different. Kubecost’s default pricing uses on-demand rates unless you configure it to pull actual spot pricing from your cloud provider’s spot price history API. Always configure this. I have seen cost reports that overstated GPU spend by 60% because they used on-demand pricing on a cluster running primarily spot.
Practical Cost Governance Without Gatekeeping
The goal of cost visibility is behavior change, not bureaucracy. I have seen organizations implement Kubernetes cost tooling and then create a cost governance committee that reviews every deployment. This is the wrong outcome. You want engineers to make better cost decisions as part of their normal workflow, not add a new approval gate.
The pattern that works: integrate cost into the developer feedback loop. When a developer submits a pull request that changes resource requests or replica counts, a CI step should estimate the monthly cost change and post a comment. “This change increases estimated monthly cost for the payment-service deployment by $340.” That number, visible to the developer and reviewer during code review, changes the conversation. It does not block anything. It informs.
Kubecost has a GitHub Actions integration for exactly this use case. The OpenCost API is also straightforward to call from any CI system if you want to build a custom integration.
For platform engineering teams building internal developer platforms, surfacing cost data via your developer portal is high-value work. Backstage has a Kubecost plugin. If you are running Port or another IDP, the Kubecost API integrates cleanly via the OpenCost spec. Developers who can see their service’s cost directly in the same interface where they manage deployments and check SLOs develop a much healthier relationship with infrastructure spend.
Namespace budget limits are a useful enforcement mechanism for egregious cases. Kubernetes itself does not have native cost-based resource quotas, but Kubecost Enterprise lets you set a monthly spend limit per namespace and alert (or, optionally, trigger remediation) when the limit is exceeded. For dev and staging environments, where over-provisioned workloads are common and often forgotten, hard budget limits are appropriate. For production namespaces, I prefer soft alerts rather than automated remediation: the last thing you want is an automated system scaling down production because an ML job ran hot one week.
Also worth monitoring separately: cloud egress costs. Kubecost tracks network costs within the cluster (cross-zone traffic, service-to-service bandwidth), but egress to the internet is harder to attribute at the pod level because cloud providers charge at the NAT Gateway or load balancer level, not per-container. OpenCost is working on improved network cost attribution, but for now, egress costs are best tracked at the namespace level using VPC flow logs correlated with Kubernetes pod IP ranges.
The War Story: $80k in a Weekend
I want to share a specific incident that illustrates why this matters. At a scale-up I worked with around 2019, a data engineering team was running large Spark jobs on Kubernetes. They had properly sized their executors for their standard workload. One Friday afternoon, someone kicked off an exploratory analysis job against the full historical dataset rather than the sampled training set. The job requested 200 executor pods. Each executor requested 8 CPUs and 32Gi of memory. Karpenter, in its predecessor form, dutifully provisioned enough nodes.
By Monday morning, the job had finished. The nodes had not yet scaled down (autoscaler cooldown periods). The finance team flagged the bill: $80,000 of unexpected compute in 60 hours. The Spark job itself cost about $12,000. The rest was idle capacity sitting around because of misconfigured scale-down settings.
With Kubecost (which they installed after this incident), this would have appeared as a bright red anomaly in the namespace cost graph by Saturday morning. With budget alerting, the team lead would have gotten a Slack message when the namespace spend exceeded its weekly budget threshold. With a CI cost estimate gate, the data engineer running the job would have seen the projected cost before submitting it to a production cluster.
None of those interventions require blocking anyone or creating approval committees. They create visibility, and visibility drives behavior.
Recommendations
If you are just getting started: install the free Kubecost tier on your main cluster. Spend two weeks looking at the data. Identify your top ten most expensive namespaces. Look at their efficiency scores. Find the three workloads with the lowest efficiency and the highest cost. That is your first right-sizing project.
If you have multiple clusters: evaluate Kubecost Enterprise or the multi-cluster federation in OpenCost. Managing cost visibility across ten clusters independently does not scale. You need a unified view. The broader challenge of managing configuration, policies, and workloads across a cluster fleet is covered in the Kubernetes multi-cluster management guide, which addresses how Karmada and Fleet integrate with cost observability tooling.
If you are running GPU workloads: configure GPU pricing explicitly, enforce MIG partitioning or time-slicing consistently, and build weekly GPU cost reports into your AI infrastructure review cadence. GPU costs compound fast enough that monthly reviews are too infrequent.
If you are building a platform team: integrate cost data into your IDP and CI pipelines before you make cost visibility mandatory. Let teams see the data for a quarter, let them optimize voluntarily, and you will have far less resistance when you eventually move to chargeback.
For organizations that have already implemented GitOps workflows with ArgoCD or Flux, cost estimation can slot naturally into the GitOps review process. The same pull request that triggers an ArgoCD diff can trigger a Kubecost cost delta estimate. This is the right architecture: cost is treated like any other infrastructure property that gets reviewed before deployment.
The fundamental insight after twenty years of working on this problem is that Kubernetes cost visibility is not a tooling problem. OpenCost and Kubecost are mature, well-documented, and genuinely useful. The problem is organizational: who is responsible for what, what behavior do you want to incentivize, and how do you make cost a first-class concern in engineering culture without making it a bureaucratic burden. The tools give you the data. What you do with it is up to you.
Get Cloud Architecture Insights
Practical deep dives on infrastructure, security, and scaling. No spam, no fluff.
By subscribing, you agree to receive emails. Unsubscribe anytime.