
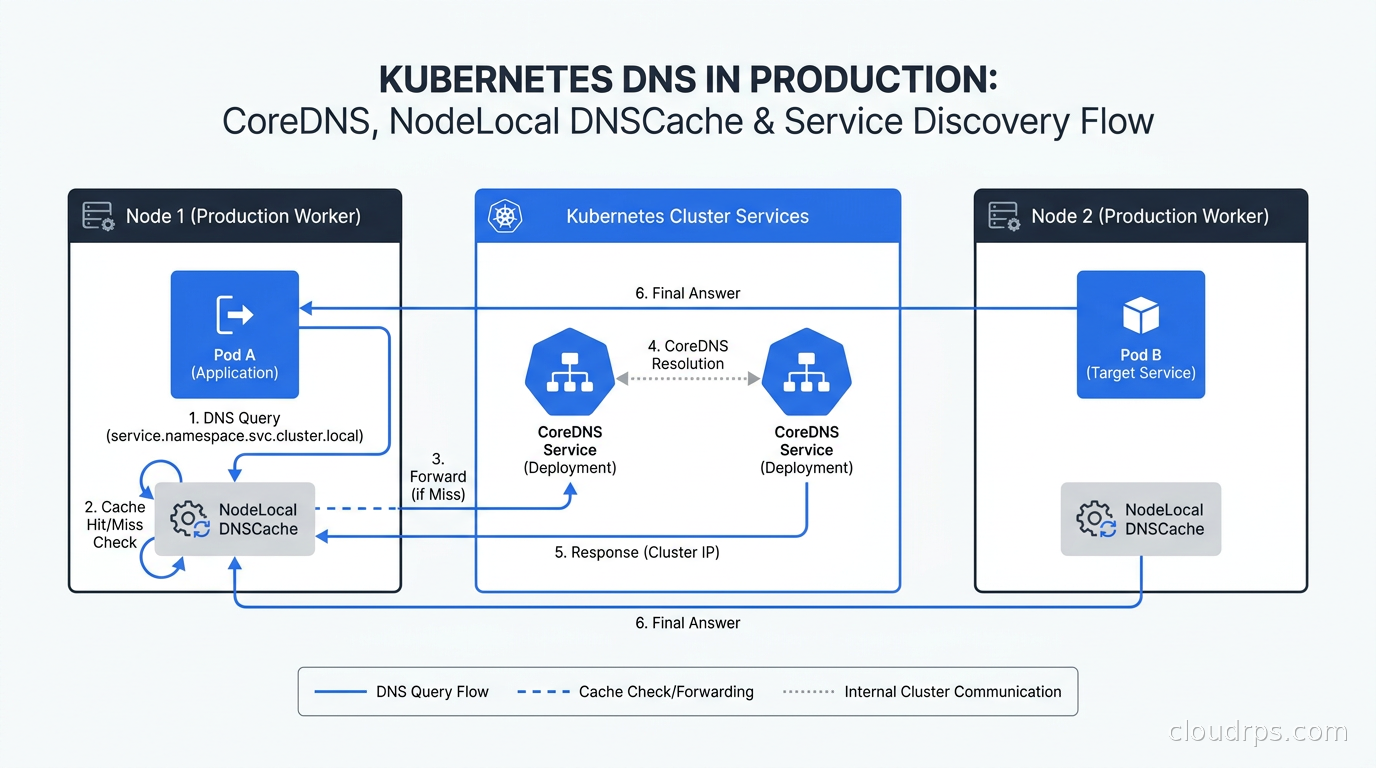
DNS is the plumbing nobody thinks about until the pipes burst. In Kubernetes, that plumbing is CoreDNS, and when it struggles, your symptoms look like everything except a DNS problem: intermittent timeouts, slow API calls, connection refused errors, pods that work fine for ten minutes then start failing. I have spent twenty years designing cloud infrastructure and I can tell you that DNS-related performance degradation is one of the most commonly misdiagnosed production issues I see teams wrestle with, precisely because the failures are ambiguous and the root cause is invisible unless you know exactly where to look.
This is the guide I wish existed when I first ran into CoreDNS exhaustion at scale. I will explain how Kubernetes DNS actually works, why the default settings quietly multiply your query volume, when NodeLocal DNSCache is the right answer, and how to debug resolution failures before they become incidents.
How Kubernetes DNS Actually Works
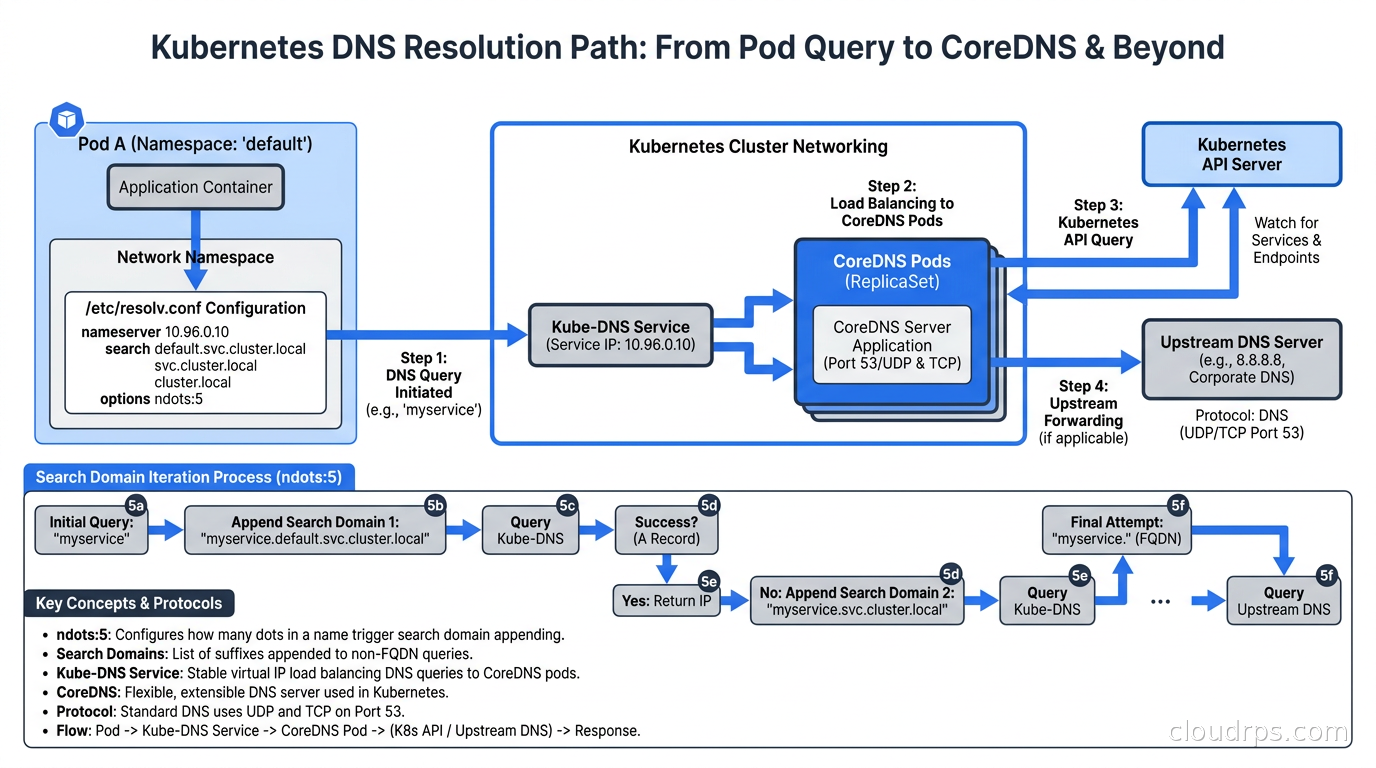
Every pod in a Kubernetes cluster gets a /etc/resolv.conf injected by kubelet when the pod starts. In a standard cluster it looks something like this:
nameserver 10.96.0.10
search default.svc.cluster.local svc.cluster.local cluster.local
options ndots:5
That nameserver IP is the ClusterIP of the kube-dns service, which routes to your CoreDNS pods. The search line defines domain suffixes that get appended to unqualified names. And ndots:5 is the option that causes the most silent damage.
When your application code calls getaddrinfo("payments-service"), the resolver looks at the name, counts the dots (zero in this case), and because that count is below ndots:5, it treats the name as unqualified. The resolver then tries each search domain in sequence before trying the name as-is. That means the following DNS queries hit CoreDNS before the lookup succeeds:
payments-service.default.svc.cluster.localpayments-service.svc.cluster.localpayments-service.cluster.localpayments-service.(the bare name)
If your application is resolving an external hostname like api.stripe.com, and that name has only two dots (below the ndots:5 threshold), the resolver runs through all the search domains before trying the external name. One logical application lookup becomes five or six wire queries to CoreDNS. At low traffic volumes this is invisible. At scale it means CoreDNS is fielding many times more queries than your application actually needs.
A Netdata guide on the subject describes how an observed 50,000 QPS hitting CoreDNS in production can represent a fraction of that in actual application-level lookups, with the rest being ndots-induced search domain expansions. I have seen this pattern firsthand. A team I worked with watched their CoreDNS pods peg CPU and saw DNS latency climb past 100ms during peak traffic, and the fix was not adding more CoreDNS replicas. It was understanding why the query volume was so high in the first place.
CoreDNS Architecture and the Corefile
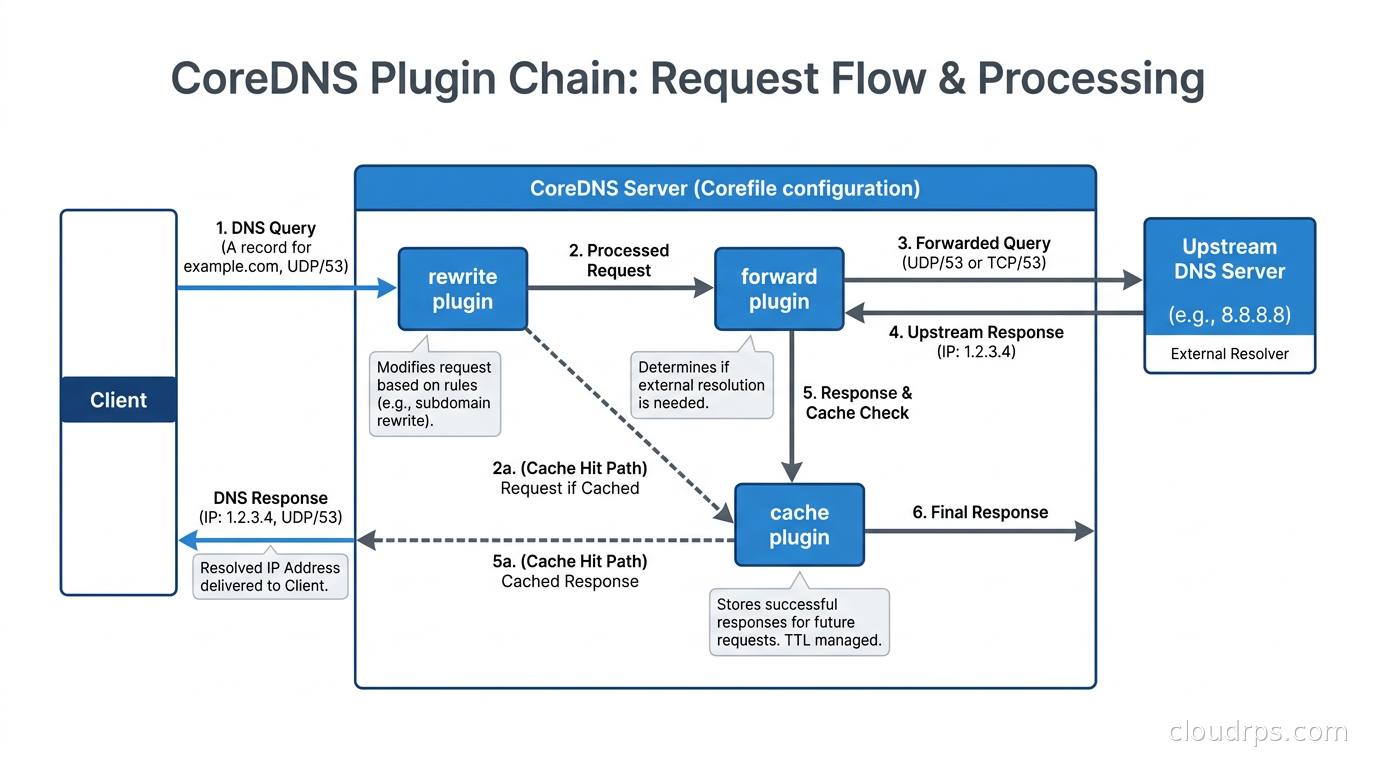
CoreDNS replaced kube-dns in Kubernetes 1.11 and has been the default ever since. Its architecture is a plugin chain: incoming DNS requests flow through a sequence of plugins defined in the Corefile ConfigMap in the kube-system namespace. Each plugin can inspect or modify the query, serve a response, or pass it downstream.
A typical cluster Corefile looks like this:
.:53 {
    errors
    health {
        lameduck 5s
    }
    ready
    kubernetes cluster.local in-addr.arpa ip6.arpa {
        pods insecure
        fallthrough in-addr.arpa ip6.arpa
        ttl 30
    }
    prometheus :9153
    forward . /etc/resolv.conf {
        max_concurrent 1000
    }
    cache 30
    loop
    reload
    loadbalance
}
The kubernetes plugin handles all queries ending in cluster.local, serving them from the cluster’s service and endpoint data. The forward plugin sends everything else upstream to the node’s DNS resolver. The cache plugin stores responses to reduce upstream query load and upstream latency.
Understanding this plugin chain is essential for diagnosing problems. If CoreDNS is logging errors from the forward plugin, your upstream DNS resolver is the problem, not CoreDNS itself. If the kubernetes plugin is slow, it might be a sign that the cluster has so many services and endpoints that the in-memory index is under pressure.
The reload plugin is worth calling out specifically: it watches the Corefile ConfigMap and reloads CoreDNS configuration without a restart when it changes. This is a production-friendly behavior, but it means you need to watch for reload errors in the CoreDNS logs after ConfigMap changes. A malformed Corefile silently fails to load, leaving the old config in place, and you may not notice until you check the logs.
The NodeLocal DNSCache Solution
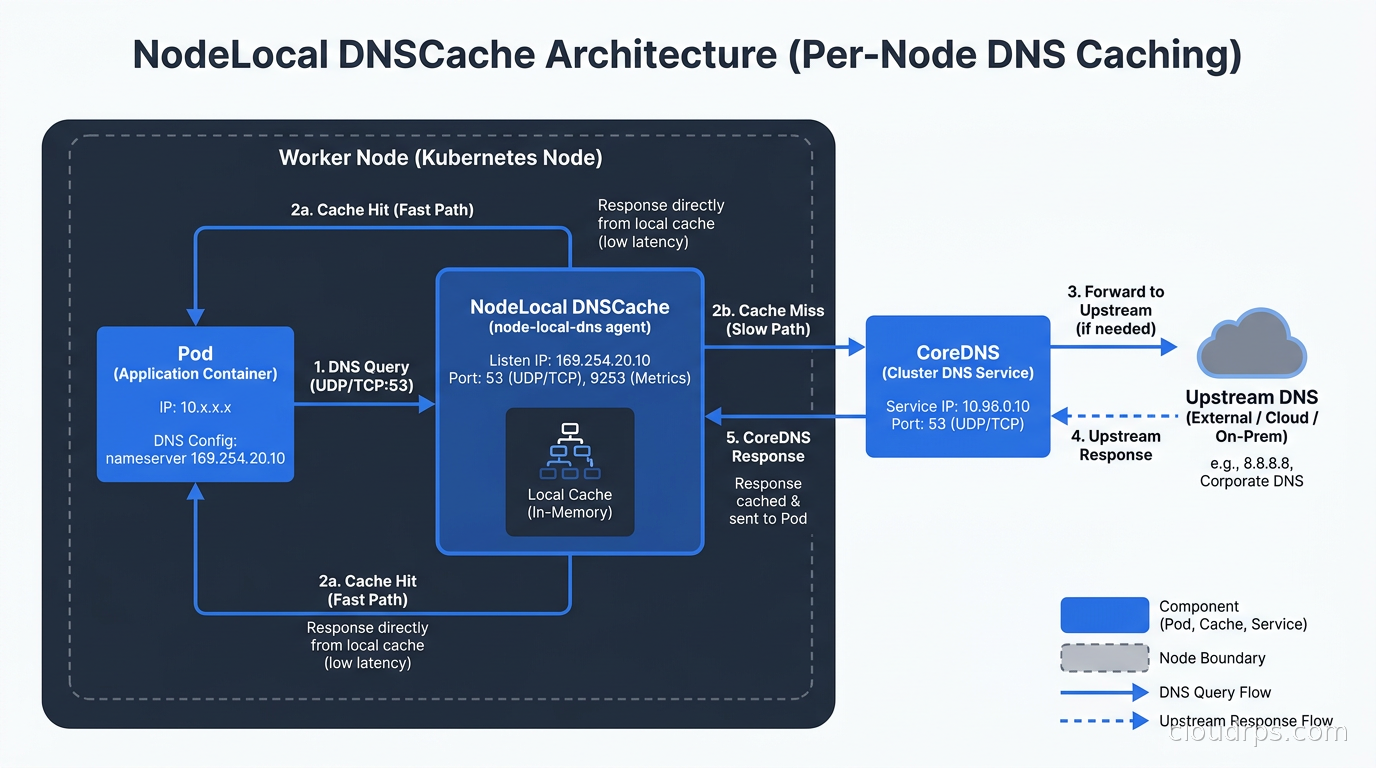
NodeLocal DNSCache deploys a DaemonSet that runs a DNS cache on every node. Instead of all DNS queries going through the kube-dns ClusterIP service, pods on a node send queries to a link-local IP address (169.254.20.10 is the default) on that same node. The local cache handles responses for frequently queried names and only forwards cache misses to CoreDNS.
This solves several problems at once.
First, it eliminates the Linux conntrack issue that causes intermittent DNS failures in iptables mode. When two DNS queries (the A and AAAA record lookups that glibc fires in parallel) arrive at the same CoreDNS pod through DNAT, a race in the conntrack table can cause one of the responses to be silently dropped. This is a documented kernel behavior, not a bug in CoreDNS. NodeLocal DNSCache avoids DNAT entirely by using a direct node-local address, eliminating the race condition.
Second, in IPVS mode, kubelet updates the kube-proxy IPVS rules when CoreDNS pods restart or scale. Until the rules propagate, DNS queries can fail. NodeLocal DNSCache bypasses the kube-proxy IPVS rules entirely for DNS traffic, making CoreDNS restart and scaling events less impactful.
Third, node-local caching reduces CoreDNS load and improves latency for cached responses. The same queries from multiple pods on the same node are answered from local cache rather than forwarded.
There is one operational requirement that teams frequently miss: after you deploy NodeLocal DNSCache, new pods pick up the node-local DNS cache IP from their resolv.conf automatically, but you need to ensure your existing pods are restarted to pick up the new configuration. In clusters with long-lived pods, this is a common source of confusion after NodeLocal DNSCache is deployed.
Tuning ndots: The Most Impactful Change You Can Make
The fastest way to reduce DNS load in a Kubernetes cluster is to set a lower ndots value where it is safe to do so. The default of 5 was chosen to preserve backwards compatibility with DNS search domain behavior common in legacy applications. For applications that use fully qualified service names or external APIs, it is too high.
You can override ndots at the pod level in your pod spec:
spec:
  dnsConfig:
    options:
      - name: ndots
        value: "2"
With ndots:2, an external hostname like api.stripe.com (two dots) is treated as fully qualified and sent directly to the upstream resolver without search domain expansion. Internal service calls using short names (like payments-service) still work because the search domain list is still present; the resolver just tries the short name last instead of running the full expansion.
The important caveat: test this change in staging before applying it broadly. Some applications rely on search domain expansion in ways that are not obvious. An application that calls a service by the name db relies on the search domains resolving db.default.svc.cluster.local. With ndots:2, if the application writes the lookup as db.default (two dots), it gets treated as fully qualified and fails. Most modern applications using Kubernetes service names work correctly with ndots:2 or even ndots:1, but validate for your workloads.
An alternative for external names is to use trailing-dot FQDNs in your application configuration. A hostname like api.stripe.com. (note the trailing dot) is always treated as fully qualified regardless of the ndots setting, skipping all search domain expansion. This is the most targeted fix when you have a specific external hostname that you know is being over-queried.
For platform teams managing applications across many teams, the pragmatic approach is to set ndots:2 in your pod template defaults as part of your standard pod spec, with documentation explaining why, and flag it as a known consideration for teams migrating legacy workloads from other platforms.
CoreDNS Scaling and Resource Allocation
CoreDNS runs as a Deployment, typically with two replicas by default. In clusters with dozens of nodes and hundreds of services, those two replicas are often undersized by the time teams notice a problem.
The most common mistake I see is treating CoreDNS as a set-and-forget component and only looking at it after production incidents. The right approach is to monitor CoreDNS from day one. CoreDNS exposes Prometheus metrics on port 9153, and the key metrics to watch are:
coredns_dns_requests_total: total queries received, broken down by type and rcodecoredns_dns_request_duration_seconds: query latency histogram (alert on p99 above a threshold your application can tolerate)coredns_forward_requests_totalandcoredns_forward_request_duration_seconds: upstream forwarding performancecoredns_cache_hits_totalvscoredns_cache_misses_total: your cache hit rate tells you how effective the local cache is
You can monitor CoreDNS through any Prometheus-compatible observability stack. If you are running the Prometheus, Loki, Grafana, and Tempo observability stack, the CoreDNS Grafana dashboard is available from the Grafana dashboard registry and gives you these metrics in a ready-made view.
For autoscaling CoreDNS, the recommended approach is the coredns-autoscaler addon based on cluster-proportional autoscaler. It scales CoreDNS replicas based on the number of cluster nodes and cores, using a formula like one replica per 256MB of schedulable memory or one replica per 16 cores, whichever is larger. This is a more principled approach than manually bumping the replica count when things start getting slow.
Resource requests and limits deserve attention too. CoreDNS defaults are conservative. In a large cluster, you may need to increase the memory limit to prevent OOM kills during endpoint churn (when many pods are starting or stopping and the kubernetes plugin is updating its index). The Kubernetes resource management guide covers QoS classes and why setting appropriate requests and limits for CoreDNS matters for stability during node pressure events.
Debugging DNS Failures in Production
When pods are reporting DNS failures, here is the diagnostic sequence I follow.
Start by confirming the failure is DNS and not something else:
kubectl exec -it <pod> -- nslookup kubernetes.default.svc.cluster.local
kubectl exec -it <pod> -- nslookup google.com
The first lookup tests internal cluster DNS. The second tests external forwarding. If only external lookups fail, your forward plugin’s upstream resolver is the problem. If both fail, CoreDNS itself is the issue.
Check CoreDNS pod health and resource usage:
kubectl -n kube-system get pods -l k8s-app=kube-dns
kubectl -n kube-system top pods -l k8s-app=kube-dns
Look at CoreDNS logs for errors. The errors plugin logs failed queries, and the output often tells you exactly which upstream server is timing out or which record type is failing:
kubectl -n kube-system logs -l k8s-app=kube-dns --tail=100
Check what the pod’s resolv.conf actually contains, as it may not match what you expect:
kubectl exec -it <pod> -- cat /etc/resolv.conf
If you are running NodeLocal DNSCache, verify that the node-local cache is reachable from the pod:
kubectl exec -it <pod> -- nslookup kubernetes.default.svc.cluster.local 169.254.20.10
If that works but the default resolver does not, your pod may have been scheduled before NodeLocal DNSCache was deployed on that node and is still using the old kube-dns ClusterIP. A pod restart will pick up the updated resolv.conf.
For intermittent failures that are hard to reproduce, capture DNS query timing from within a pod. The dig command with the +stats flag shows query latency:
kubectl exec -it <pod> -- dig +stats kubernetes.default.svc.cluster.local
Repeated timeouts in the ;;Query time: output while your CoreDNS pods look healthy often point to the conntrack UDP race issue. If you are on iptables mode and seeing this pattern, NodeLocal DNSCache is the fix.
Service Discovery Patterns and DNS Considerations
How your applications reference services affects DNS behavior significantly. The four patterns, in order of DNS efficiency:
Short name (most DNS queries): payments-service. This relies on search domain expansion and generates the most queries per lookup. Fine for single-namespace applications, fragile across namespaces.
Namespace-qualified name: payments-service.payments. Fewer search domain expansions, works reliably across namespaces.
Cluster-local FQDN: payments-service.payments.svc.cluster.local. No search domain expansion. One query, one response. Slightly more verbose but the most efficient and explicit option.
FQDN with trailing dot: payments-service.payments.svc.cluster.local.. Unambiguously fully qualified. Use this in environments with custom ndots settings where you want deterministic behavior.
For service meshes, the DNS picture changes. When you are running Istio or a sidecar-based mesh, traffic interception happens at the sidecar level, and your DNS resolution still goes through CoreDNS first. With Istio’s ambient mesh mode, the DNS path is largely the same since ambient mesh does not rewrite DNS. Some service meshes add DNS proxies that intercept and resolve service hostnames locally, which reduces CoreDNS load further. Check your mesh documentation for whether it modifies DNS resolution.
Cilium’s cluster mesh feature adds DNS-based service discovery across clusters, using CoreDNS zones for cross-cluster service resolution. If you are running multi-cluster with Cilium, understand how it configures CoreDNS stubs for remote cluster zones, because misconfiguration here is a common source of cross-cluster connectivity failures.
CoreDNS Customization for Production
The Corefile has several customizations that are worth knowing.
Custom upstream forwarders: If your cluster runs in a VPC with a private DNS server for on-premises name resolution, you can configure specific zones to forward to your private DNS:
.:53 {
    forward . 10.0.0.2  # Your VPC DNS
    ...
}

internal.corp.example.com:53 {
    forward . 10.1.0.10  # On-prem DNS
    errors
    cache 30
}
This is the right way to handle hybrid cloud DNS, and understanding it is essential if your cluster pods need to reach services running outside the cluster. The AWS Direct Connect and hybrid cloud connectivity guide covers the network layer; the Corefile configuration above handles the DNS layer.
The autopath plugin: This plugin rewrites search domain expansion queries server-side instead of having the client send multiple queries. When a pod queries payments-service, instead of returning NXDOMAIN for each failed search domain expansion (causing the client to send the next query), CoreDNS answers with the correct cluster.local FQDN response immediately. This can reduce query volume significantly in clusters with many short-name lookups. Enable it with care: it changes CoreDNS response behavior and can interact unexpectedly with caching.
Stub zones for external delegation: If you have a split-horizon DNS setup where some external names have different resolutions inside the cluster, you can configure stub zones:
external.example.com:53 {
    forward . 10.2.0.5
    errors
    cache 30
}
This sends queries for external.example.com to a specific internal resolver rather than the cluster’s upstream, which is useful for service names that mean different things inside and outside the VPC.
What Most Teams Get Wrong
After twenty years of running infrastructure, here is what I see teams consistently miss with Kubernetes DNS.
They never look at CoreDNS metrics until something breaks. The prometheus endpoint on port 9153 is right there. The latency histogram and cache miss rate tell you about problems building for weeks before they affect users. Wire this up the first time you stand up a cluster, not after the first DNS outage.
They undersize CoreDNS and scale horizontally to fix problems that are actually ndots-related. More CoreDNS pods do not help if the query amplification problem is not addressed. Diagnose before scaling.
They deploy NodeLocal DNSCache and forget to restart long-lived pods. Old pods keep sending queries to the kube-dns ClusterIP instead of the node-local cache, which means you do not get the full benefit and your conntrack mitigation is incomplete.
They use long-name service FQDNs inconsistently. Some microservices call payments-service, others call payments-service.payments.svc.cluster.local. The inconsistency makes DNS debugging harder because the query patterns are unpredictable and the search domain expansion behavior varies.
For platform engineering teams building internal developer platforms, the right call is to standardize service naming conventions in your golden path templates. Document whether teams should use short names or FQDNs, and include the appropriate dnsConfig stanza in your pod spec template. These decisions made once at the platform level save each application team from rediscovering the same ndots behavior independently.
The Practical Checklist
For a production Kubernetes cluster running at any meaningful scale, here is what I recommend:
Deploy NodeLocal DNSCache. It eliminates the conntrack UDP race, reduces CoreDNS load, and improves latency. The operational overhead is low and the reliability improvement is real.
Set
ndots:2in your default pod spec template, test it thoroughly in staging, and document the exceptions for legacy applications that need the default behavior.Instrument CoreDNS with Prometheus and alert on p99 latency above your SLA threshold and on error rate increases.
Enable cluster-proportional autoscaler for CoreDNS so replica count scales with cluster growth automatically.
Standardize service reference patterns across your organization. Pick FQDNs or short names, document the choice, and enforce it through admission policies or your internal developer platform.
Configure custom upstream forwarders if you have hybrid connectivity requirements. Do not rely on the default forwarding behavior to “just work” with on-premises DNS.
DNS feels like infrastructure plumbing that should work without thought, and in a small cluster it does. In a large cluster with hundreds of services and thousands of pods, CoreDNS is a critical shared resource that deserves the same operational rigor as any other production database. The difference between a cluster that hums along and one that generates mysterious timeout incidents at 2 AM is usually a few Corefile lines, one DaemonSet, and the discipline to monitor DNS from day one.
For deeper Kubernetes networking topics, the Kubernetes CNI plugins and network policies guide covers the broader networking layer that CoreDNS sits within, and the eBPF networking and observability guide explains the kernel-level visibility that helps when you need to trace exactly where DNS queries are going.
Get Cloud Architecture Insights
Practical deep dives on infrastructure, security, and scaling. No spam, no fluff.
By subscribing, you agree to receive emails. Unsubscribe anytime.