In twenty years of managing infrastructure, few things have generated more 3am pages than misconfigured Kubernetes resource management. The pattern is always the same: a team ships a service, the pod runs fine in staging, and then production starts throwing OOMKilled errors or response times spike because the process is getting CPU throttled. By the time I’m involved, the team has spent hours staring at dashboards trying to figure out why a service that “works fine” keeps falling over. Nobody suspects the resource configuration because that part was done during the initial Helm chart setup, months ago, by someone who has since moved to another team.
The root cause is almost always the same: requests and limits were set wrong, set too conservatively out of fear, copied from a StackOverflow snippet, or not set at all. I have audited clusters where 45% of allocated CPU sat unused because every team padded their requests “just to be safe,” while on a neighboring node, a pod with no memory limits was silently consuming 12Gi and triggering evictions across the entire node. Both problems trace back to the same fundamental misunderstanding of what requests and limits actually do at runtime.
This guide covers the mechanics in enough depth that you can diagnose and fix these problems yourself, configure LimitRange and ResourceQuota to prevent them at the namespace level, and build a right-sizing workflow that keeps your cluster healthy as your workloads evolve.
What Requests and Limits Actually Do
The terminology sounds simple, but the mechanics trip up even experienced engineers because requests and limits control two completely different things at two different layers.
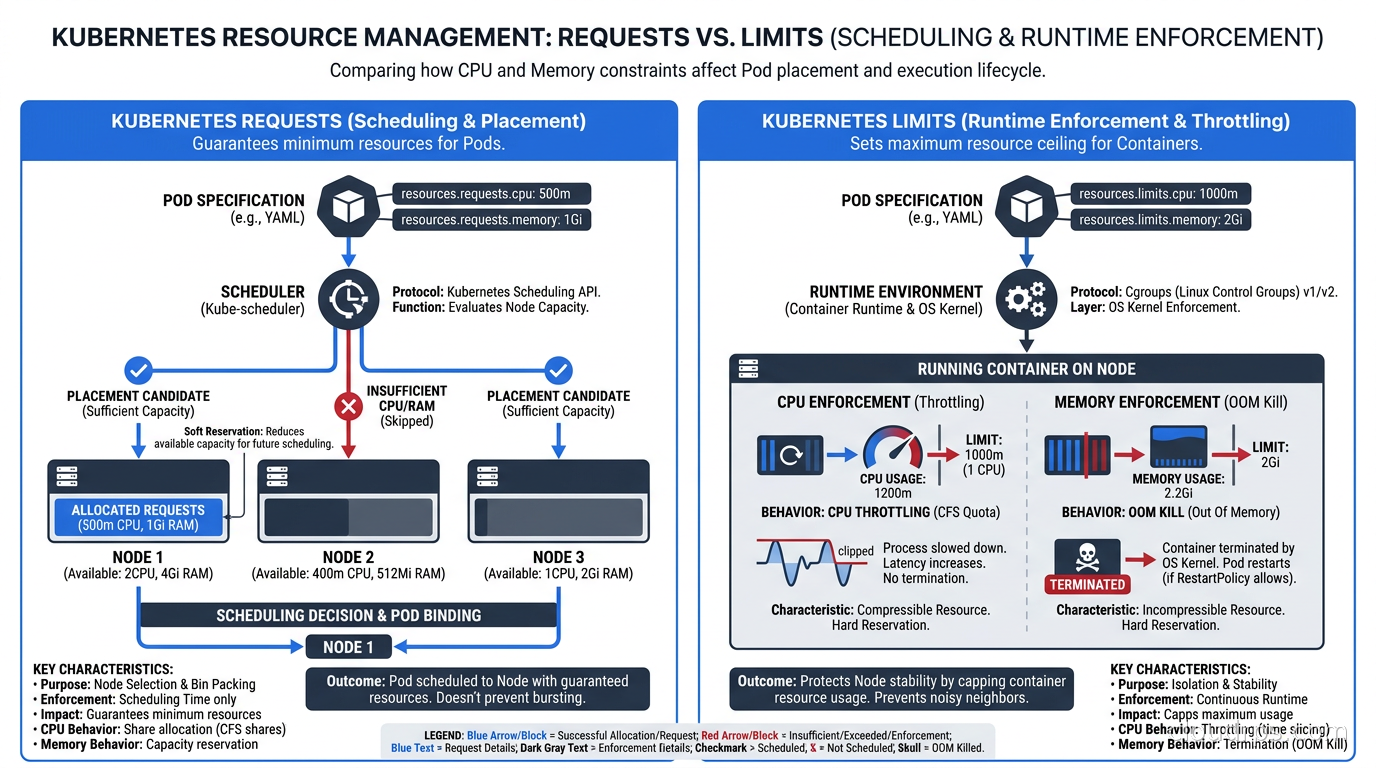
Requests are scheduling hints. They tell the Kubernetes scheduler how much CPU and memory to reserve when placing a pod on a node. The scheduler looks at each node’s total allocatable capacity, subtracts what existing pods have requested, and only considers nodes with enough remaining capacity for the new pod’s request. The container can use more than its request at runtime, but it cannot be placed on a node that does not have at least the requested amount available.
Limits are runtime enforcement constraints. CPU limits throttle the process when it tries to use more than the limit. Memory limits kill the process when it exceeds the limit. These operate entirely independently of the scheduling decision.
This asymmetry is where most misconfigurations begin. A pod scheduled based on a 500m CPU request can run on a node that has 500m of unallocated capacity, but if that pod has a 4000m CPU limit, it can consume up to 4 vCPUs at runtime if the node has spare capacity. That is intentional overcommitment, and it is how you achieve high cluster utilization. The problem is when teams do not understand this and assume the request is also the cap.
CPU: Shares, Throttling, and the CFS Problem
CPU in Kubernetes is measured in millicores. 1000m equals one vCPU. The request value maps to Linux CFS (Completely Fair Scheduler) CPU shares. When two pods compete for CPU on the same node, their shares determine how the CPU time is divided. A pod with 1000m request gets twice as much CPU time as one with 500m request when the node is saturated. When the node is not saturated, both pods can run freely up to their limits.
CPU limits are enforced via CFS bandwidth quotas, and this is the source of the most common performance problem I see in production Kubernetes clusters: CPU throttling. If you set a limit of 500m, the kernel allocates your container a quota of 50ms of CPU time per 100ms scheduling period. When the container exhausts its 50ms, the kernel pauses it for the rest of that window, regardless of whether other CPUs on the node are idle.
For latency-sensitive services, this is brutal. I have watched Java applications trigger a full garbage collection cycle, with the GC trying to consume 100% CPU for 300ms, but CFS allows only 50ms per period. The GC gets paused repeatedly across multiple 100ms windows, and the entire application stalls for far longer than the GC itself takes on an unconstrained machine. Response time percentiles blow up. The service looks broken. Nothing in the application logs explains it.
The fix is to either set CPU limits significantly higher than your p99 actual CPU usage, or to leave CPU limits unset for latency-sensitive services. Leaving limits unset allows the process to burst freely using available node capacity while still preventing over-scheduling through the request value. This is a legitimate production pattern, though it requires trust that your namespaces have ResourceQuota to prevent runaway consumption, which I cover below.
A practical note on multi-container pods: if you run Istio sidecars, Datadog agents, Fluent Bit, or any other sidecar alongside your main container, each container has its own requests and limits. The pod’s effective resource footprint is the sum. For a service with a 500m/2000m CPU request/limit and an Istio sidecar adding 100m/1000m, your pod needs 600m of unallocated CPU on a node to be scheduled, and the sidecar’s limit can consume CPU budget your main container needed during a traffic spike. This is why I always profile sidecar overhead separately and account for it in capacity planning.
Memory: The OOM Killer and Page Cache Accounting
Memory enforcement is categorical where CPU throttling is graduated. When a container exceeds its memory limit, the kernel OOM Killer terminates it immediately. You will see exit code 137 and OOMKilled: true in kubectl describe pod. The pod restarts if its restart policy is Always or OnFailure, starts accumulating CrashLoopBackOff delay, and pages someone if you have alerting configured correctly.
Memory limits and requests work through cgroup memory.limit_in_bytes. When a process tries to allocate memory beyond the limit, the allocation fails, and if the OOM killer cannot free enough by killing other processes in the cgroup, it kills the main process. Unlike CPU throttling, there is no gradual degradation warning you that you are approaching the limit.
The complication most teams hit is Linux page cache accounting. When a container reads a file, the kernel caches that file’s contents in memory, and that cached memory counts against the container’s limit under container_memory_working_set_bytes. The kernel will reclaim page cache under memory pressure, but if your container’s limit is tight, the page cache from reading a large configuration file or processing a log export can push you over the limit before the kernel has a chance to reclaim it. I have seen applications with 256Mi limits get OOMKilled processing 50MB CSV files because the page cache held the entire file in memory while the CSV parser was still running.
For JVM workloads specifically, the trap is setting the memory limit to match -Xmx. The JVM uses memory beyond the heap: metaspace, native thread stacks, JIT code cache, direct byte buffers, and GC overhead. A JVM set to -Xmx 2g can easily consume 3.5Gi of total process memory under load. My baseline is to set the container memory limit to -Xmx multiplied by 1.75, and increase from there if OOMKilled events appear in the first two weeks of production.
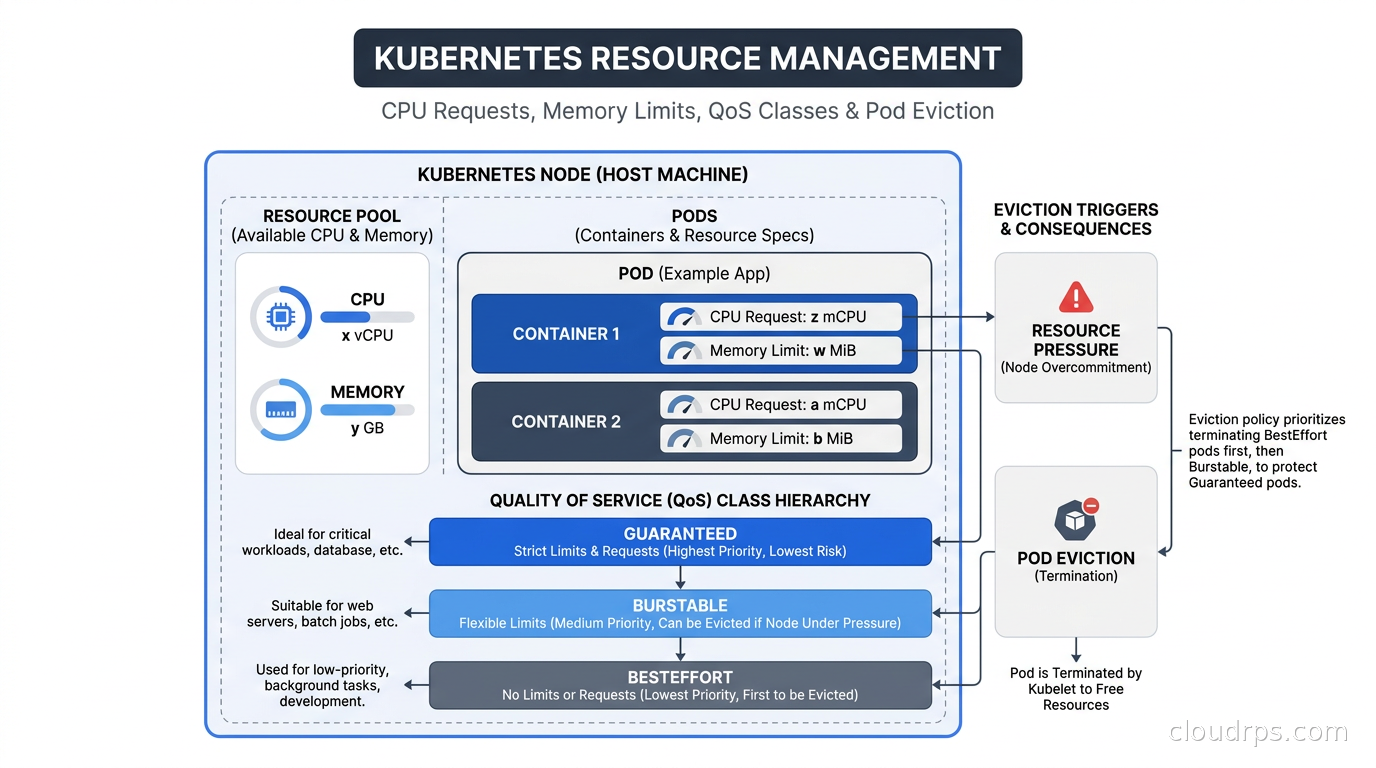
QoS Classes and the Eviction Hierarchy
Kubernetes assigns every pod to one of three Quality of Service classes at admission time. This class determines which pods get evicted first when a node runs low on memory.
Guaranteed: Every container in the pod has both CPU and memory requests AND limits set, and the request value equals the limit value. These pods are the hardest to evict. The scheduler knows exactly what they need, they will not burst beyond that, and Kubernetes treats them as critical workloads.
Burstable: At least one container has a CPU or memory request or limit set, but the containers do not all have equal requests and limits. Most production pods fall into this class. They can burst above their requests when the node has capacity, but they may be evicted when the node is under memory pressure, with the most-over-their-request pods evicted first.
BestEffort: No resource requests or limits are set on any container in the pod. These are evicted first, before any Guaranteed or Burstable pod, and they are evicted before the kubelet even triggers the soft eviction threshold. Never run production workloads as BestEffort.
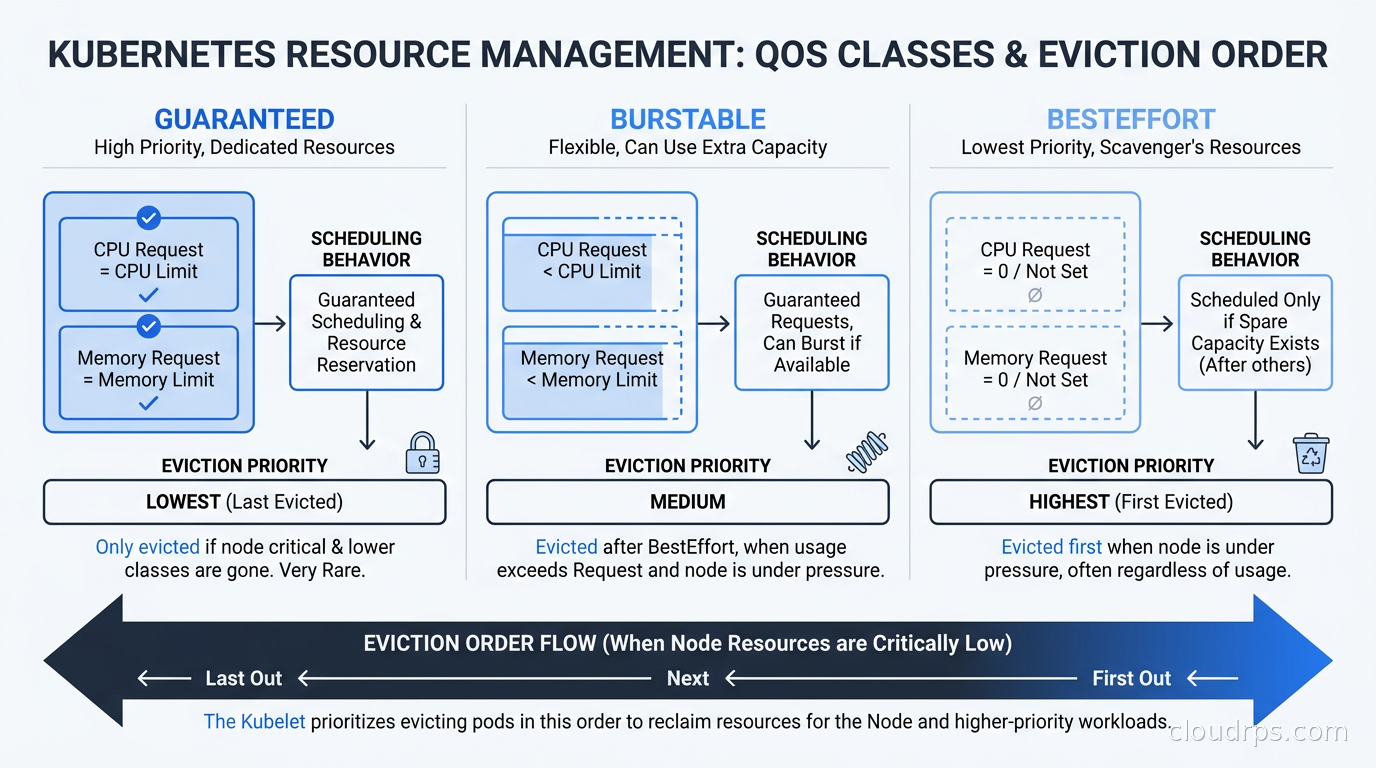
The eviction order under node memory pressure is BestEffort first, then Burstable pods ordered by the ratio of their actual memory usage to their memory request (most over-committed first), then Guaranteed pods last. In practice, Guaranteed pods are almost never evicted unless the node itself is critically out of memory, which typically means something has gone badly wrong with a BestEffort or Burstable workload consuming all available memory.
For stateless services, eviction is an annoyance, a brief period of reduced capacity while the pod reschedules elsewhere. For stateful workloads, eviction can mean data loss or a complex recovery sequence. This is one of the reasons running databases on Kubernetes requires careful architecture and why the QoS class of your database pods should almost always be Guaranteed.
Eviction Watermarks and Kubelet Behavior
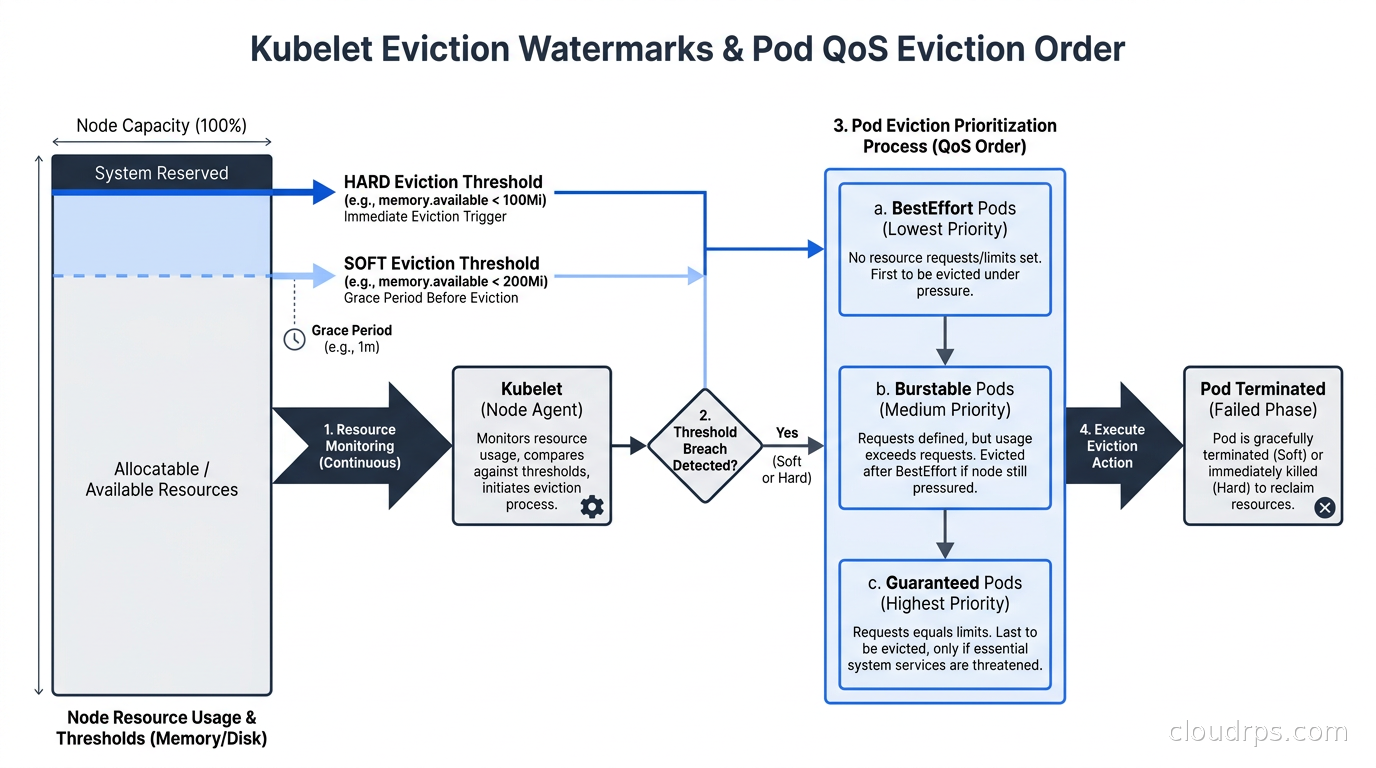
The kubelet monitors available node memory continuously and compares it against two thresholds: a soft eviction threshold and a hard eviction threshold.
When available memory drops below the soft threshold (default: memory.available < 100Mi), the kubelet begins graceful eviction. It selects pods for eviction based on QoS class and starts their termination sequence, giving them time to handle SIGTERM before SIGKILL. The soft eviction has a configurable eviction-soft-grace-period that defaults to 90 seconds.
When available memory drops below the hard threshold (same default: memory.available < 100Mi, but checked on a shorter interval with no grace period), the kubelet immediately kills pods without waiting for graceful shutdown. For pods without proper signal handling, this means in-flight requests get dropped and write buffers may not flush.
Most cluster administrators leave these thresholds at defaults and regret it. For clusters running memory-intensive workloads, I push the soft eviction threshold to 500Mi or higher so graceful eviction starts with more headroom. This gives the cluster time to reschedule evicted pods before the hard threshold triggers a cascade. The Karpenter node provisioner complements this approach by provisioning new nodes proactively when utilization trends upward, but it is not a substitute for sensible eviction thresholds.
There is also a node-level setting called kube-reserved and system-reserved that carves out CPU and memory from the node’s allocatable capacity for the kubelet, container runtime, and OS processes. On a 16Gi node, I typically reserve 1-2Gi for system processes. Failing to set these means your pods can theoretically be scheduled to fill 100% of node memory, leaving nothing for the kernel itself, which leads to hard node failures rather than orderly pod evictions.
LimitRange: Setting Defaults and Guardrails per Namespace
Without LimitRange, any developer can submit a pod with no resource configuration and create a BestEffort workload that can starve the entire node. LimitRange prevents this at the namespace level by injecting default requests and limits for containers that do not specify them, and by rejecting pods that specify values outside the configured bounds.
apiVersion: v1
kind: LimitRange
metadata:
  name: default-limits
  namespace: production
spec:
  limits:
  - type: Container
    default:
      cpu: 500m
      memory: 256Mi
    defaultRequest:
      cpu: 100m
      memory: 128Mi
    max:
      cpu: "4"
      memory: 4Gi
    min:
      cpu: 50m
      memory: 64Mi
The default field sets the limit that gets injected if a container omits it. The defaultRequest sets the request. The max and min fields cause the admission controller to reject any pod that specifies values outside those bounds. Any container submitted to this namespace without resource specifications automatically gets the defaults applied before the pod is created.
I recommend setting LimitRange in every namespace as a baseline policy. Starting conservative and letting teams request increases via a platform process is far easier to manage than trying to rein in runaway resource consumption after the fact. The defaults shown above work well for typical web services. Teams running data processing or inference workloads need namespace-specific LimitRanges with higher max values.
One useful pattern: create a LimitRange in your default namespace as a safety net, but also create namespace-specific LimitRanges for teams with known higher requirements. A machine learning namespace might have a max memory of 64Gi to accommodate model loading. A batch processing namespace might allow CPU limits of 16 cores.
ResourceQuota: Controlling Total Namespace Consumption
While LimitRange controls per-container bounds, ResourceQuota controls aggregate consumption across an entire namespace. This is your chargeback mechanism and your protection against a single team consuming all cluster capacity.
apiVersion: v1
kind: ResourceQuota
metadata:
  name: team-quota
  namespace: team-a
spec:
  hard:
    requests.cpu: "20"
    requests.memory: 40Gi
    limits.cpu: "40"
    limits.memory: 80Gi
    count/pods: "50"
    count/deployments.apps: "20"
    persistentvolumeclaims: "10"
    requests.storage: 500Gi
When a namespace hits its quota, new pods get rejected with a clear admission error. Teams know exactly why their deployment failed and can request a quota increase from the platform team. This model integrates well with internal developer portals like those discussed in the Backstage and Port platform engineering guide, where quota requests become a tracked self-service workflow rather than a Slack thread that someone might miss.
A pattern I have used successfully: align ResourceQuota to team cost budgets. If a team has a $4000/month compute budget and your nodes cost roughly $0.12/vCPU-hour (a reasonable ballpark for reserved on-demand capacity), that is about 1388 vCPU-hours per month. For a service running continuously, that is roughly 1.9 vCPUs sustained. Set the CPU request quota to reflect a multiple of that based on how many services the team runs. When quota management maps directly to cost accountability, teams become genuinely interested in right-sizing their workloads.
Right-Sizing: The Measurement Process That Actually Works
Knowing how requests and limits work is the easy part. Knowing what values to set requires measurement, and that measurement needs to be continuous because application resource consumption changes as features ship, traffic grows, and data volumes increase.
The Vertical Pod Autoscaler (VPA) in recommendation-only mode is the most reliable right-sizing tool for Kubernetes. Deploy VPA alongside your workloads, configure it with updateMode: "Off" so it only provides recommendations without touching your pods, and then query its recommendations after two weeks of production traffic.
kubectl describe vpa my-deployment -n production
Look at the Recommendation section. VPA shows lower bound, target, and upper bound recommendations for both CPU and memory. I typically set requests at the VPA target recommendation and memory limits at 1.5x the VPA upper bound recommendation. For CPU limits, I either set them at 2-3x the p99 CPU usage or leave them unset for latency-sensitive services.
For visibility into what is actually happening, Kubernetes cost visibility tools like OpenCost and Kubecost show the gap between allocated resources (what your requests say) and consumed resources (what the container actually uses). This gap is pure waste. On clusters I have inherited, this gap has ranged from 20% to over 50% of total allocated capacity, driven almost entirely by over-padded memory requests on services that run at a fraction of their requested memory.
Your observability stack should alert on two Prometheus metrics before they become customer-facing problems. container_cpu_throttled_seconds_total tells you which containers are being CPU throttled right now. When this spikes before latency metrics spike, you are catching the root cause instead of the symptom. container_memory_working_set_bytes compared against your limit tells you how much memory headroom remains. I alert when any container is consistently above 80% of its memory limit, giving teams time to adjust before the OOM Killer wakes me up. The Prometheus, Loki, and Grafana observability stack is the most common setup I see for this in production Kubernetes environments.
How Resource Configuration Affects Autoscaling
Resource requests directly affect how horizontal and vertical autoscaling behave, and getting this relationship wrong undermines your entire scaling strategy.
The Horizontal Pod Autoscaler scales based on actual utilization relative to requests. If a pod requests 500m CPU and uses 400m, that is 80% utilization. If your HPA is configured to scale out at 70%, it triggers and adds replicas. But if your request was set too high at 2000m for a pod using 400m, HPA sees 20% utilization and never scales out, even if the service needs more replicas to handle response time SLOs. Over-padded requests make HPA think your service has more headroom than it does.
The Kubernetes autoscaling guide covering HPA, VPA, and KEDA covers the scaling mechanics in depth. For resource configuration, the key insight is that requests are both a scheduling parameter and an autoscaling signal. They need to reflect realistic resource consumption, not comfortable padding.
For pod scheduling decisions, request values determine how densely pods pack onto nodes. Accurately sized requests maximize the number of pods per node, which directly impacts cost. For GPU workloads, this relationship is even tighter. Kubernetes Dynamic Resource Allocation for AI workloads addresses GPU scheduling specifically, where resource misconfiguration does not just waste money but can prevent GPU jobs from scheduling entirely because of how fractional GPU allocation works.
Common Production Mistakes
Setting CPU limit equal to CPU request. This creates a Guaranteed QoS pod, which sounds good, but it caps your CPU at the request value. Any workload with bursty CPU behavior gets throttled. Set limits higher than requests or leave CPU limits unset for latency-sensitive services.
Not setting memory limits. Unlike CPU throttling, which degrades performance gradually, unlimited memory consumption can trigger a node-wide eviction cascade. Always set memory limits, even if you set them generously.
Copying resource values from staging. Staging traffic patterns almost never reflect production. A service handling 100 requests per minute in staging may handle 10,000 in production. Always profile under production-representative load before finalizing resource configuration.
Not accounting for init containers. Init containers run sequentially before the main containers start. Kubernetes counts only the highest single init container request when calculating pod scheduling requirements, but init containers can still OOMKill if their memory limit is too low, failing the pod startup before the main container ever runs.
Setting requests to zero to avoid scheduling constraints. This creates BestEffort pods. In production namespaces, this means your service is first in line for eviction during any node memory pressure event. A brief traffic spike on a neighbor’s service can kill your pod.
My Recommended Configuration Process
For any new service I deploy to a Kubernetes cluster, the process is:
- Deploy with no limits and generous requests (2 CPU, 2Gi memory) in a staging environment
- Run a load test at 150% of expected peak traffic
- Collect p75, p95, and p99 CPU and memory usage from Prometheus
- Set CPU request at p75 actual usage, CPU limit at 3x p99
- Set memory request at p95 actual usage, memory limit at 1.5x p99
- Deploy to production and monitor
container_cpu_throttled_seconds_totaland OOMKilled events for two weeks - Run VPA in recommendation mode and compare against actual settings
- Adjust every quarter as the application evolves
Getting this right the first time matters less than having a process that revisits it regularly. Applications grow, traffic patterns change, and the right resource configuration for version 1.0 is rarely right for version 3.0. The clusters that run reliably over time are the ones where platform teams track utilization trends, surface them to application teams in regular reviews, and build tooling that makes right-sizing the default workflow rather than an afterthought.
Resource management is not glamorous work, but it is where cluster reliability actually lives. Fix your requests and limits before you invest in more sophisticated reliability patterns. Everything else depends on getting this foundational layer right.
Get Cloud Architecture Insights
Practical deep dives on infrastructure, security, and scaling. No spam, no fluff.
By subscribing, you agree to receive emails. Unsubscribe anytime.