Twenty years of production systems have taught me that you cannot manage what you cannot observe. That lesson applies to databases, networking, microservices, and now, most urgently, to the large language models running inside your applications. The difference is that LLMs break in ways your existing monitoring stack was never designed to catch.
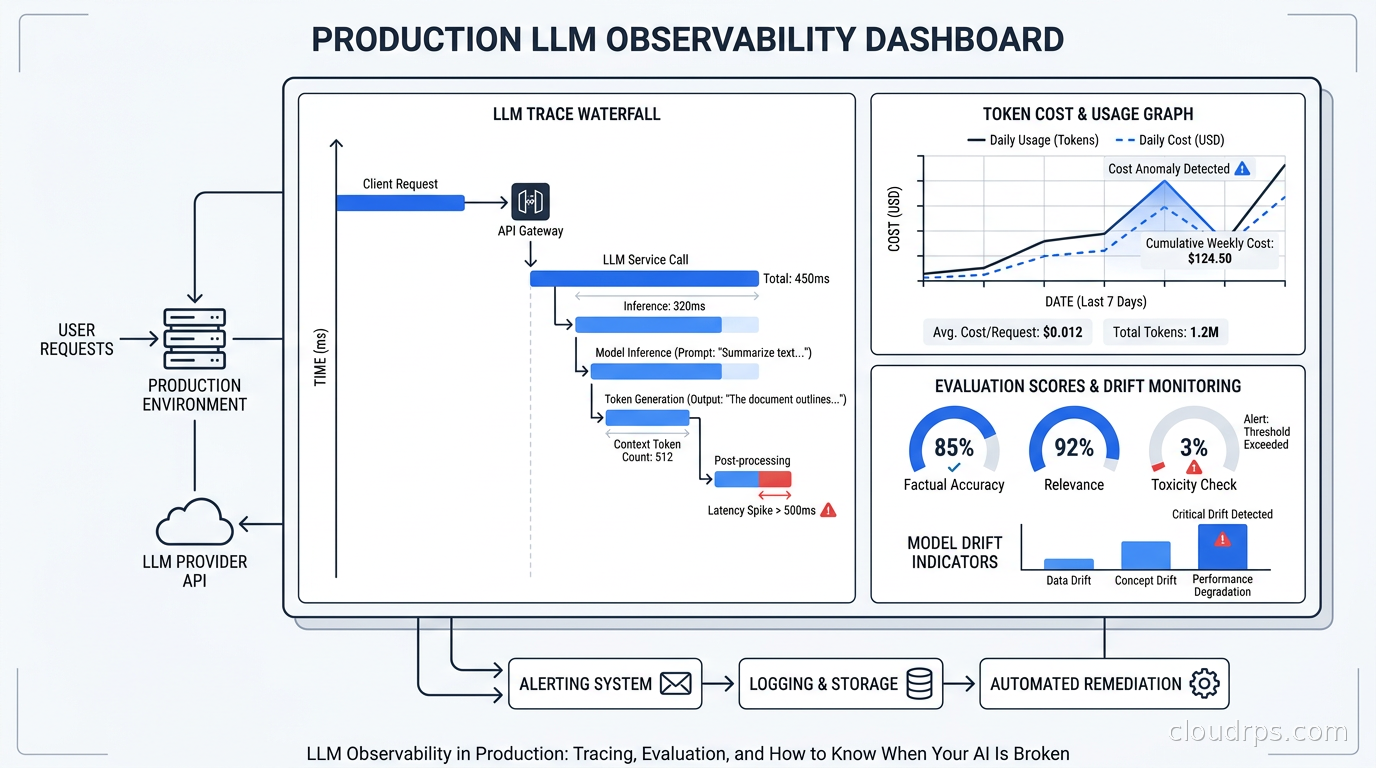
A service that returns HTTP 200 but gives your users nonsense is not a healthy service. A model call that costs $0.04 instead of $0.004 due to a prompt change nobody reviewed is a budget leak, not a feature. A retrieval-augmented generation pipeline where the retriever is finding the wrong chunks will degrade silently for weeks before anyone files a support ticket. None of this shows up in CPU graphs or error rates. You need a different kind of observability, and in 2026 the tooling has finally matured enough to use it in production without heroics.
This is what I have learned building LLM observability pipelines from scratch.
Why LLM Observability Is Fundamentally Different
Traditional application observability rests on three signals: metrics (numeric aggregates over time), logs (structured event records), and traces (request-scoped call graphs). All three assume that correct behavior is binary. Either the function returned the right value or it threw an exception. Either the query ran in under 100ms or it did not.
LLMs break that assumption completely. A model can return a syntactically valid, semantically coherent, grammatically perfect response that is factually wrong, off-topic, or subtly unsafe. The response is not an exception. It will not increment your error counter. Your HTTP 200 rate will stay at 99.9% while your users quietly stop trusting your product.
On top of the quality problem, LLMs introduce a cost structure unlike anything else in cloud infrastructure. Every call is billed by token, and token counts vary unpredictably based on user input, prompt template complexity, and whether your retrieval step found two chunks or twelve. A prompt engineering change that feels like a minor tweak can double your per-request cost without triggering any alert. I have watched this happen to three different teams. The bill arrives at month end and the engineering postmortem is not pleasant.
Finally, LLMs are probabilistic. Run the same prompt twice and you may get different outputs. That means you cannot regression-test an LLM the way you regression-test a deterministic function. Your test suite passes. Your staging environment looks fine. Production is different. The only way to catch degradation is to evaluate live traffic continuously.
The OpenTelemetry GenAI Semantic Conventions
The good news is that the industry converged on a standard. The OpenTelemetry GenAI semantic conventions, which define a shared attribute vocabulary for LLM spans, reached stable status in early 2026. This is a big deal. Before this, every observability vendor invented their own span schema. Migrating from one tool to another meant re-instrumenting everything.
The stable conventions define a span kind of CLIENT for LLM invocations, with a standard set of attributes. The most important ones:
gen_ai.system- the provider (openai, anthropic, google, etc.)gen_ai.request.model- the model name (claude-sonnet-4-6, gpt-4o, gemini-1.5-pro)gen_ai.request.max_tokens- your configured ceilinggen_ai.response.model- the actual model that responded (important for deployments that alias models)gen_ai.usage.input_tokensandgen_ai.usage.output_tokens- the billing unitsgen_ai.response.finish_reason- stop, length, content_filter, tool_calls
The finish_reason attribute is underrated. When finish reason is length, your model hit the token limit and truncated its output. That is almost certainly a bug, either in your prompt design or your context management, and you want an alert on it. When finish reason is content_filter, a safety guardrail fired. You should log those for review.
For agentic and multi-step workflows, the conventions extend to chains and agents with gen_ai.operation.name set to values like chat, text_completion, embeddings, or tool. Spans nest, so you can trace a full agentic loop as a parent span with child spans for each model call, tool invocation, and retrieval step.
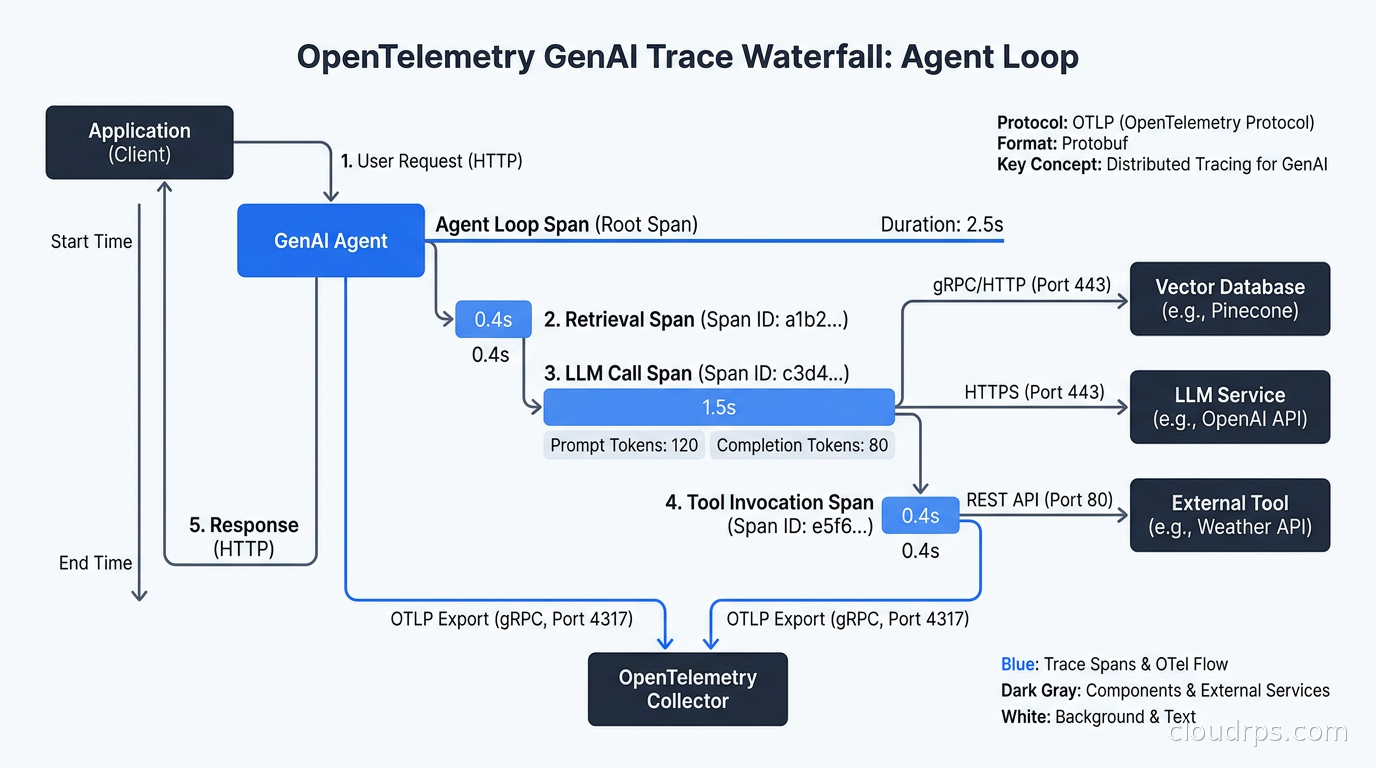
The practical way to instrument this today is OpenLLMetry, an Apache 2.0 library from Traceloop that auto-instruments OpenAI, Anthropic, LangChain, LlamaIndex, and others with one import. It emits standard OTel spans that any OTLP-compatible backend can ingest. You do not need to instrument model calls manually. If you are already running the OpenTelemetry distributed tracing stack for your microservices, adding OpenLLMetry means your LLM calls appear in the same trace as the surrounding application code, which is exactly what you want when debugging.
Choosing an LLM Observability Platform
OpenTelemetry gives you the data format. You still need a backend that understands it and surfaces the AI-specific analytics you care about. The main options in 2026:
Langfuse is the open-source choice and where I point most teams. You can self-host it on Postgres and run it inside your VPC, which matters when your prompts contain PII or confidential documents. It has native LLM evaluation support, cost dashboards broken down by model and user, a prompt management system with versioning, and a dataset management tool for building offline eval suites. The tracing SDK supports Python and JavaScript. If your organization has strict data residency requirements, self-hosted Langfuse is often the only real option.
LangSmith from LangChain is tightly integrated with the LangChain ecosystem. If you are already using LangChain or LangGraph for your agent orchestration, the tracing integration is nearly zero-friction. The managed cloud product has a generous free tier and strong tooling for debugging multi-step agent traces. The downside is that your traces go to LangChain’s SaaS, which is a non-starter at regulated enterprises. If you have not yet settled on an agent orchestration framework, our LangGraph vs CrewAI vs AutoGen comparison covers the production trade-offs that affect observability and cost visibility.
Arize Phoenix occupies a different niche. It is built for evaluation-first workflows. The killer feature is the ability to run evaluation experiments in a notebook, export results, and compare them across prompt versions. It integrates with standard OTel traces but adds an evaluation layer on top. I use Phoenix when the team wants to rigorously measure quality improvements during a prompt engineering sprint.
Helicone is the proxy-based approach. Instead of adding SDK instrumentation, you route all OpenAI and Anthropic calls through Helicone’s proxy. Zero code changes, instant cost visibility. The tradeoff is that you are adding a network hop on every LLM call and trusting a third-party proxy with your prompts and completions. For proof-of-concept work it is fine. For production at scale I want SDK-level instrumentation with a self-hosted backend.
For teams using the AI gateway pattern to centralize LLM routing, some of the observability can live at the gateway layer. Kong’s AI Gateway, LiteLLM proxy, and similar tools can emit per-request cost and latency metrics without touching application code. That gives you fleet-wide dashboards. For request-level debugging, span-level tracing from the application is still necessary.
Token Cost Observability
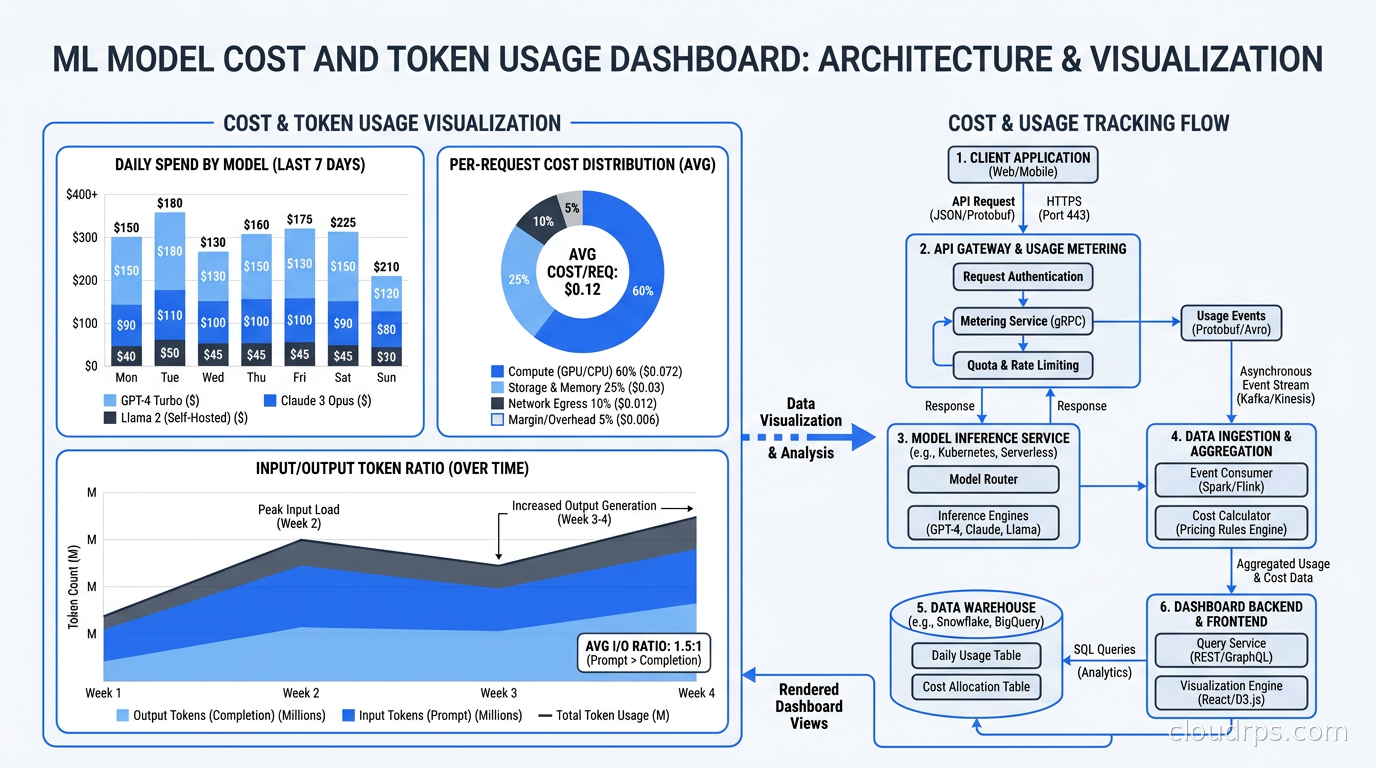
Token cost is a first-class metric, not an afterthought. The mistake I see teams make is treating it as a FinOps problem to solve at billing time. By the time your monthly invoice arrives, you have lost the ability to correlate cost spikes with specific features, prompt changes, or user cohorts.
The right model is to compute cost per request at trace time and store it as a span attribute or a derived metric. With input token price and output token price defined per model, you can calculate request cost during ingestion. Then you can slice cost by:
- Model (is your fallback to GPT-4o running more than expected?)
- Feature or endpoint (which product feature has the highest per-user cost?)
- User tier (are free-tier users consuming premium-model budget?)
- Prompt version (did that prompt change reduce cost or increase it?)
Setting budget alerts on a daily or hourly rolling window is cheap insurance. A 3x spike in token spend from a single endpoint is almost always a bug, either a prompt that grew unexpectedly large, a retrieval step returning too much context, or a code path running the LLM in a loop.
Reasoning models add a dimension most cost dashboards miss entirely. When you call o3 or Claude Extended Thinking, thinking tokens are billed separately from output tokens and often dwarf them. A request with 500 visible output tokens might carry 8,000 thinking tokens behind it. If your cost attribution only counts gen_ai.usage.output_tokens, your actual spend is invisible. Tracking thinking token utilization, budget cap usage, and the ratio of thinking tokens to output tokens is covered in the AI reasoning models production guide, alongside the async patterns these models require.
I worked on a system where the retrieval pipeline was inadvertently including a large document in every context window because of a bad filter condition. The per-request cost tripled overnight. The model was still returning plausible-sounding answers so no quality alert fired. We caught it only because we had a cost-per-request p95 alert set at 2x the baseline. Without that alert, we would have discovered the problem at month end with a $40,000 bill.
Evaluation in Production
This is the hardest part and the part most teams skip. Offline evaluation, running test prompts through a prompt template before shipping, is necessary but not sufficient. Distribution shift is real. Your test suite cannot cover the full diversity of inputs your users will throw at the system. You need online evaluation running against live traffic.
The standard pattern is LLM-as-judge. You define evaluation criteria, and a separate, usually cheaper model grades each production response against those criteria. Common dimensions:
- Faithfulness: for RAG systems, does the answer stay grounded in the retrieved context or does it hallucinate?
- Answer relevance: does the response address what the user actually asked?
- Toxicity and safety: does the response contain harmful content?
- Completeness: for tasks with defined outputs, did the model produce all required fields?
The practical implementation is an async evaluation pipeline. Your application records each LLM interaction (input, retrieved context if applicable, output) to a queue. A consumer pulls from the queue, runs the eval model, and writes scores back to your observability store. You do not want eval in the critical path because it adds latency and cost to every user request.
Tools like Langfuse, Arize Phoenix, and Confident AI can run managed evaluation pipelines. If you are building from scratch, the pattern is straightforward: a Kafka or SQS consumer, an evaluation prompt template, a call to a small fast model (Haiku-class or equivalent), and a write back to your metrics store. The evaluation model does not need to be the same model you are evaluating.
For RAG systems specifically, the RAGAS framework defines a set of metrics including context precision (did retrieval find the right chunks?), context recall (did it miss relevant chunks?), and answer groundedness. Running RAGAS offline on a golden dataset before shipping, and running a lightweight version online in production, gives you a two-layer quality net. If you are still building out your retrieval pipeline, our RAG architecture production guide covers the chunking, hybrid search, and re-ranking decisions that most directly affect these evaluation scores. For a deeper look at building a full eval pipeline with RAGAS, DeepEval, and Braintrust including CI integration, threshold-based deployment gates, and production sampling strategies, see the LLM evaluation in production guide.
The agentic AI production challenges article covers the broader operational patterns for multi-step agent systems, but for observability specifically: trace the entire agent loop as one parent span. Log tool calls, tool outputs, and model decisions as child spans. This is the only way to replay what actually happened when an agent made a bad decision three steps into a five-step workflow. That same tool call logging is your primary detection surface for security incidents: unusual tool call sequences and rate anomalies are the earliest indicators of prompt injection attacks, which is covered in detail in the guide to securing AI agents in production.
Alerting on AI Quality
Once you have evaluation scores flowing, you need to alert on them. The metrics I monitor in production:
Faithfulness score rolling average - For RAG systems, if the 1-hour rolling average of faithfulness drops below 0.85, something changed in the retrieval pipeline or the model’s behavior. Alert and investigate.
Finish reason distribution - A sudden increase in length finish reasons means prompts are growing or context windows are filling up. Alert at 5% of requests finishing with length.
Eval latency p99 - If your evaluation pipeline is falling behind (queue depth growing, eval scores lagging real time by hours), you are losing your early warning system. Alert on queue depth.
Cost per request p95 - As described above. Set the threshold at 2-3x the established baseline.
Tool call failure rate - For agentic systems with tool use, track the rate of tool calls that return errors or empty results. A spike here usually means an external API degraded or a retrieval index went stale.
One thing I want to be clear about: do not try to aggregate LLM quality into a single composite score. A single number hides too much signal. A response can be perfectly faithful to context while being completely irrelevant to the question. Keep faithfulness, relevance, and safety as separate time series.
Integrating with Your Existing Stack
Most teams already have Prometheus and Grafana running, or Datadog, or the cloud-native equivalent. The goal is not to rip and replace your observability stack for LLM monitoring. The goal is to extend it.
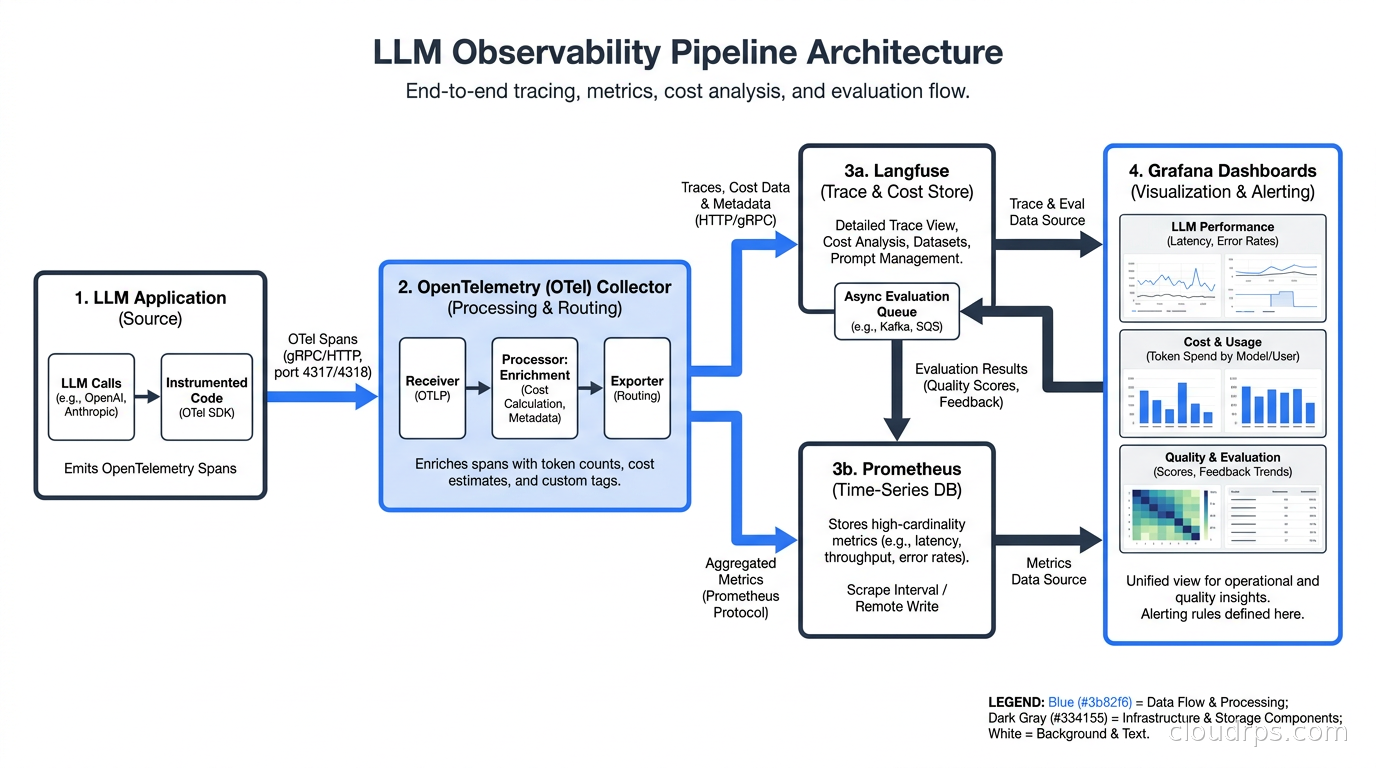
If you are running the Prometheus, Loki, and Grafana observability stack, you can expose LLM metrics through a custom exporter or via the OpenTelemetry Collector’s Prometheus exporter. The OTel Collector has a genai processor that can extract token counts and compute cost metrics from spans, making them queryable as standard Prometheus counters.
Datadog added native support for OpenTelemetry GenAI semantic conventions in version 1.37. If you are a Datadog shop, LLM traces will appear in APM with the AI attributes indexed automatically. The LLM Observability product in Datadog adds evaluation scoring on top of this.
The important architectural decision is where to compute derived metrics. Computing cost-per-request in the application adds latency and couples your application to pricing data that changes. Computing it in an async pipeline at ingestion time is cleaner. The OTel Collector running in your pipeline is a good place to do this enrichment before forwarding to your backend. For AI workloads specifically, the Collector’s tail-sampling and routing capabilities let you send a 5-10% sample of successful inference traces to an expensive SaaS backend for real-time dashboards while routing 100% of traces to cheap object storage for post-hoc analysis; the observability pipeline deep dive covers this dual-destination pattern in detail.
The Prompt Management Connection
Observability data is only useful if you can connect it back to what changed. Prompt management, the practice of versioning and tracking prompt templates the way you version code, is the essential complement to LLM observability.
When a quality metric drops, the first question is: did the prompt change? Without versioned prompts, that question can take an hour to answer. With a prompt management system like Langfuse’s built-in registry or Humanloop, you can correlate a quality drop with a specific prompt version in minutes.
The pattern I recommend: tag every trace with the prompt version that generated it. When you update a prompt, cut a new version. After a production deployment, compare the quality metrics for the new prompt version against the previous version. If faithfulness drops or cost increases, roll back. This is the A/B testing methodology applied to prompt engineering.
For teams using the Model Context Protocol to give agents access to cloud infrastructure tools, tracing the MCP tool calls within the agent loop is equally important. You want to see which tools the agent invoked, what arguments it passed, and what the tool returned, all in the same trace as the LLM calls.
What a Production-Ready LLM Observability Setup Looks Like
After building this at multiple organizations, here is what I consider the minimum viable observability stack for an LLM application in production:
Instrumentation layer: OpenLLMetry or native SDK instrumentation emitting OTel spans to a local OTel Collector. All LLM calls captured with model name, token counts, latency, and finish reason. Prompt versions tagged on every span.
Backend: Langfuse (self-hosted if you have data sensitivity requirements, cloud otherwise) for LLM-specific analytics, evaluation scores, and cost dashboards. Spans also forwarded to your existing APM tool so LLM traces appear alongside service traces.
Cost alerting: Custom Prometheus metrics derived from token counts, with alert rules at 2x cost-per-request p95 and daily budget thresholds per model.
Online evaluation: Async evaluation pipeline running LLM-as-judge on a sample (10-30% of production traffic) for faithfulness and relevance. Scores written back to Langfuse and exposed as Prometheus metrics for alerting.
Prompt management: Versioned prompt registry, prompts tagged on spans, quality-by-version dashboards.
This setup catches the failure modes that infrastructure monitoring misses: silent quality degradation, cost leaks, prompt regressions, and retrieval failures. It takes two to three days to wire up from scratch and pays for itself the first time it catches a regression before a user escalation.
The Broader Observability Picture
LLM observability does not replace infrastructure observability, it extends it. Your GPU utilization, inference latency at the serving layer, and throughput metrics from your LLM inference infrastructure remain critical. A quality degradation can originate in the model serving layer (a bad quantization, a model version swap) or in the application layer (a prompt change, a retrieval regression). You need visibility into both.
The AIOps trend of using AI to monitor infrastructure is distinct from what I am describing here, which is monitoring AI itself. Both matter. The irony of the current moment is that AI is now both the tool and the subject of observability.
After twenty years of running distributed systems, the teams I have seen succeed with AI in production are the ones who treat LLM quality as an operational metric on par with latency and error rate. They instrument from day one. They set quality alerts before they get paged about a quality incident. They build evaluation pipelines while the team still remembers why the prompts were written that way.
The teams that treat quality as a product problem to be handled by manual testing ship faster initially and spend much more time firefighting later. The instrumentation investment is small. The cost of skipping it is not.
Get Cloud Architecture Insights
Practical deep dives on infrastructure, security, and scaling. No spam, no fluff.
By subscribing, you agree to receive emails. Unsubscribe anytime.