
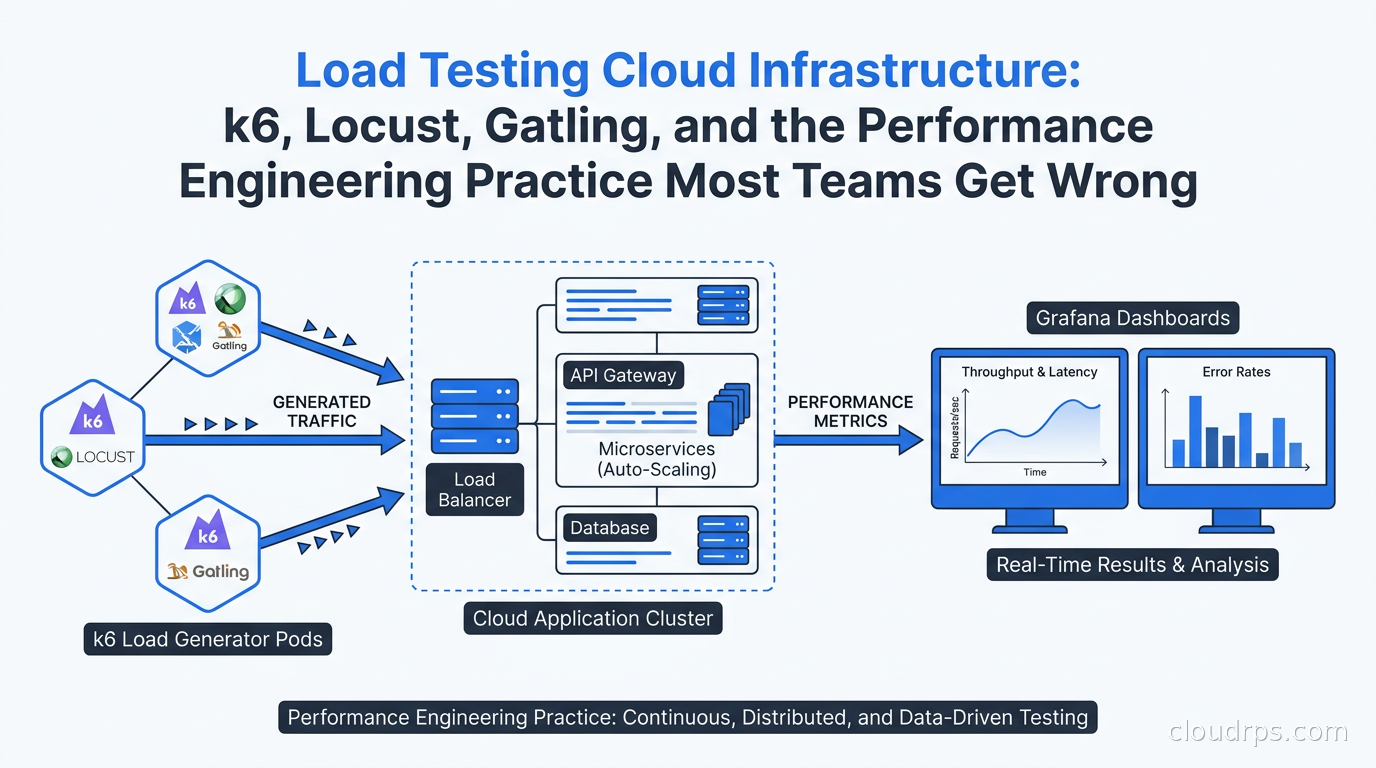
I once inherited a payment processing platform that had never been load tested. The team was proud of their setup – EKS cluster, HPA configured, RDS Aurora with read replicas, the works. They said “it autoscales.” Three months later, they ran a flash sale that drove 10x normal traffic. The HPA did scale, eventually. It took four minutes to provision new nodes. The database connection pool exhausted in 90 seconds. The whole system fell over before the first new pod was ready to serve a request.
Four minutes and thirty seconds of downtime during a flash sale. Seven figures in lost revenue. And none of it would have happened if someone had run a load test first.
Load testing is the practice that separates engineering teams that are confident from teams that are merely optimistic. After twenty years of building cloud infrastructure, I have watched both kinds. Confident teams find their breaking points in staging. Optimistic teams find them during launch day.
What Load Testing Actually Is (And Is Not)
Before touching tooling, clear up the taxonomy. Teams conflate these constantly, and the conflation leads to the wrong tests at the wrong time:
Load testing simulates expected peak traffic. You send 1,000 concurrent users at your system and measure response times, error rates, and resource utilization. The question is: how does the system behave under the load we expect?
Stress testing pushes past expected limits to find the breaking point. You ramp from 1,000 to 5,000 to 10,000 users until something fails. The question is: where exactly does the system fall apart, and how does it fail?
Soak testing (endurance testing) runs at moderate load for hours or days. The question is: are there memory leaks, connection pool exhaustion, or disk accumulation that only appear over time?
Spike testing drives sudden, massive traffic bursts – from baseline to 50x in seconds. Flash sales, product launches, breaking news. The question is: can the system handle shock traffic without falling over?
The distinction matters because each requires different tooling configurations, different infrastructure, and different pass/fail criteria. You need all four, at different points in your release process.
The Tool Landscape in 2026
Four tools dominate modern cloud-native load testing. Here is an honest assessment of each.
k6 (Grafana)
k6 is written in Go, test scripts are JavaScript or TypeScript, and it integrates cleanly with every CI/CD pipeline I have ever run. A single instance can push 30,000 to 40,000 virtual users and generate over 300,000 HTTP requests per second on modern hardware. The API is clean and the CI/CD integration is excellent:
import http from 'k6/http';
import { check, sleep } from 'k6';

export const options = {
  stages: [
    { duration: '2m', target: 100 },   // ramp up
    { duration: '10m', target: 1000 }, // hold at load
    { duration: '2m', target: 0 },     // ramp down
  ],
  thresholds: {
    http_req_duration: ['p(99)<500'], // 99th percentile under 500ms
    http_req_failed: ['rate<0.01'],   // less than 1% errors
  },
};

export default function () {
  const res = http.get('https://api.example.com/products');
  check(res, { 'status is 200': (r) => r.status === 200 });
  sleep(1);
}
The thresholds block is what makes k6 CI-friendly. A test either passes or fails against defined criteria. Your pipeline gets a clear exit code. No human judgment required at 2am when you are wondering whether a staging test run means you can release.
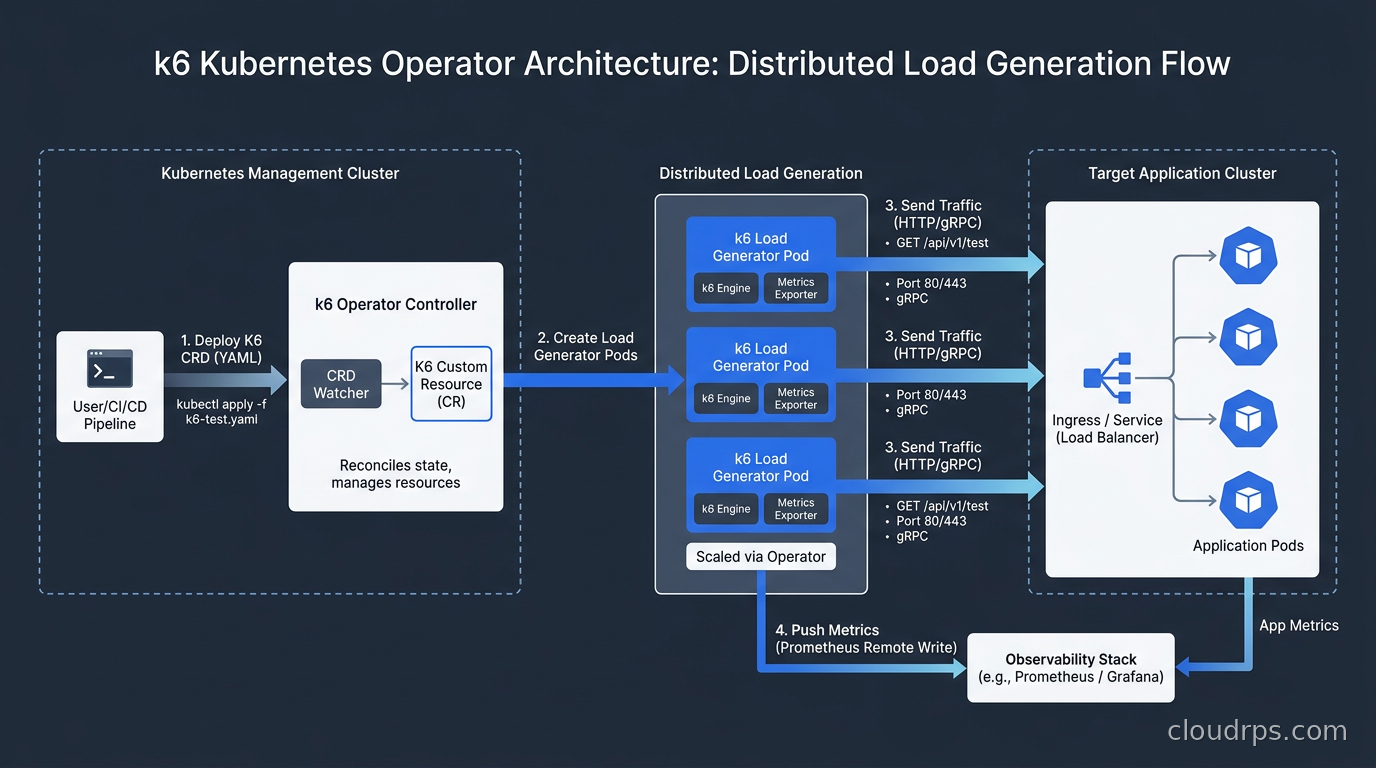
k6 also has a Kubernetes operator (k6-operator) for distributing load across multiple pods. I cover that in the infrastructure section.
Locust
Locust uses Python and simulates users as coroutines (greenlets). If your team writes Python, this is often the path of least resistance. The test definition is pure Python:
from locust import HttpUser, task, between

class ProductUser(HttpUser):
    wait_time = between(1, 3)

    @task(3)
    def browse_products(self):
        self.client.get("/products")

    @task(1)
    def view_product(self):
        self.client.get("/products/42")

    @task(1)
    def add_to_cart(self):
        self.client.post("/cart", json={"product_id": 42})
The @task weighting is powerful for realistic user behavior modeling. Real users do not just hammer one endpoint – they browse, search, add to cart, abandon, come back. Locust makes this behavioral modeling natural. It ships a built-in web UI for real-time monitoring, which is useful during exploratory stress tests when you want to watch what happens as you manually increase load.
One limitation: Locust’s HTTP client throughput per worker is lower than k6. Plan to run more workers to hit equivalent virtual user counts.
Gatling
Gatling is JVM-based, written in Scala with a compiled DSL. Per instance it delivers 3,000 to 5,000 virtual users with low memory overhead. The simulation model is scenario-based, which maps naturally to user journey testing:
val scn = scenario("Browse and Purchase")
  .exec(http("Home Page").get("/"))
  .pause(2)
  .exec(http("Product List").get("/products"))
  .pause(1)
  .exec(http("Add to Cart")
    .post("/cart")
    .body(StringBody("""{"product_id":1}""")))

setUp(scn.inject(
  rampUsers(500).during(120)
).protocols(httpProtocol))
Gatling produces excellent HTML reports with built-in charting – percentile histograms, response time over time, request rate. For teams that need to share performance reports with stakeholders who are not engineers, Gatling’s native reports are a practical advantage over k6 (which outputs to Grafana or stdout).
Gatling Enterprise (the commercial version) adds multi-cloud distributed execution. The open-source version is viable for most teams.
Artillery
Artillery is Node.js-based, YAML-configured, and the fastest to start with:
config:
  target: "https://api.example.com"
  phases:
    - duration: 60
      arrivalRate: 10
    - duration: 120
      arrivalRate: 100
scenarios:
  - flow:
      - get:
          url: "/products"
      - post:
          url: "/cart"
          json:
            product_id: 42
Artillery integrates with AWS Lambda for serverless load generation – you spin up hundreds of Lambda functions, fire them simultaneously, and aggregate results. For teams already deep in AWS, this is elegant. No infrastructure to manage, no Kubernetes operator to operate. Pay per test, not per idle cluster.
The JMeter Question
JMeter is everywhere because it is ancient and has a GUI. I have used it. I still use it when a client insists. But JMeter is XML configuration, Java-heavy, and has a GUI-first workflow that fights CI/CD pipelines. On new projects, I would not choose JMeter. The only reason to keep it is if you have existing test suites where the rewrite cost is not justified.
Infrastructure: Distributed Load Generation on Kubernetes
A single machine has limits. Simulating 100,000 concurrent users requires distributing load across multiple generators.
k6 Operator
The k6 Kubernetes operator distributes load across multiple pods using a CRD:
apiVersion: k6.io/v1alpha1
kind: TestRun
metadata:
  name: product-load-test
spec:
  parallelism: 10  # 10 k6 pods
  script:
    configMap:
      name: k6-test-script
      file: test.js
  arguments: --vus 10000 --duration 10m
With parallelism: 10 and 1,000 VUs per pod, you get 10,000 total virtual users distributed across the cluster. Results aggregate centrally. The operator watches for TestRun objects, spins up the pods, and cleans up after the test completes. This is the pattern I use for large-scale tests in Kubernetes environments.
Locust Master-Worker
Locust distributed mode uses a master process and N worker processes. The master handles the web UI and result aggregation; workers generate load. In Kubernetes, deploy master and workers as separate Deployments. Workers connect to master via the LOCUST_MASTER_NODE_HOST environment variable. Scale workers horizontally – an HPA on worker CPU or custom metrics works fine.
One practical gotcha: the master becomes a message bottleneck above 50-100 workers reporting results simultaneously. You need to tune the master’s message buffer size and, for very large tests, consider running multiple independent test campaigns rather than a single massive one.
Gatling Distributed
Gatling open-source does not have native distributed support: you run multiple independent instances and merge results. Gatling Enterprise adds a controller that orchestrates distributed execution across cloud providers natively. For the open-source version, a simple shell script that runs N Gatling processes and merges their simulation.log files is serviceable for moderate scales.
CI/CD Integration: The Tiered Approach
The anti-pattern I encounter most often: teams run load tests manually, once a quarter, the week before a big launch. This means they discover performance regressions at exactly the worst moment – during launch prep, with no time to fix them.
The correct model is tiered testing embedded in the CI/CD pipeline:
Tier 1: Smoke test (every PR, under 2 minutes). Ten to twenty virtual users, just enough to verify the service responds correctly under any load at all. Catches obvious regression and misconfiguration fast.
Tier 2: Load test (every staging deployment, 10-15 minutes). Full expected peak traffic. Must pass p99 latency and error rate thresholds. Gate the promotion from staging to production on this passing.
Tier 3: Stress test (weekly on a schedule, 30-60 minutes). Find the breaking point. Let it fail, record what broke and at what load level. Feed the results into capacity planning and runbooks.
Tier 4: Soak test (monthly, 4-24 hours). Run at moderate load and look for degradation over time. Memory leaks, connection pool exhaustion, disk accumulation. Run this before major releases.
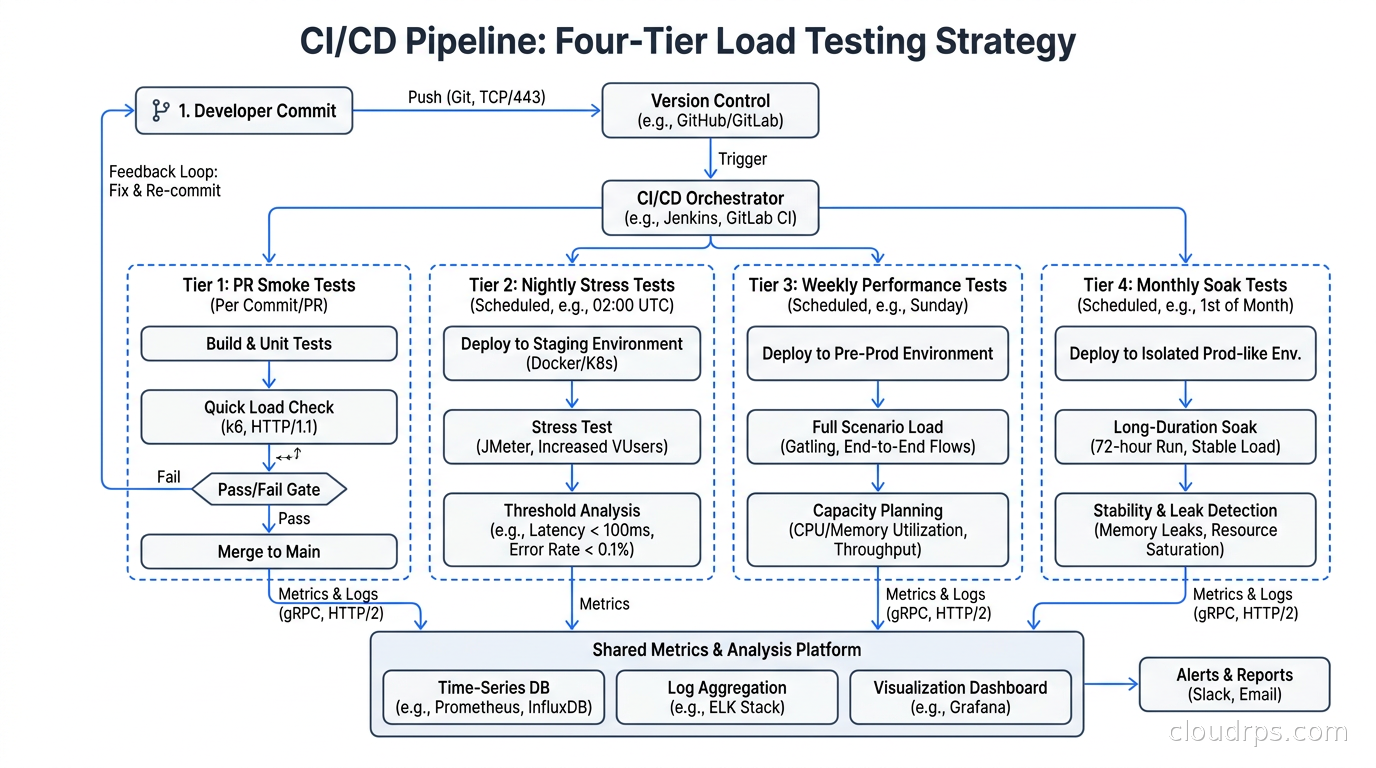
This integrates naturally with GitHub Actions and self-hosted runners running on Kubernetes via the Actions Runner Controller. Tier 1 and 2 tests run on every push; Tier 3 runs on a cron schedule; Tier 4 is triggered manually as a pre-release gate.
For threshold configuration, connect your load test criteria directly to your actual SLO definitions and error budgets. If your SLO is p99 under 500ms at peak load, that is exactly what your load test thresholds enforce. The error budget defines your acceptable failure rate. Load tests verify you are within budget under the traffic you expect. This makes performance gate decisions objective and traceable.
Reading Results: Percentiles Actually Matter
The most dangerous single metric in performance testing is the average. I have watched systems with 50ms average response time quietly destroy 5% of requests with 30-second timeouts. The average looked fine. Real users were furious.
Percentiles tell the real story:
p50 (median): Half of requests complete faster than this. Useful as a baseline, dangerous as a sole measure.
p95: 95% of requests complete within this time. The first threshold where tail latency becomes operationally significant.
p99: 99% of requests. Write your SLOs to this. Real users experience p99 regularly – it is not a theoretical outlier.
p99.9: One in a thousand requests. In a system handling 10,000 requests per second, that is 10 requests per second experiencing worst-case latency. This matters for your most important users and for understanding database hot spots.
When I look at load test results, I care about the shape of the percentile curve, not just point values. A sharp cliff from p95 to p99 – where p95 is 100ms but p99 is 4 seconds – usually indicates connection pool exhaustion, a hot database shard, or garbage collection pauses under load. A curve that climbs smoothly usually means the system is under-provisioned but not broken. Different shapes point to different root causes.
The second thing I watch is behavior during ramp-up. Systems with Kubernetes autoscaling via HPA will often show elevated latency and errors during the scaling period – new pods coming online, warmup time, health check delays before traffic routes to them. I want to know: how long is the scaling latency window, and does it fit inside the error budget? The flash sale disaster at the top of this article came down to four minutes of node provisioning latency. The load test would have revealed that immediately. Knowing the autoscaler’s actual response time lets you decide whether to pre-scale before known traffic events or accept the ramp-up window as acceptable risk.
Finding the Breaking Point
Stress testing to find the breaking point is uncomfortable because you are intentionally making the system fail. It is also one of the most valuable things you can do for long-term reliability.
The pattern I use:
- Establish a baseline at expected load, say 1,000 VUs. Record p99 latency and error rate.
- Increase load in 25-30% increments with 3-minute stabilization periods between each increase.
- Record at which VU count the first threshold is breached – either p99 latency or error rate.
- Continue ramping until the system is clearly failing, noting the failure mode.
- Reduce load back to baseline and verify recovery. This step is critical.
The failure mode is as important as the breaking point. Does the system fail gracefully or catastrophically? Does it recover automatically or require manual intervention? I have seen services that fail at 3,000 VUs but refuse to serve traffic even after load drops back to 500 VUs because the database connection pool is exhausted and does not self-heal. That is a critical architectural flaw. A stress test exposes it in staging for an afternoon. A production incident exposes it during your highest-revenue hour.
These stress test results feed directly into chaos engineering programs. The breaking points I find during stress tests – database connection exhaustion at 3,200 VUs, Redis connection limit hit at 4,500 VUs, GC pressure spiking at 2,800 VUs – become the exact failure modes I inject as chaos experiments. First I understand where the system breaks, then I test whether it handles those failures gracefully when they occur alongside normal production traffic.
Integrating with Observability
Load tests without correlated observability are half-useful. You see the symptoms – latency spikes, error rate increase – but not the cause inside the system.
The standard setup: k6 streaming metrics to Prometheus via the xk6-output-prometheus-remote extension, all visualized in Grafana alongside application metrics. The Grafana dashboard shows load test metrics (VU count, request rate, p99 latency from the client perspective) overlaid on service-level metrics (database connection pool saturation, cache hit rate, queue depth, CPU/memory). When p99 spikes at 2,400 VUs, you immediately see which internal resource hit its limit.
k6 supports output to InfluxDB, Prometheus Remote Write, Datadog, and Grafana Cloud natively. Locust has a Prometheus exporter plugin. Gatling writes to Graphite. All integrable, none requiring custom code.
For debugging, continuous profiling with Pyroscope or Parca during load tests is a significant force multiplier. Start a profiling session, run the stress test, capture the flamegraph under maximum load. I found a CPU-bound JSON serialization bottleneck in a Go service this way – completely invisible in standard metrics, obvious in the flamegraph as the serializer consuming 60% of CPU at 500 VUs. The fix was switching to a faster serialization library. Fifteen minutes to find, an hour to fix, a 40% throughput improvement.
Test Data Strategy
Load tests need realistic data, and teams consistently underestimate this.
If you run 10,000 virtual users all querying the same product ID, your application cache and CDN absorb the traffic. Your test shows great performance. It is not testing anything real. Real users query different products, execute different search terms, follow different journeys. You need varied, realistic data.
Strategies in decreasing order of realism:
Production traffic replay: Capture and anonymize real production request logs, then replay them at higher rates. Realistic query distribution, realistic data access patterns. The most accurate load profile you can generate. Requires careful PII handling.
Parameterized data sets: CSV or JSON files with thousands of product IDs, user IDs, search queries. k6, Locust, and Gatling all have first-class support for this. Achievable in a day.
Database snapshots at production volume: Restore a production-like data volume to your staging environment. Tests hitting an empty or tiny database are not testing the ORM caching, index selectivity, or buffer pool behavior that real production data creates. This is often the hardest part of load testing to get right organizationally – getting production-volume data into staging – but it is where the most realistic results come from.
For regulated environments where real data cannot be used in staging, synthetic data generation can create test datasets that match the statistical distribution of production without containing real PII. A synthetic product catalog, synthetic user IDs, synthetic order history – same volume, same access patterns, no compliance risk.
Performance Engineering as a Practice
The teams that extract the most value from load testing are not the ones that run a test before each major launch. They are the ones who track performance over time.
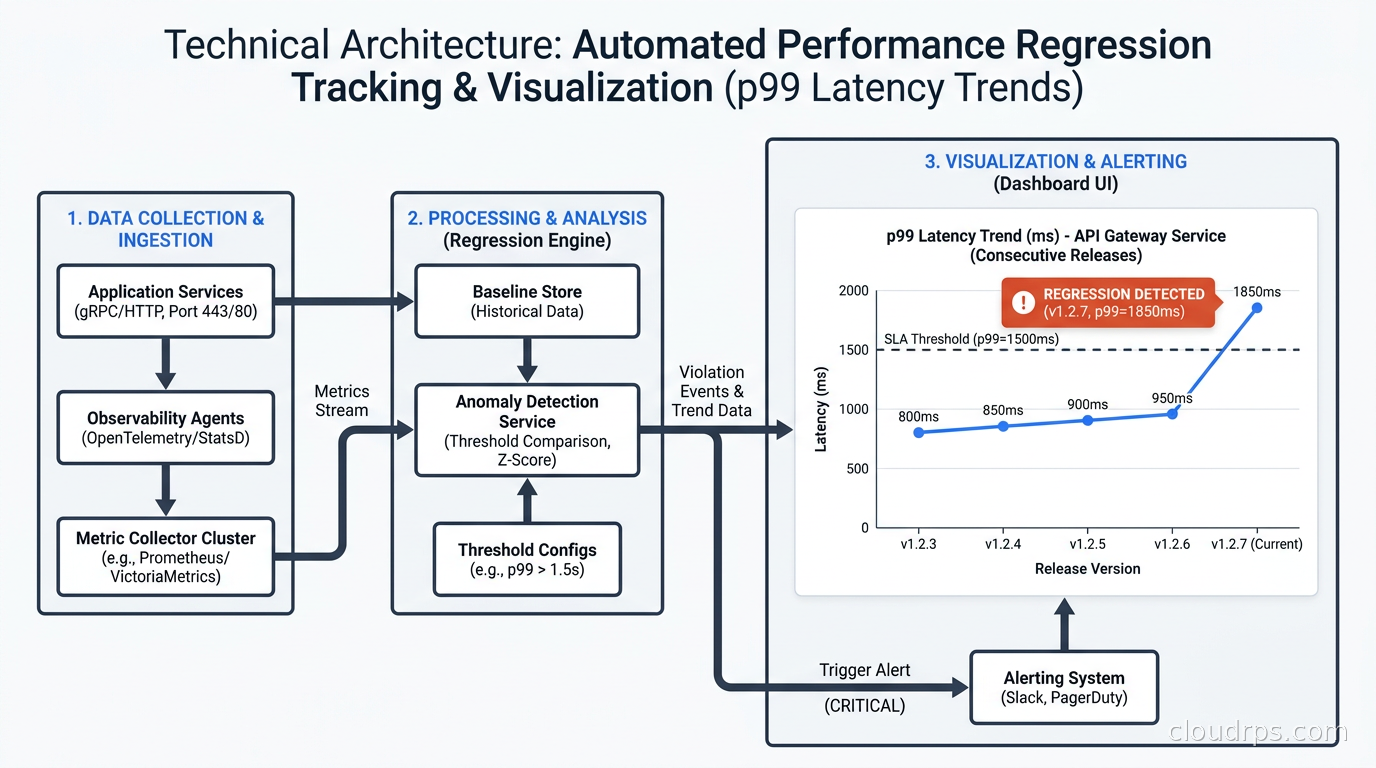
Implement a performance dashboard that tracks p99 latency and peak throughput for key API endpoints across every release. Plot the trend line. I have watched teams miss gradual performance regression – a serialization change that added 2ms here, a database query that slowed after a schema change there, an N+1 query introduced in a refactor. Each change looked fine in isolation. Together they doubled response time over four months. The trend line caught it. Individual test results would not have.
This connects directly to improving DORA metrics. Change failure rate often includes performance regressions that only manifest under load. If you gate staging promotions on load test thresholds, you catch these before they reach production. Your change failure rate drops, your MTTR improves, and your on-call team stops waking up at 3am debugging performance issues that should have been caught in a 10-minute CI/CD stage.
The economic case is straightforward. A Tier 2 load test that gates staging promotions costs roughly 15 minutes of compute per deployment. A production performance incident costs hours of engineering time, SLA credits, potential revenue loss, and the cumulative trust deficit of users who got slow responses. I have never worked with a team that built a solid load testing practice and then decided it was not worth the compute cost.
Choosing the Right Tool
After twenty years of running these in production, here is the honest summary:
k6: Default choice for new projects. Cloud-native, JavaScript/TypeScript, excellent CI/CD integration, Kubernetes-native distributed execution via k6-operator, and the Grafana ecosystem behind it. If you have no prior investment in another tool, start here.
Locust: Best fit for Python-heavy teams. Fastest onboarding if your engineers already write Python. The behavioral modeling with task weights is excellent. Use it when the team would have to learn JavaScript to use k6, and when throughput per instance is not the primary constraint.
Gatling: Best for JVM shops and teams that need to share polished reports with non-engineering stakeholders. The compiled DSL is expressive, the reports are professional, and the memory efficiency is good. Choose this if you have existing Gatling suites or a Java/Scala-native organization.
Artillery: Best for AWS-centric teams who want serverless load generation without managing infrastructure. Pay-per-test model, no cluster to operate.
JMeter: Use it if you already have it. Do not choose it fresh.
The most important decision is not which tool to use. It is to have a tiered testing practice embedded in your CI/CD pipeline before you have a flash sale disaster. Every team I have worked with that adopted this practice – smoke tests on every PR, load tests gating staging promotions, weekly stress tests finding breaking points – has been glad they did, and none have abandoned it once operational.
Start with load testing. Add stress testing once you have baselines. Add soak testing before major releases. Run it all in CI/CD. Track trends over time. When the traffic spike hits at 10x normal volume, you will be one of the engineering teams that is confident – not one that is optimistic.
Get Cloud Architecture Insights
Practical deep dives on infrastructure, security, and scaling. No spam, no fluff.
By subscribing, you agree to receive emails. Unsubscribe anytime.