I have been on both sides of this failure mode. I have been the data scientist who handed off a model in a Jupyter notebook and wondered why it took three months to get to production. And I have been the infrastructure engineer who received that notebook and spent those three months trying to understand what the model actually needed to run. Both experiences were painful. Neither had to be.
Gartner has a number that makes everyone in data science uncomfortable: over 85% of machine learning projects fail to reach production. I believe it. I have seen it. The failure is rarely the model itself. The models work. The failure is everything around the model: the data pipelines that feed it, the infrastructure that runs it, the monitoring that catches when it drifts, the processes that govern how it gets updated. This is the territory that MLOps covers.
MLOps is not a product you buy. It is a set of practices, tools, and organizational patterns that treat machine learning systems with the same engineering rigor you would apply to any critical software service. When you do it right, you can go from a new model idea to production deployment in days rather than months. When you skip it, you get models that work on Tuesdays but fail on Fridays because the upstream data schema changed.
Here is what the discipline actually looks like when you apply it in practice.
Why ML Systems Are Different from Normal Software
Before getting into tools and patterns, it is worth being explicit about why machine learning pipelines are harder to operate than regular software. The difficulty is not the computation. It is the fact that ML systems have two distinct failure modes instead of one.
Regular software fails when the code has a bug. You deploy bad code, you get bad behavior, you fix the code, the behavior improves. The failure signal is usually obvious: exceptions, error rates, timeouts. You have tests. Tests catch bugs. The feedback loop is fast.
ML systems can fail even when the code is perfectly correct. The model’s behavior changes because the world changed. User behavior shifted. An upstream system changed how it formats data. A vendor API started returning slightly different values. None of this is a code bug, but all of it breaks your model. The failure signal is often subtle: prediction quality degrades gradually, edge cases start behaving oddly, business metrics drift before anyone notices the model is the cause.
This second failure mode is what makes ML operations hard. You need to monitor not just whether the system is running, but whether what it is doing is still correct. And “correct” depends on a ground truth that often arrives with delay: you predict tomorrow’s churn, but you do not know if the prediction was right until the customer either churns or does not.
The tools and practices of MLOps exist specifically to manage these two failure modes simultaneously.
The ML Pipeline: More Moving Parts Than You Think
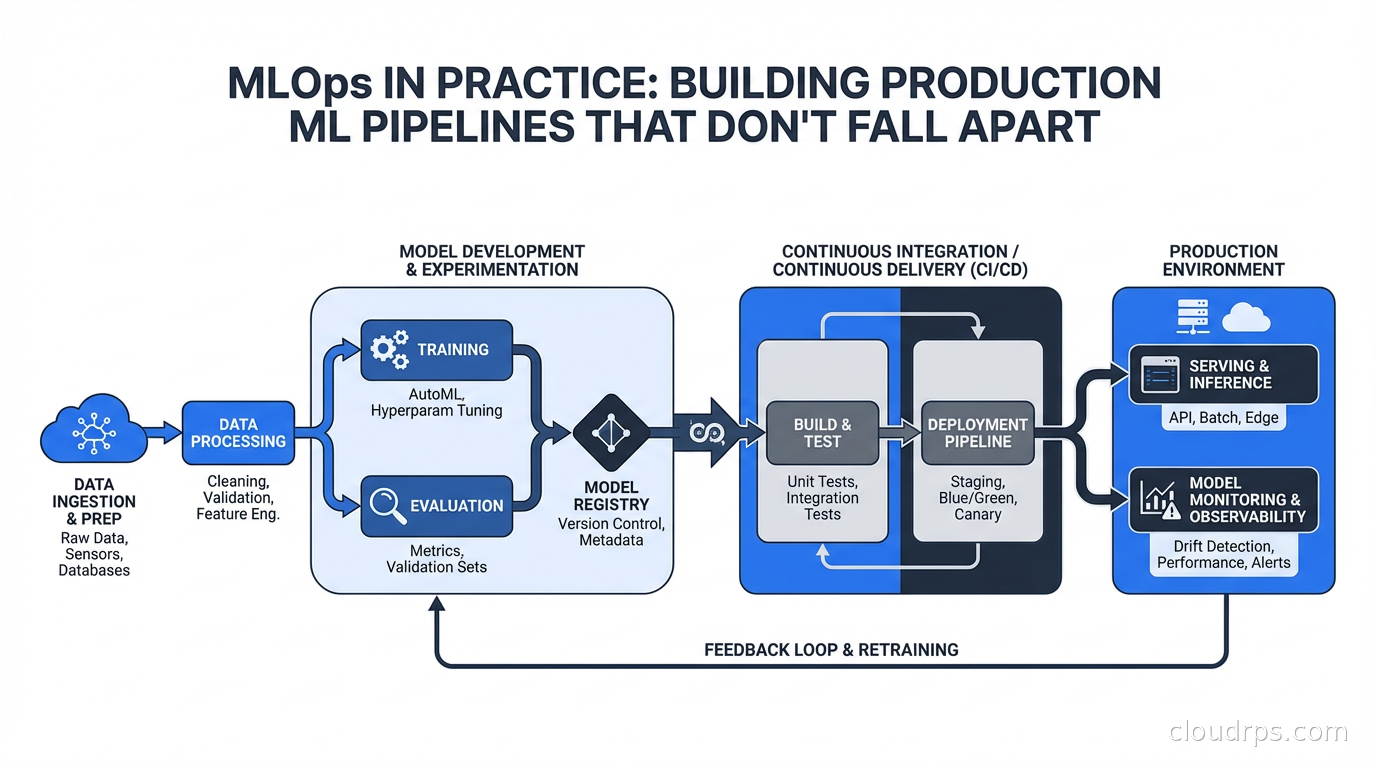
A production ML pipeline is not just “train a model, deploy a model.” A mature pipeline has multiple stages, each of which needs to be automated, versioned, and monitored.
Data ingestion and validation: Before training, you need to get data from wherever it lives (databases, event streams, data warehouses) and validate that it matches your expectations. Tools like Great Expectations or Soda let you define data contracts: this column should never be null, this value should always be positive, this distribution should match last week’s within some tolerance. Running these validations before training catches data issues before they corrupt a model silently.
Feature engineering: This is where the models actually depend on your domain knowledge. You compute features from raw data: rolling averages, ratios, categorical encodings, embeddings. The challenge is that you need to compute these features consistently at training time and at inference time. If you compute a 7-day rolling average differently in your training pipeline versus your serving pipeline, you introduce training-serving skew, and your model will perform worse in production than it does in evaluation. This is more common than I would like to admit.
Training and hyperparameter tuning: The actual model training. This needs to be reproducible: same code, same data, same configuration should produce the same (or equivalent) model. Tools like MLflow or Weights and Biases track experiments: what hyperparameters you tried, what metrics you got, what artifacts the training produced.
Model evaluation and validation: Before registering a model as production-ready, you need to evaluate it against held-out data and compare it against the current production model. This comparison should be automatic. A new model should only be promoted if it is actually better by whatever criteria matter for your use case: accuracy, F1, AUC, or a business metric like conversion rate.
Model serving: Getting the model to where it can make predictions. This might be a real-time REST endpoint, a batch scoring job, or an embedded model in an application. The infrastructure here varies enormously. Real-time serving requires low latency and high availability. For batch scoring, you care more about throughput and cost. These have different infrastructure profiles. This is closely related to what I cover in our LLM inference infrastructure guide, where the same serving principles apply at a larger scale.
Monitoring: The part most teams skip until they are in production for a month and something breaks. Monitoring needs to cover model performance (if you have ground truth), data drift (are the inputs changing?), and prediction distribution (are the outputs still making sense?).
Feature Stores: The Solution to Training-Serving Skew
I want to spend a moment on feature stores because they solve one of the most common and most expensive problems in production ML, and many teams do not discover them until after they have already been burned.
The problem: your data scientists define features against historical data in a warehouse or a notebook. Your engineers reimplement those features in the serving path against production data sources. When the definitions drift (and they will drift, because this is maintained by humans), your model sees different features at inference time than it was trained on. This is training-serving skew, and it produces subtle, hard-to-debug accuracy problems.
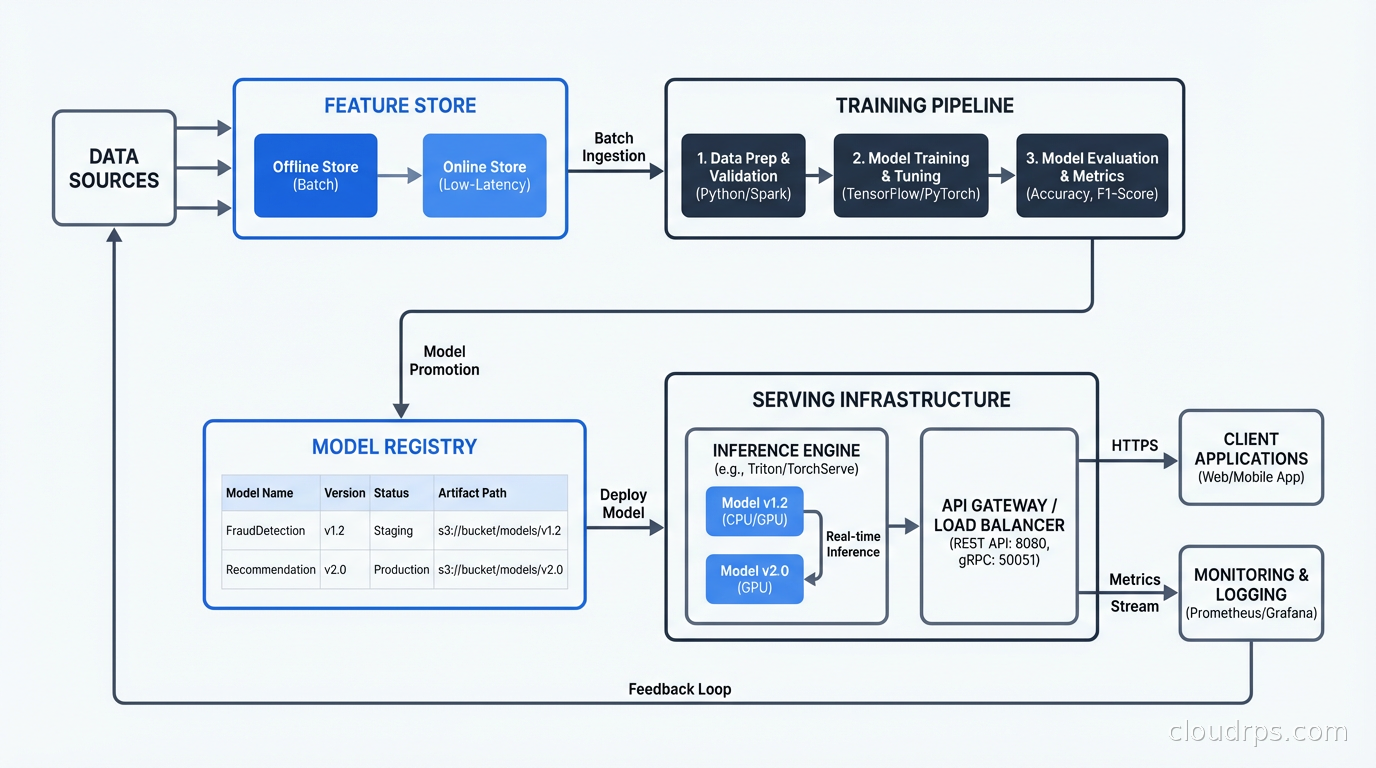
A feature store solves this by maintaining a single definition of each feature that is used in both the training path and the serving path. You write the feature computation logic once. The feature store handles materializing it to an offline store (for training and batch scoring) and an online store (for real-time inference). Popular options include Feast (open source), Tecton, and Vertex AI Feature Store if you are on GCP.
The dual-store architecture is the key insight: you need cheap bulk reads for training (typically from a data warehouse or object store) and fast point lookups for serving (typically from a low-latency key-value store like Redis). A feature store manages both and keeps them in sync. Our distributed caching guide covers the Redis architecture that backs most online feature stores.
Model Registry: Tracking What Is in Production and Why
Every mature MLOps setup has a model registry. The registry is a catalog of trained models with their metadata: what version, what training data, what evaluation metrics, what artifacts. More importantly, it tracks which model is currently serving traffic in each environment.
MLflow has a built-in model registry. So do Vertex AI, SageMaker, and most cloud ML platforms. The specific tool matters less than having one at all.
The model registry answers questions you will definitely be asked:
- What model is running in production right now?
- When was it trained?
- What was its performance on the validation set?
- What has changed since the last version?
- Can we roll back to the previous version?
Without a registry, these questions get answered by Slack messages, stale documentation, and a lot of digging through S3 buckets. With a registry, they are answered in thirty seconds.
The registry also serves as the deployment gate. Rather than having models deployed directly from training scripts, you require that models be registered and promoted through stages: staging, production. This creates an audit trail and a human (or automated) approval step before something goes to production.
CI/CD for Machine Learning
If you have a solid CI/CD background, the ML equivalent will feel familiar but with some important differences. Our CI/CD fundamentals article covers the core concepts. Here is how they translate to ML:
Continuous integration in ML means: when a change is made to training code, feature definitions, or model configuration, automatically re-run the training pipeline, evaluate the result, and check whether it passes your quality gates. This is where you catch regressions before they reach production.
Continuous delivery means: a model that passes quality gates can be automatically deployed to a staging environment. Promotion to production may require an additional approval step, especially for high-stakes models.
The main difference from software CI/CD is that ML pipelines are stateful and data-dependent. Running the CI pipeline means actually training a model, which takes real time and real money. You cannot run this on every commit the way you might run unit tests. Typical approaches include: running fast sanity checks on every commit (does the training code execute without errors?), running full training pipelines on merges to main, and using caching and incremental training to reduce iteration time.
Tools that help here include Kubeflow Pipelines, Apache Airflow, Prefect, and Metaflow. Each of these lets you define an ML pipeline as code: data ingestion, feature engineering, training, evaluation, registration. The pipeline is versioned, reproducible, and auditable.
Model Monitoring: Catching Drift Before Your Business Does
This is the part that separates teams that are good at MLOps from teams that think they are good at MLOps. Monitoring is not optional. It is the mechanism by which you detect when the world has changed enough that your model is no longer reliable.
There are three categories of drift you need to monitor:
Data drift (covariate shift): The distribution of your input features changes. Users start filling in a field differently. An upstream system starts sending slightly different values. A new customer segment with different characteristics starts dominating your traffic. Data drift does not necessarily mean your model is wrong yet, but it is an early warning signal.
Concept drift: The relationship between your inputs and the correct output changes. The patterns your model learned no longer hold. This is the more dangerous one. You need ground truth to detect it, which means you need a way to get feedback on your predictions. For some problems this is easy (did the user click?). For others it is hard (did the customer churn six months later?).
Prediction drift: The distribution of your model’s outputs changes even if inputs look the same. This can happen with distribution shift in the feature space or model degradation. It is often the easiest to detect because you can monitor it without ground truth.
For monitoring, tools like Evidently AI, WhyLabs, and Arize provide drift detection dashboards and alerting. At minimum, you should be logging input features and predictions for every request, and running statistical tests (PSI, KL divergence, KS test) against reference distributions on a schedule.
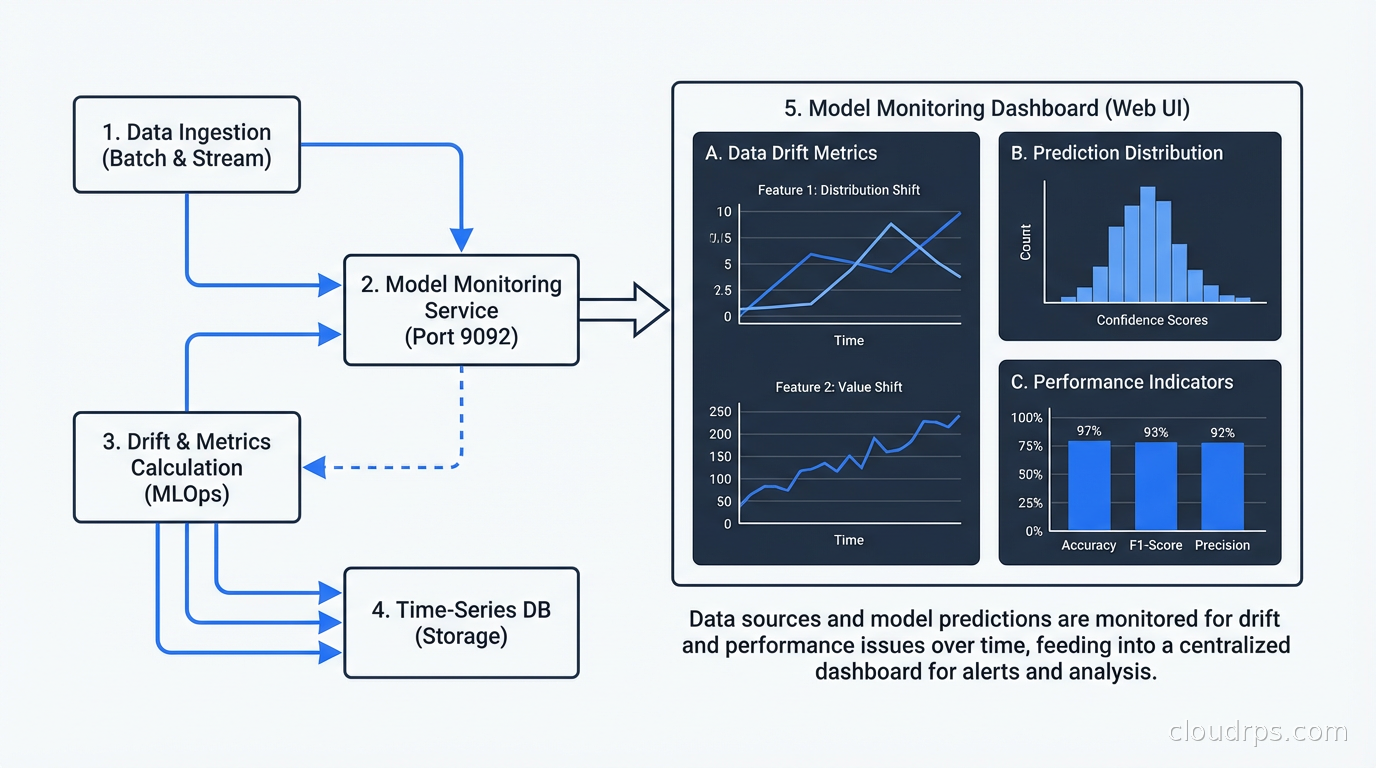
The alert should not say “drift detected, investigate.” The alert should say “feature X has shifted by Y amount, here is the distribution comparison, here are the top segments driving the shift.” The more context you bake into the alert, the faster the response. This is an area where good observability practices from software engineering translate directly.
Deployment Patterns for Models
How you deploy a model depends heavily on your latency requirements and your traffic patterns.
Real-time inference: The model serves predictions synchronously, typically via a REST or gRPC endpoint. Latency is measured in milliseconds. You need horizontal scaling, load balancing, and SLA monitoring. Tools like Seldon Core and BentoML are purpose-built for this. For Kubernetes-based deployments, you also need to think about GPU scheduling if you are serving neural networks. Our Kubernetes autoscaling guide covers the HPA and KEDA patterns that work well for model serving workloads.
Batch inference: The model runs on a large dataset on a schedule, producing predictions that are stored and consumed later. Much more infrastructure-efficient because you can use spot instances and optimize for throughput rather than latency. Suitable for use cases where predictions can be computed in advance: next-day recommendations, weekly churn scores, overnight fraud screening.
Near-real-time or streaming inference: You consume from a stream (Kafka, Kinesis) and emit predictions back to a stream. Latency can be seconds rather than milliseconds, but you get the throughput benefits of batch processing. This pattern works well when you need to score high-volume event streams but do not need sub-100ms latency.
Shadow mode / champion-challenger: You run a new model alongside the production model, routing a percentage of traffic to each, and comparing predictions. The new model does not affect production outcomes yet. This lets you validate a new model in real traffic conditions before committing to it. Canary releases for ML. This pattern pairs well with the feature flags and progressive delivery patterns that work in software delivery.
Organizational Reality: Who Owns What
The tooling conversation is often the easy part. The harder part is figuring out who is responsible for what in a production ML system.
Data scientists understand the model and the feature logic. They do not always understand container orchestration, scaling, or monitoring infrastructure. Platform engineers understand the infrastructure. They do not understand why a rolling average needs to be computed over exactly a 7-day window with a specific timezone offset.
The teams that do MLOps well establish clear ownership: data scientists own the model definition, feature definitions, and evaluation criteria. ML engineers or platform engineers own the training infrastructure, serving infrastructure, and monitoring stack. There is a shared responsibility layer where both need to collaborate: the interface between training and serving, the schema of inputs and outputs, the definition of what “working correctly” means.
Without this clarity, you get gaps. Nobody set up monitoring because data science assumed infrastructure would and infrastructure assumed data science would. This is not a tools problem. It is a responsibility gap.
The internal developer platform trend that is reshaping DevOps is starting to affect ML too. The best-resourced teams are building ML platforms: opinionated infrastructure that lets data scientists submit training jobs, register models, and deploy serving endpoints through a self-service interface, without needing to understand the Kubernetes YAML underneath. This is the right direction, even if most teams are not there yet.
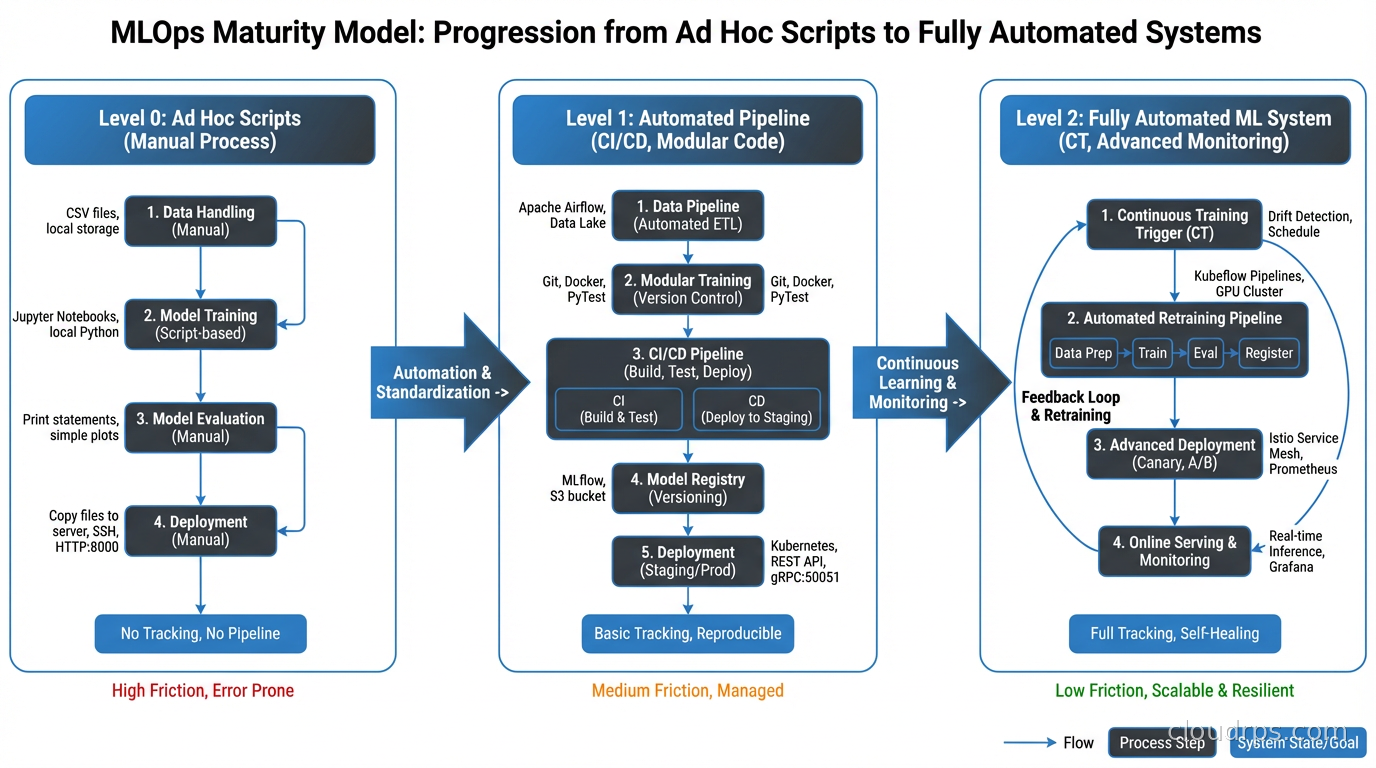
The Minimal Viable MLOps Stack
If you are starting from nothing, the full stack I have described is overwhelming. Here is what I would implement first, in priority order.
Experiment tracking comes before anything else. MLflow or Weights and Biases. Log every training run: parameters, metrics, artifacts. This costs almost nothing and pays dividends immediately when you need to reproduce a result or understand why the current model is worse than the one from two months ago.
Data validation in the training pipeline comes second. Even simple checks (no nulls in critical columns, value ranges are sane) catch a huge fraction of silent failures.
A model registry comes third. Even if it is just MLflow’s built-in registry, knowing which model version is in production and being able to roll back is essential.
Basic prediction logging comes fourth. Log inputs and outputs for every prediction. Store them somewhere you can analyze them. Even if you are not doing automated drift detection yet, this data is essential when you need to debug a production issue.
Automated retraining comes later. Once you have the above in place, you can add triggered or scheduled retraining and make the pipeline self-maintaining.
What Good Looks Like
The signal that your MLOps practice has matured is subtle but unmistakable. The data science team stops spending time debugging production issues and starts spending time on new model ideas. You know before your business stakeholders do when model performance is degrading. Retraining a model and getting it to production is measured in hours, not weeks. When something breaks, you have the logs, the feature distributions, and the model metadata to diagnose it in minutes rather than days.
The teams that get here do not get here by adopting more tools. They get here by being disciplined about the fundamentals: versioning everything, validating data at every stage, monitoring behavior rather than just uptime, and being explicit about who owns what. The tools help. The discipline is what actually makes it work.
This connects closely to the broader data observability discipline, which applies the same rigor to data pipelines that MLOps applies to model pipelines. If you are building MLOps practices, a solid data observability foundation is what you are building on top of.
ML in production is just software in production, with one extra dimension: the behavior depends not just on the code, but on the data the code was trained on, and both can change independently. MLOps is the engineering discipline that manages that complexity.
Get Cloud Architecture Insights
Practical deep dives on infrastructure, security, and scaling. No spam, no fluff.
By subscribing, you agree to receive emails. Unsubscribe anytime.