
I have a rule I share with every team I work with: if you can’t see it, you can’t fix it. I’ve been living by that rule since my first production incident in the early ’90s, and it’s never steered me wrong. The teams that invest in monitoring and logging are the teams that sleep at night. The teams that don’t are the teams that get surprised by their customers, and that’s never the kind of surprise you want.
I’ve seen monitoring done spectacularly well, and I’ve seen it done so badly that it was worse than having nothing at all. The difference usually isn’t tooling; it’s philosophy. So before we talk about tools and metrics and log formats, let me share the philosophy that’s kept me sane across three decades of production operations.
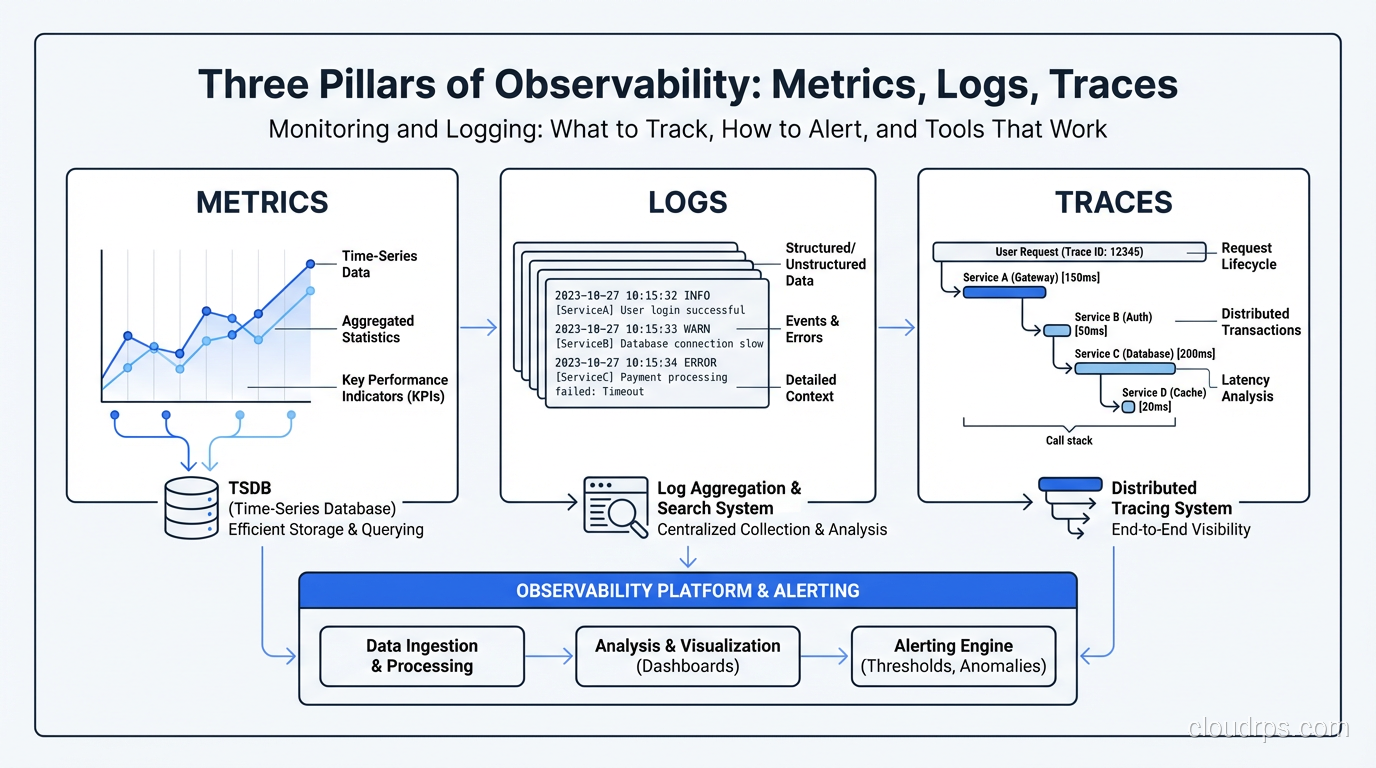
The Three Pillars of Observability
You’ve probably heard this framework before, but I want to give you the practitioner’s version, not the textbook version.
Metrics
Metrics are numerical measurements collected over time. CPU usage. Request count. Error rate. Response time percentiles. They’re cheap to collect, cheap to store, and incredibly powerful for understanding trends and detecting anomalies.
Metrics answer the question: “Is something wrong right now?” They’re your early warning system. When the error rate spikes from 0.1% to 5%, metrics tell you immediately. They don’t tell you why, and that’s what the other two pillars are for.
Logs
Logs are timestamped records of discrete events. A user logged in. A payment was processed. An error was thrown. They’re rich in detail but expensive to store and search at scale.
Logs answer the question: “What happened?” When your metrics tell you the error rate spiked, logs tell you it’s a NullPointerException in the payment processing module on lines served by a specific database connection pool.
Traces
Distributed traces follow a single request as it flows through multiple services. They show you the entire journey: which services were called, how long each call took, where the bottleneck is.
Traces answer the question: “Where did things go slow or break?” They’re the most recent addition to the observability toolkit, and they’ve fundamentally changed how I troubleshoot latency issues. For even deeper visibility, eBPF-based observability tools can capture kernel-level metrics and network flows without requiring any application instrumentation.
What to Monitor: The Metrics That Actually Matter
I’ve seen dashboards with 500 graphs, and I’ve seen dashboards with 5 graphs. The ones with 5 graphs are almost always more useful. The hardest part of monitoring isn’t collecting data; it’s deciding what data matters.
The Four Golden Signals
Google’s SRE book popularized this, and after years of using it, I agree it’s the right framework. Every service should track these four things:
Latency. How long requests take. Track percentiles, not averages. The average response time can be 200ms while 1% of your users are waiting 10 seconds. P50, P95, and P99 are your three critical latency metrics. If I could only pick one, I’d pick P99 because it tells you what your worst-off users are experiencing.
Traffic. How much demand your system is handling. Requests per second for web services. Messages per second for queues. Transactions per second for databases. This is your baseline. You need to know what normal looks like before you can detect abnormal.
Errors. The rate of failed requests. HTTP 5xx responses. Exception counts. Failed database queries. Track both the absolute count and the percentage. A jump from 10 errors per minute to 100 errors per minute means something very different when your traffic is 1,000 RPM versus 100,000 RPM.
Saturation. How full your system is. CPU utilization. Memory usage. Disk I/O. Database connection pool utilization. Thread pool saturation. This is your capacity warning system, and it tells you when you’re approaching limits.
Business Metrics Are Not Optional
Technical metrics tell you the system is healthy. Business metrics tell you the system is working. These are not the same thing.
I once worked on a system where all technical metrics were green: low latency, zero errors, normal traffic. But revenue had dropped 40% overnight. The root cause? A deployment had introduced a bug in the checkout flow that silently failed without throwing an error. The page just… didn’t work. Users would click “Buy” and nothing happened. No error, no log entry, nothing.
After that incident, I added business metrics to every monitoring stack I build:
- Orders per minute (for e-commerce)
- Signups per hour (for SaaS)
- API calls per customer (for platform businesses)
- Whatever metric directly represents your product delivering value
If your business metrics drop and your technical metrics are fine, you have a silent failure. These are the worst kind.
Infrastructure Metrics
Beyond your application, monitor the infrastructure it runs on:
- CPU, memory, disk, network for every host or container
- Database metrics: query latency, connections, replication lag, lock waits
- Queue metrics: depth, consumer lag, processing rate
- Cache metrics: hit rate, eviction rate, memory usage
For databases specifically, replication lag is the metric I watch most closely. A growing replication lag often indicates an impending performance crisis. I dive deeper into database performance monitoring in my performance tuning guide.
Logging: Doing It Right
I’ve spent more hours than I care to count staring at log files. Here’s what I’ve learned about making that time productive.
Structured Logging Is Non-Negotiable
If your logs look like this:
2025-09-15 14:23:45 INFO Processing payment for order #12345 from user john@example.com amount $99.99
You’re doing it wrong. That string is easy for a human to read and terrible for a machine to parse. When you need to search for all payments over $500, or all payments from a specific user, you’re writing fragile regex patterns.
Structured logging (JSON format) is the answer:
{"timestamp": "2025-09-15T14:23:45Z", "level": "INFO", "message": "Processing payment", "order_id": 12345, "user": "john@example.com", "amount": 99.99, "currency": "USD"}
Yes, it’s harder to read in a terminal. But it’s trivially easy to query, aggregate, and analyze at scale. Every modern log aggregation tool handles JSON natively. Make the switch. You’ll thank me later.
Log Levels: Actually Use Them Correctly
This sounds basic, but I still see teams where everything is logged at INFO level, or where DEBUG logging is turned on in production (and generating 50GB of logs per day).
- ERROR: Something failed and needs human attention. An unhandled exception. A critical external service is unreachable. Use this sparingly. If everything is an error, nothing is.
- WARN: Something unexpected happened but the system handled it. A retry succeeded. A cache miss forced a database query. A deprecated API was called.
- INFO: Normal but significant events. A user logged in. A batch job completed. A deployment started. This is your audit trail.
- DEBUG: Detailed diagnostic information. Variable values. Decision points. Only enable in production temporarily, for specific components, when investigating an issue.
Correlation IDs Are Essential
When a user clicks “Place Order” and your system makes twelve downstream calls to different services, you need a way to trace that entire flow. Generate a unique correlation ID (or request ID, or trace ID, whatever you want to call it) at the entry point and pass it through every service call. Include it in every log entry.
Without correlation IDs, troubleshooting a production issue in a distributed system is like finding a needle in a haystack where someone mixed in needles from twenty other haystacks.

Log Retention: A Practical Policy
You don’t need to keep every log entry forever. Here’s the retention policy I use:
- Hot storage (searchable, fast): 7-14 days. This covers your immediate troubleshooting needs.
- Warm storage (searchable, slower): 30-90 days. For investigating recurring issues or reviewing trends.
- Cold storage (archived, not searchable): 1-7 years. For compliance and audit requirements. Use cheap object storage.
The cost difference between these tiers is enormous. I’ve seen teams spending $50,000 per month on log storage because they kept everything in hot storage forever. The same data in a tiered approach costs $5,000.
Alerting: The Part Everyone Gets Wrong
Bad alerting is worse than no alerting. I mean that literally. An avalanche of false alerts trains your team to ignore alerts. Then a real alert fires and nobody notices. I’ve seen this pattern so many times it’s practically a law of nature.
Alert on Symptoms, Not Causes
This is the single most important alerting principle, and most teams get it backward.
Don’t alert on “CPU is above 80%.” Alert on “error rate exceeded 1%” or “P99 latency exceeded 2 seconds.” CPU at 80% might be perfectly normal during peak traffic. But a latency spike means users are suffering right now.
CPU is a cause. Latency is a symptom. Alert on what users experience. This principle is the foundation of SLO-based alerting: rather than alert on infrastructure metrics, you define Service Level Indicators that represent user experience, set Service Level Objectives, and alert on error budget burn rate. The SLO/SLI/SLA framework provides a rigorous way to implement exactly this approach at scale.
Every Alert Must Be Actionable
If an alert fires and the correct response is “acknowledge it and go back to sleep,” that alert shouldn’t exist. Every alert should have a clear, documented runbook response. If you can’t write a runbook for it, either automate the response or delete the alert.
I keep a simple rule: every alert gets reviewed monthly. If an alert fired more than five times in a month and never required human intervention, it gets downgraded to a dashboard metric or automated away. If an alert never fires, review whether it’s still relevant.
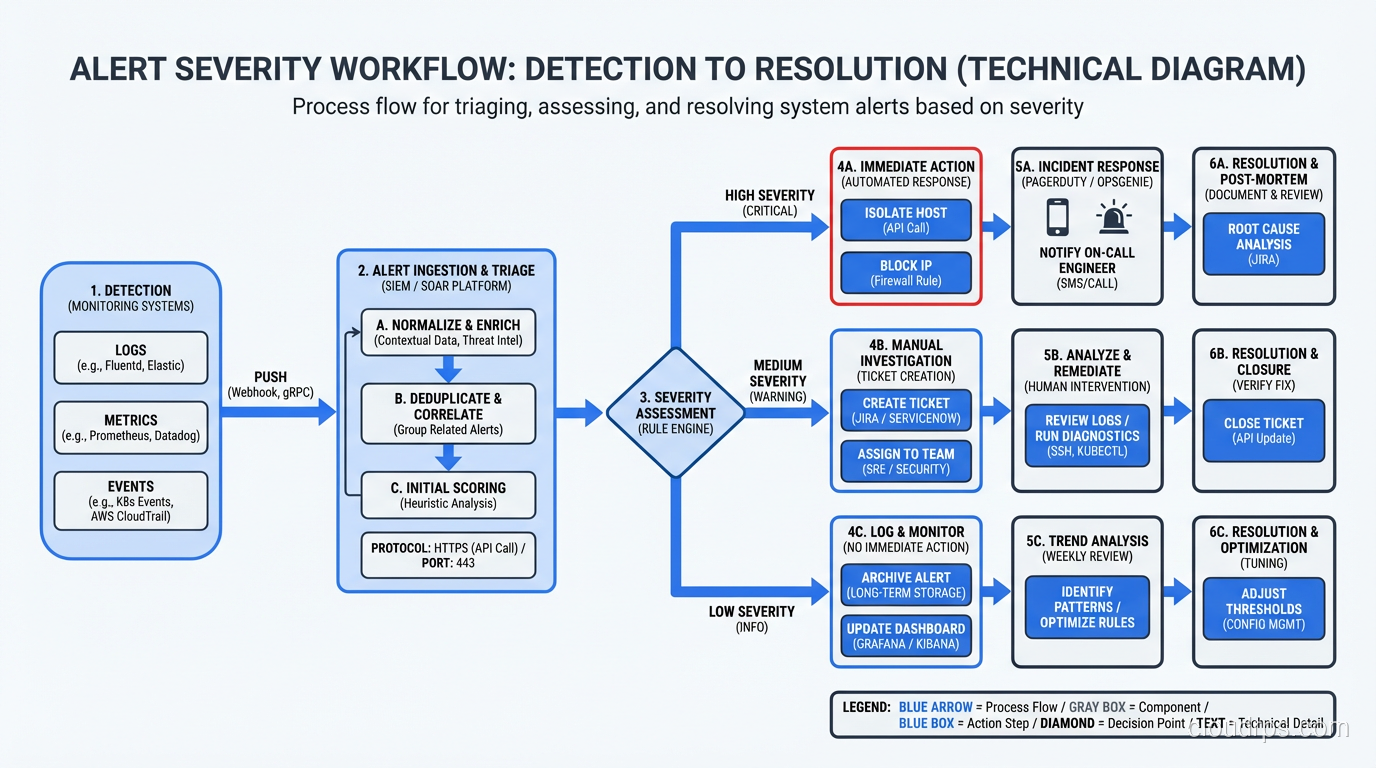
Severity Levels That Mean Something
- SEV1 / Critical: Revenue is being lost right now. Data is being corrupted. Security breach in progress. Wake someone up.
- SEV2 / High: Degraded service affecting users. Not a complete outage but noticeable. Respond within 15 minutes during business hours.
- SEV3 / Medium: Something is wrong but users aren’t affected yet. Saturation trending toward limits. Elevated error rate on a non-critical service. Respond within the business day.
- SEV4 / Low: Informational. Disk is 70% full. Certificate expires in 30 days. Address during normal work.
The most important boundary is between SEV1 and everything else. If an alert can wake someone up at 3 AM, it better be worth waking up for. Guard that boundary fiercely.
Alert Fatigue Is Your Enemy
I worked with a team that had 340 active alert rules. They were getting an average of 50 alerts per day. The on-call engineer’s entire job had become triaging alerts, most of which were noise. Morale was terrible. Turnover was high. And when a real incident happened, the critical alert was buried in the noise.
We spent two months restructuring their alerting. We ended up with 45 alert rules. Alerts dropped to 2-3 per day, and every single one required action. The on-call engineer could do actual work again. Response times to real incidents improved dramatically.
Tools I Actually Use and Recommend
I’m going to be direct here. These are tools I’ve used in production, not tools I’ve read about.
For Metrics
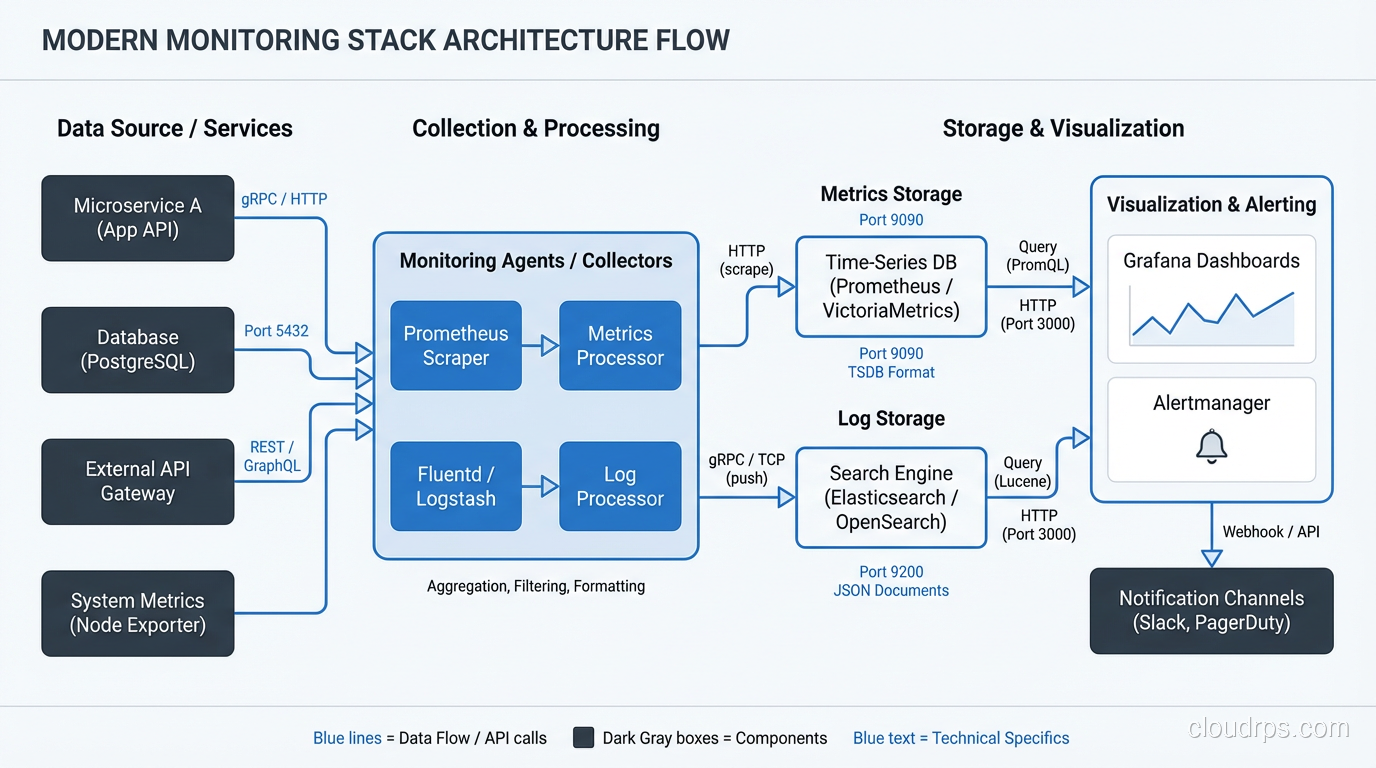
Prometheus + Grafana is my default stack for metrics. Prometheus is rock-solid, its query language (PromQL) is powerful once you learn it, and Grafana makes beautiful, functional dashboards. The combination is free, open-source, and has an enormous community. For most teams, this is the right answer.
Datadog is what I recommend when a team doesn’t want to operate their own monitoring infrastructure. It’s expensive, but it’s genuinely good. The unified platform for metrics, logs, and traces reduces operational overhead significantly. If your team is small and your time is valuable (and it always is), Datadog’s price is justified.
CloudWatch (AWS), Cloud Monitoring (GCP), Azure Monitor: these are adequate for basic infrastructure monitoring and reasonable if you’re deeply invested in a single cloud. But they’re not great as your primary application monitoring tool.
For Logs
Elasticsearch + Kibana (ELK stack) is the workhorse of log aggregation. I’ve run it for years. It works well but requires ongoing care and feeding. Elasticsearch clusters need tuning, and index management is a real operational concern.
Loki (from the Grafana folks) is my newer recommendation for teams starting fresh. It’s much simpler than Elasticsearch, integrates beautifully with Grafana, and stores logs far more efficiently because it indexes labels rather than full text. The trade-off is that full-text search is slower, but for most troubleshooting workflows, label-based filtering gets you to the right logs fast enough.
Datadog Logs and Splunk are the commercial options. Splunk is incredibly powerful but incredibly expensive. I recommend it for large enterprises with dedicated platform teams. For everyone else, it’s overkill.
For Traces
Jaeger or Zipkin if you want open-source. Datadog APM or New Relic if you want commercial. OpenTelemetry is becoming the standard for instrumentation, and I’d recommend adopting it regardless of which backend you choose, since it gives you the freedom to switch backends without re-instrumenting your code.
For Alerting
PagerDuty for incident management and on-call routing. It’s the standard for a reason. The escalation policies, schedules, and integrations are mature and reliable. OpsGenie is a solid alternative.
For the actual alert rules, use whatever your metrics platform provides: Prometheus Alertmanager, Datadog Monitors, Grafana Alerting. Keep the rules close to the data.
Building Your Monitoring Stack: A Practical Order
If you’re starting from scratch, here’s how I’d prioritize:
- Application metrics first. Instrument the four golden signals in your application. Use Prometheus client libraries (they exist for every major language) or OpenTelemetry.
- Infrastructure metrics second. Set up node exporters, container metrics, database metrics. This is usually easier because the tooling is more turnkey.
- Dashboards for both. Build a service-level dashboard with the four golden signals and an infrastructure dashboard with resource utilization. Use Grafana.
- Structured logging. Switch to JSON logging. Set up a log aggregation pipeline, even something simple like shipping logs to CloudWatch or Loki.
- Alerting on symptoms. Start with three alerts per service: error rate, latency, and availability. Tune thresholds based on actual baselines.
- Distributed tracing. Add this when you have multiple services and latency troubleshooting becomes difficult. OpenTelemetry is the standard instrumentation layer today; it decouples your code from your trace backend. See the OpenTelemetry and distributed tracing guide for a practical implementation walkthrough including sampling strategy and Collector configuration.
- Business metric dashboards. Add these as soon as you know what your key business metrics are.
This approach builds your observability muscle incrementally. Each step provides immediate value and informs the next step. Don’t try to boil the ocean. I’ve seen too many “observability initiatives” that tried to do everything at once and delivered nothing.
Solid monitoring is also a prerequisite for any serious high-availability architecture. You cannot design for availability if you cannot measure it.
The Cultural Part
I’ll end with something that took me a long time to learn. Monitoring is not the ops team’s job. It’s everyone’s job. The developer who writes the code is the person best equipped to instrument it. They know what matters, what can go wrong, and what data would help them debug it.
Build a culture where adding monitoring is part of shipping a feature. Not an afterthought. Not a follow-up ticket. Part of the definition of done. Every pull request that adds a new feature should include metrics, log entries, and dashboard updates.
The teams that do this well are the teams that detect problems before their users do. And in my experience, that’s the single biggest differentiator between good operations and great operations. One practice that ties directly into strong observability is chaos engineering, where you deliberately inject failures and use your monitoring stack to validate that your alerts and dashboards actually catch the problems you think they will.
Get Cloud Architecture Insights
Practical deep dives on infrastructure, security, and scaling. No spam, no fluff.
By subscribing, you agree to receive emails. Unsubscribe anytime.