The first time I saw an observability bill that exceeded the infrastructure bill it was supposed to monitor, I thought it was a mistake. This was about eight years ago at a mid-sized e-commerce platform. The team had enthusiastically instrumented every service, sent every log line to Splunk, and shipped every metric at 10-second resolution across a 200-service environment. The bill was real. The CFO was not amused.
We fixed it by building a telemetry pipeline, kludged together with Logstash and some creative Prometheus remote_write routing. It worked, but we maintained it forever and nobody understood it except the two engineers who built it. Today that problem has a name (observability pipeline), real tools (OpenTelemetry Collector, Cribl, Vector), and patterns that actually scale. After twenty years of building cloud infrastructure, this is one of the architectural layers I now treat as mandatory above a certain scale, not optional.
Why You Need a Pipeline Between Your Apps and Your Backends
The naive model for observability is straightforward: instrument your application, point it at your backend (Datadog, New Relic, Splunk, whatever you use), done. That model works for small setups and it is what most tutorials show you. It breaks down in three ways as you scale.
Cost. Every byte you send to a commercial SaaS observability platform costs money, typically $1.50 to $3.00 per GB ingested. Object storage costs about $0.023 per GB. The difference between sending everything and sending what you actually need for debugging can be a 10x cost reduction. In 2026, with AI workloads generating massive volumes of inference traces and token-level metrics, this gap has gotten significantly wider. A platform running 1,000 LLM requests per second with full trace capture at no sampling is not a hypothetical; I have seen it deployed, and the observability cost dwarfed the GPU cost for the first two months until someone noticed.
Vendor lock-in. If your application emits logs directly to Splunk’s format or traces directly to Datadog’s agent, switching vendors requires re-instrumenting every service. That is a multi-month project in a large environment. A pipeline layer decouples instrumentation from destination. The same telemetry can route to multiple backends, or you can swap backends without touching application code.
Data quality and compliance. Production systems generate a lot of noise: health check logs, debug statements someone forgot to remove, high-cardinality metrics that will never get queried. In regulated industries, certain data (PII in request bodies, authentication tokens that leak into debug logs) should never reach your observability backend in the first place. A pipeline is where you scrub, filter, and enrich before data ever leaves your environment.
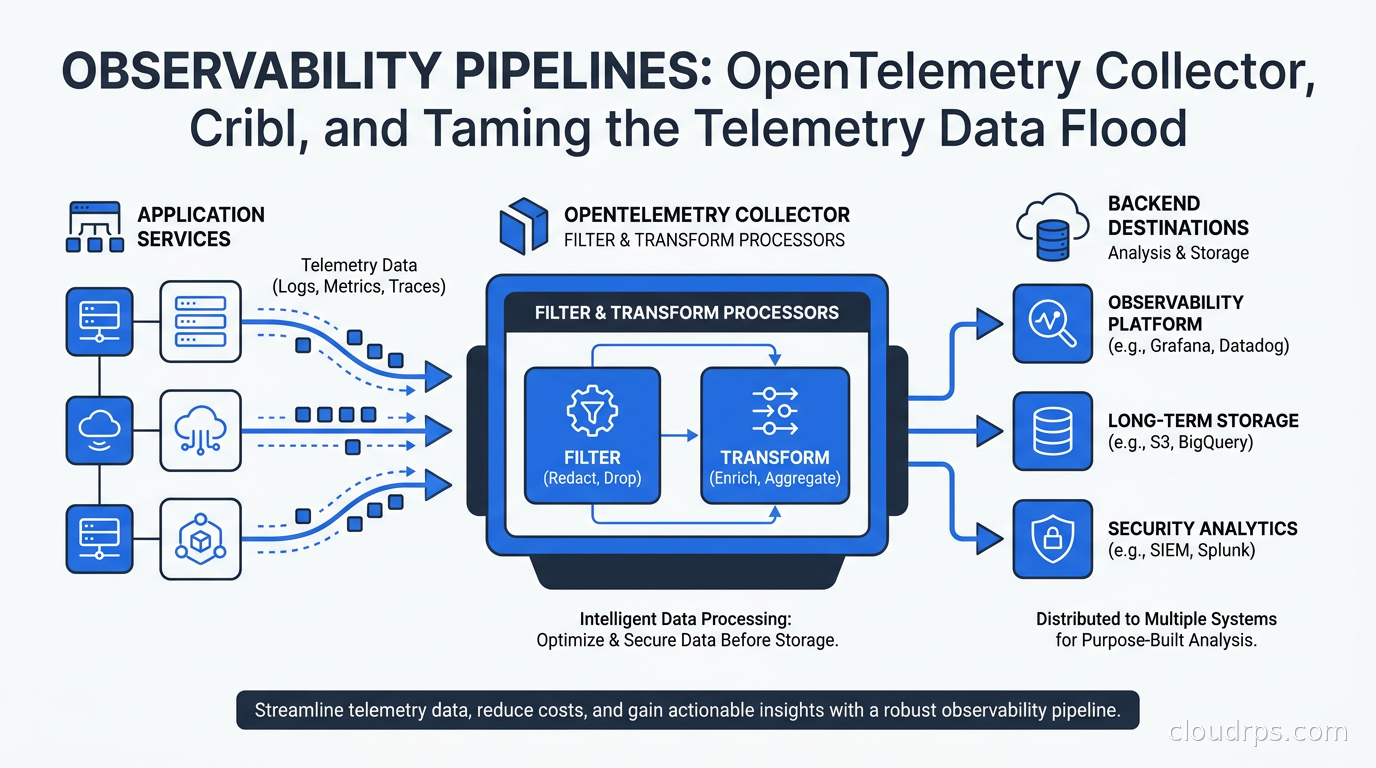
An observability pipeline sits between your application and your backends. It receives telemetry, applies transformations, and routes the result to one or more destinations.
The OpenTelemetry Collector: Architecture First
The OpenTelemetry Collector is the CNCF-maintained, vendor-neutral pipeline component that has become the default choice for most organizations. If you have read the site’s earlier article on OpenTelemetry and distributed tracing, you know the OTel project standardized instrumentation SDKs across languages. The Collector is the infrastructure half of that story: where the data flows after it leaves your SDK.
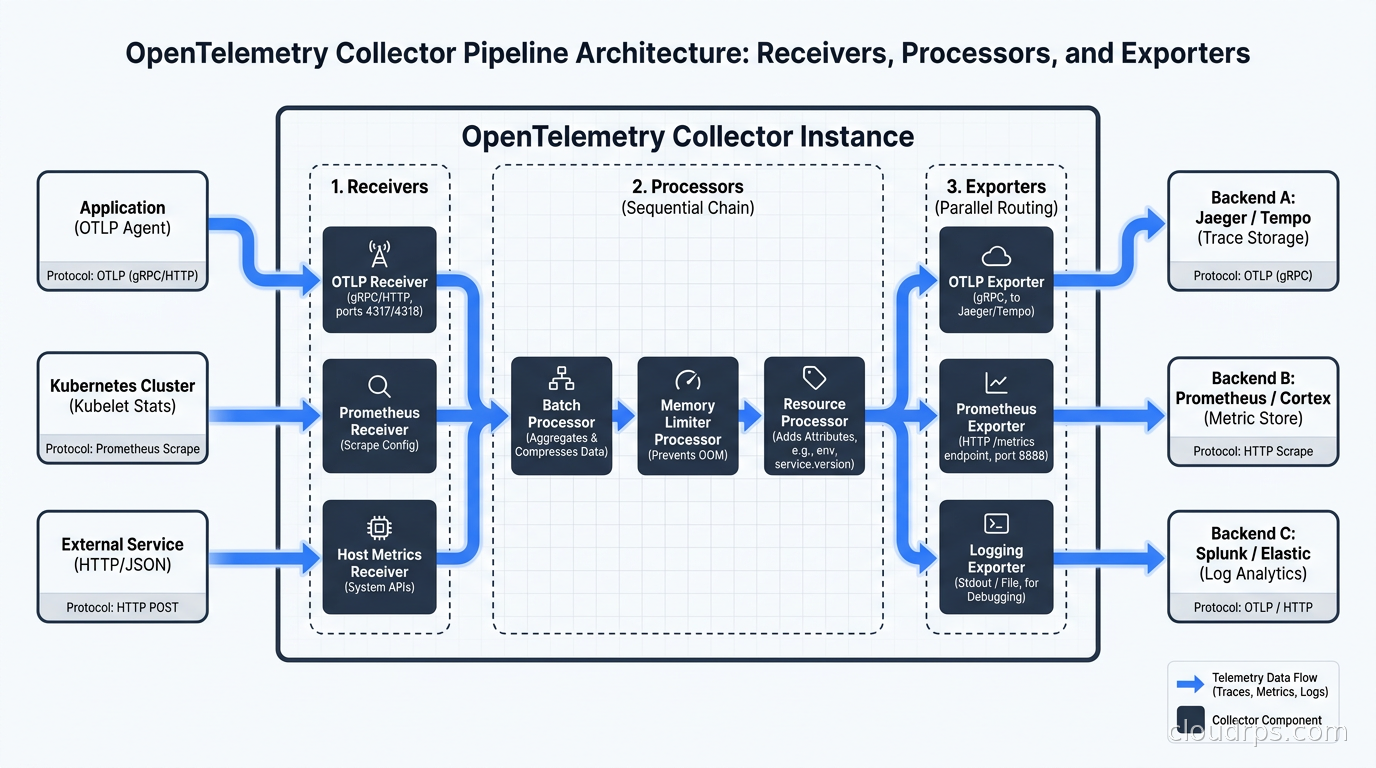
The Collector’s architecture has three stages.
Receivers accept telemetry data. There is an OTLP receiver (which accepts traces, metrics, and logs in OpenTelemetry’s native protocol over gRPC or HTTP), a Prometheus scrape receiver, a Jaeger receiver for legacy tracing systems, a Fluent Forward receiver for log aggregation, syslog, AWS CloudWatch, Kafka, and dozens more. You can run multiple receivers simultaneously in a single Collector instance.
Processors transform, filter, enrich, and batch the data. This is where the interesting work happens. Processors chain together in a named pipeline and operate on telemetry before it exits.
Exporters send processed telemetry to one or more backends. There are exporters for every major observability platform: Datadog, Splunk, New Relic, Prometheus remote_write, Loki, Jaeger, Tempo, Elasticsearch, S3, and many more. The OTLP exporter sends to any OTLP-compatible backend, which includes most modern platforms.
A minimal pipeline configuration in YAML looks like this:
receivers:
  otlp:
    protocols:
      grpc:
        endpoint: 0.0.0.0:4317
      http:
        endpoint: 0.0.0.0:4318
  prometheus:
    config:
      scrape_configs:
        - job_name: 'app-metrics'
          static_configs:
            - targets: ['localhost:8080']

processors:
  batch:
    timeout: 10s
    send_batch_size: 1000
  memory_limiter:
    limit_mib: 512

exporters:
  otlp:
    endpoint: tempo:4317
    tls:
      insecure: true
  prometheusremotewrite:
    endpoint: http://prometheus:9090/api/v1/write

service:
  pipelines:
    traces:
      receivers: [otlp]
      processors: [memory_limiter, batch]
      exporters: [otlp]
    metrics:
      receivers: [otlp, prometheus]
      processors: [memory_limiter, batch]
      exporters: [prometheusremotewrite]
Always include the memory_limiter processor before any other processors in the chain. I have seen Collectors OOM-crash under log spikes because someone forgot it, taking down the observability layer precisely when you need it most during an incident.
Processors: Where the Cost Reduction Lives
The batch processor is table stakes. The processors that actually reduce cost and improve signal quality are:
filter processor: Drops telemetry that matches a condition. Want to drop all HTTP 200 health check traces? Drop debug logs from a noisy third-party library? This is the most immediate cost lever.
processors:
  filter:
    traces:
      span:
        - 'attributes["http.route"] == "/health"'
        - 'attributes["http.route"] == "/ready"'
    logs:
      log_record:
        - 'severity_number < SEVERITY_NUMBER_INFO'
transform processor: Uses OTTL (OpenTelemetry Transformation Language) to modify attributes. You can rename fields for backend compatibility, redact PII from log bodies, add environment tags, or compute derived attributes from existing ones.
processors:
  transform:
    log_statements:
      - context: log
        statements:
          - replace_pattern(body, "\\b\\d{4}[- ]?\\d{4}[- ]?\\d{4}[- ]?\\d{4}\\b", "REDACTED_CC")
          - set(attributes["environment"], "production")
          - set(attributes["team"], resource.attributes["service.team"])
OTTL is powerful but the documentation is not always clear on edge cases. The best way to learn it is to run the Collector locally with the debug exporter enabled and iterate on your transformations against real data before deploying. The debug exporter prints every event to stdout, which makes it easy to verify your transforms are doing what you expect.
probabilistic_sampler and tailsampling processors: For traces, head-based sampling makes a keep or drop decision when the trace starts. Tail-based sampling makes the decision after the trace completes, which means you can always keep traces that had errors or high latency (the ones you actually care about) and sample down the successful fast ones.
The tailsampling processor is one of the highest-value components in the Collector for high-traffic services. A policy that keeps 100% of error traces and 5% of successful traces can reduce trace storage by 60-80% while retaining almost all diagnostic value.
processors:
  tail_sampling:
    decision_wait: 10s
    policies:
      - name: errors-policy
        type: status_code
        status_code: {status_codes: [ERROR]}
      - name: slow-traces-policy
        type: latency
        latency: {threshold_ms: 1000}
      - name: probabilistic-policy
        type: probabilistic
        probabilistic: {sampling_percentage: 5}
resource processor: Adds or overrides resource attributes. Essential for attaching cluster name, namespace, region, or team ownership when your application does not emit those. Consistent metadata on every piece of telemetry makes downstream queries dramatically simpler.
routing connector: In newer Collector versions, connectors bridge pipelines and allow you to route telemetry to different downstream pipelines based on attribute values. Route PCI-scoped traces to an isolated backend, route high-priority logs to real-time alerting while sending everything else to cheap object storage. This pattern is where the Collector starts to look genuinely powerful rather than just a forwarding agent.
Deployment Patterns: Agent and Gateway
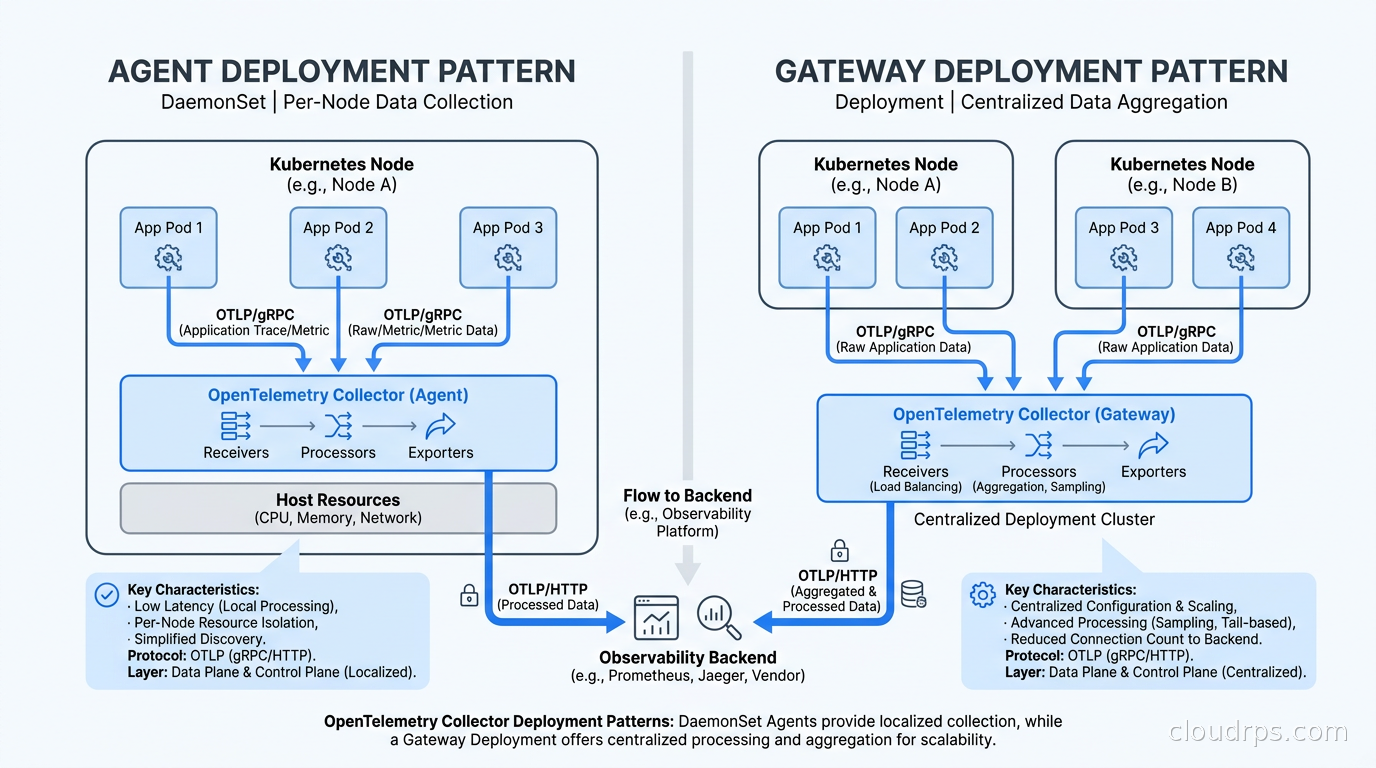
You can deploy the Collector in two topologies, and in production you almost always want both running together.
Agent mode: A Collector instance runs as a DaemonSet in Kubernetes (one per node) or as a sidecar. It receives telemetry from applications on that node, does lightweight processing (attribute injection, basic filtering), and forwards upstream. Agents are close to the data source and add minimal latency. They should do minimal work because they share compute with your application workloads.
Gateway mode: A central Collector deployment receives telemetry from all agents. This is where you run expensive processing: tail-based sampling (which needs to see the complete trace before deciding), PII redaction, heavy transformation, and fan-out to multiple backends. Gateways scale independently from your application nodes.
The agent sends upstream to the gateway using OTLP/gRPC. The gateway handles everything else. This pattern keeps agents thin and puts CPU-intensive logic on dedicated infrastructure you can tune independently.
In Kubernetes, the OpenTelemetry Operator (installed via Helm) manages agent DaemonSets and gateway Deployments using the OpenTelemetryCollector CRD, which handles config management and rolling restarts. One subtlety: gRPC uses long-lived connections, so a standard round-robin LoadBalancer will route all traffic to the first gateway pod and ignore the rest. You need either a headless service with client-side load balancing, or the loadbalancingexporter with consistent hashing configured so tail-sampling decisions stay consistent per trace ID.
For the Prometheus, Loki, and Grafana stack that most teams run for storage and visualization, the Collector gateway fits naturally as the ingestion layer: metrics pipeline writes to Prometheus remote_write, traces go to Tempo, logs go to Loki. Single pipeline, multiple backends.
Where the Collector Reaches Its Limits
The Collector is excellent for the OTLP-native world but has genuine gaps. Parsing complex log formats (multi-line Java stack traces, unstructured syslog, vendor-proprietary formats) requires custom stanzas in the filelog receiver that become unwieldy past a few hundred lines of config. The management plane is a YAML file with no visual editor, no preview of what a transform does to sample data, and no easy A/B testing of config changes.
Scaling also gets tricky when you are processing hundreds of gigabytes per day. The tail-sampling processor requires sticky routing because traces must hit the same Collector instance for consistent decisions. Getting this right in Kubernetes requires either session affinity or the loadbalancingexporter with consistent hashing, and neither is obvious from the documentation. I have seen teams spend a week debugging partial trace data before realizing their load balancer was hashing incorrectly.
For very large environments, heterogeneous data sources, or teams that need a governance-friendly management plane, this is where Cribl enters the picture.
Cribl Stream: When You Need More
Cribl Stream is a commercial observability pipeline platform that receives data from almost any source (syslog, Splunk forwarders, Kafka, S3, Kinesis, CloudWatch, Elastic Beats, and OTLP) and routes it to almost any destination. The architecture is similar to the Collector: sources, routes, pipelines, destinations. The operator experience is completely different.
Cribl has a web UI where you build pipelines visually, preview the effect of each transformation step on a sample of real data before deploying, do controlled rollout of config changes, and monitor per-pipeline throughput and cost reduction in real time. The interface shows bytes in vs bytes out per pipeline, which makes it straightforward to quantify the ROI of each filtering rule. This matters enormously when you are justifying the tool to a cost-conscious leadership team.
The features that specifically push teams toward Cribl over the OTel Collector in my experience are these. Replay: Cribl buffers data to S3 and can replay it to new destinations. Useful when you add a new backend mid-incident, or when you realize three days later that you should have sent certain logs to your SIEM. PII detection and redaction with preview: built-in pattern libraries for common sensitive data formats, with a preview pane that shows exactly what gets redacted before the rule goes live. Security teams find this much easier to audit than OTTL expressions in YAML. Lookup tables: enrich events with data from CSV files or databases (CIDR ranges to geography, hostname to team owner, IP address to threat intelligence) without writing custom processors. Worker pools: Cribl’s distributed mode uses a Leader/Worker architecture that scales linearly and does not require you to solve consistent hashing for tail-based sampling yourself.
Cribl is not free. Pricing is based on throughput (GB/day). For most organizations I have worked with, the break-even point where Cribl’s total cost of ownership beats the engineering time spent maintaining complex OTel Collector configs is somewhere around 50-100 GB/day of telemetry. Below that, the Collector with careful YAML management is the right answer.
Vector: The Rust Alternative
Vector is a pipeline tool built in Rust, originally from the company Timber and now maintained by Datadog. It is fast, with meaningfully lower CPU and memory usage than the OTel Collector at equivalent workloads in benchmark comparisons, and has a well-designed transformation language. VRL (Vector Remap Language) reads more like a real programming language than OTTL: error handling, type coercion, and pattern matching are first-class features.
Vector’s strength is log processing. The VRL for complex log transformation handles multi-line events, conditional logic, and regex extraction in ways that feel natural rather than awkward. If you are dealing with complex unstructured log parsing from legacy systems or custom application formats, VRL gets you there faster.
The weakness is that Vector’s native metric format is not OTLP. If your whole stack is OTel-native (the direction the industry is clearly moving), the Collector is a better fit. Vector has OTLP input and output support but it is a secondary concern compared to the native format.
Many teams run Vector as the log collector on nodes (parsing files, doing initial enrichment) and the OTel Collector as the central gateway for unified processing. They are complementary tools. Think of Vector as purpose-built for log collection and transformation, and the Collector as the OTLP-native aggregation and routing layer.
Real Cost Numbers
Let me give you concrete numbers from a real architecture.
A 200-service microservices platform generating approximately 150 GB per day of raw telemetry: logs, metrics, and traces. Before introducing a pipeline, the cost structure looked like this: all 150 GB per day going to Datadog at about $2 per GB ingested came to $3,000 per day, roughly $90,000 per month. Full-resolution trace storage at no sampling added another $25,000 per month. Total: around $115,000 per month in observability spend.
After deploying an OTel Collector gateway with four targeted rules:
- Drop HTTP 200 access logs for health check and readiness probe requests (saves about 20 GB per day)
- Drop DEBUG and TRACE level logs in production (saves about 30 GB per day)
- 10% probabilistic sampling on traces with 100% retention for error traces (saves about 60 GB per day of trace data)
- Downsample high-resolution metrics from non-critical batch jobs to 60-second resolution (saves about 15 GB per day)
Result: 150 GB per day reduced to roughly 25 GB per day reaching Datadog. Monthly cost dropped from $115,000 to about $22,000. The pipeline infrastructure (a few Kubernetes pods) cost under $500 per month in compute. The engineering time to build and tune it was about two weeks for two engineers. That investment paid back in less than three weeks of savings.
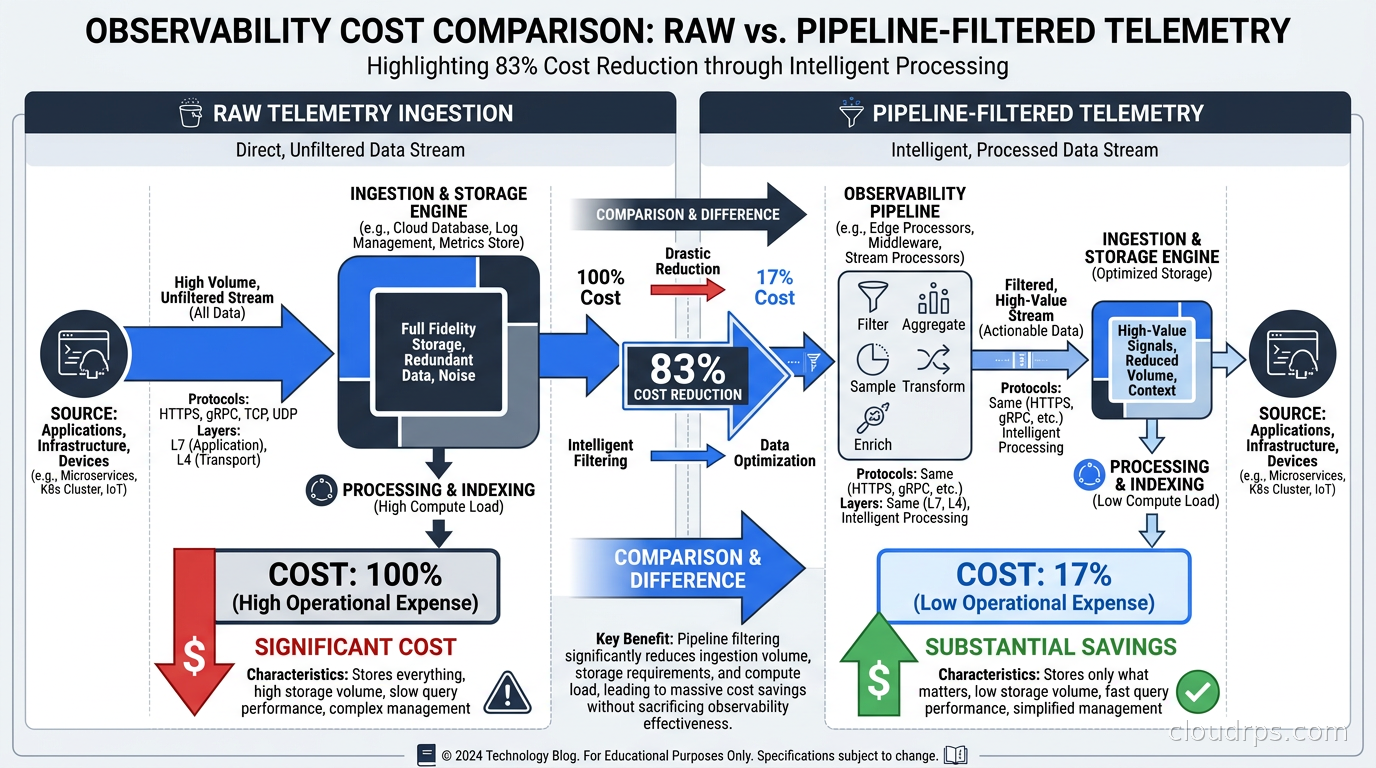
The key insight: this reduction does not meaningfully reduce observability. It eliminates noise. The 30 GB per day of DEBUG logs were never going to help debug a production incident. Health check traces contained no useful information. High-resolution metrics for internal batch jobs served only capacity planning, which works fine at 60-second resolution. This is what I mean by instrument aggressively, filter deliberately. The principle in monitoring and logging best practices applies: what you instrument and what you persist are separate decisions.
Routing to Multiple Backends
One pattern I use frequently in larger organizations: dual-destination routing based on service tier. Critical production services route traces to both the expensive SaaS platform (Datadog, New Relic) for fast incident response and a self-hosted Tempo instance for long-term retention. Non-critical services route only to the self-hosted stack.
The result: your on-call engineers have the polished SaaS experience for the services that page them at 3am, and you cut the SaaS bill by 60-70%. The routing decision lives in the pipeline configuration, not in application code. No developer has to think about it.
This pattern is especially relevant for AI and LLM observability. At 1,000 inference requests per second with full trace capture, you are generating substantial volumes of telemetry. Route a 5% sample with all error traces to your SaaS platform for real-time dashboards and alerting, and route everything to object storage for post-hoc analysis and fine-tuning diagnostics. The cost difference is significant.
The networking side of this also matters. Telemetry data crosses availability zones and sometimes regions before it reaches your SaaS vendor. Those cloud egress costs compound on top of the ingestion charges. Centralizing your Collector gateway in the same region as your observability backend, and using VPC endpoints where available, can knock another 15-20% off the total cost.
Choosing the Right Tool
OTel Collector (self-managed): Best choice when you are all-in on OpenTelemetry, have a relatively homogeneous Kubernetes environment with standard instrumented services, and your team is comfortable managing YAML configuration. Free, vendor-neutral, integrates with the entire CNCF ecosystem, and the right starting point for almost everyone.
Cribl Stream: Choose it when you have heterogeneous data sources (Splunk forwarders, syslog from network devices, CloudWatch), need a management UI that non-engineers can use for pipeline changes, have strict compliance requirements that benefit from visual PII redaction preview, or are processing more than 50-100 GB per day where the operational cost of managing OTel Collector YAML at scale becomes a real burden.
Vector: Choose it when log parsing is your primary use case and you value the cleaner VRL transformation language. Also a strong performance choice when you have compute constraints; the Rust implementation is noticeably more efficient. Pairs well with the OTel Collector as a log collection layer feeding into an OTLP-native central pipeline.
Getting Started
For a Kubernetes-native team, here is the path I would follow. Install the OpenTelemetry Operator via Helm. It adds a CRD for OpenTelemetryCollector objects and manages agent DaemonSets and gateway Deployments without hand-rolling manifests.
Deploy an agent DaemonSet that receives OTLP from application pods and forwards to a gateway. Keep the agent config minimal: OTLP receiver, memory_limiter, batch processor, OTLP exporter pointing at the gateway.
Deploy a gateway Deployment with two or three replicas. This is where your filter, transform, tailsampling, and routing config lives. Start with just the filter processor dropping health check traces. Measure cost impact after a week. Add more rules incrementally.
When your gateway config approaches 200 lines of YAML and you start worrying about whether a new transform rule will break production, that is the right moment to evaluate Cribl or a more structured management approach.
The observability pipeline is not optional at scale. With AI workloads generating telemetry at rates that would have seemed outlandish five years ago, shipping every byte to a SaaS platform is a choice that will eventually require a difficult conversation with whoever approves your cloud budget. The tools exist, they work, and the investment pays back in weeks. For the data pipeline side of your infrastructure, the same discipline applies: instrument aggressively, filter deliberately, route intelligently. The principle is universal whether the data is telemetry or business events.
If you are using continuous profiling alongside your traces and logs, the same pipeline architecture applies. Profiling data volumes are typically lower than log volumes, but routing profiles to a self-hosted Pyroscope instance while shipping only sampled data to your commercial backend follows the same pattern: keep the expensive tools for the signal that matters most in the heat of an incident.
Get Cloud Architecture Insights
Practical deep dives on infrastructure, security, and scaling. No spam, no fluff.
By subscribing, you agree to receive emails. Unsubscribe anytime.