Three years ago I was on-call for a system with 40 microservices and no distributed tracing. A request would come in through the API gateway, bounce through four services, hit a database, call two external APIs, and occasionally return an error with a latency spike. Finding the culprit meant grep-ing through logs in four different Kubernetes namespaces with a flashlight and a prayer. I’ve blocked out some of the memories.
Distributed tracing solves a problem that logs and metrics can’t: it answers “what happened to this specific request, step by step, across every service it touched?” OpenTelemetry has become the standard way to get there, and if you’re still not using it in 2026, the gap is costing you incident time.
The Three Pillars, and Why Tracing Is Different
Observability is often described as logs, metrics, and traces. That framing is useful but can make tracing seem like the third wheel after you’ve already got Prometheus and ELK deployed. It’s not. Each pillar answers fundamentally different questions.
Metrics tell you about the health of your system in aggregate: request rate, error rate, latency percentiles, CPU usage. They’re cheap to collect and store, and they’re excellent for dashboards and alerting. The limitation: metrics are aggregated and dimensionally bounded. When p99 latency spikes, metrics tell you something is wrong but not what, where, or why.
Logs capture discrete events as they happen, with free-form context. They’re powerful for debugging specific known failure modes, but they’re expensive at scale, they’re per-service rather than per-request, and correlating logs across services requires you to propagate trace IDs manually (which most teams don’t do consistently).
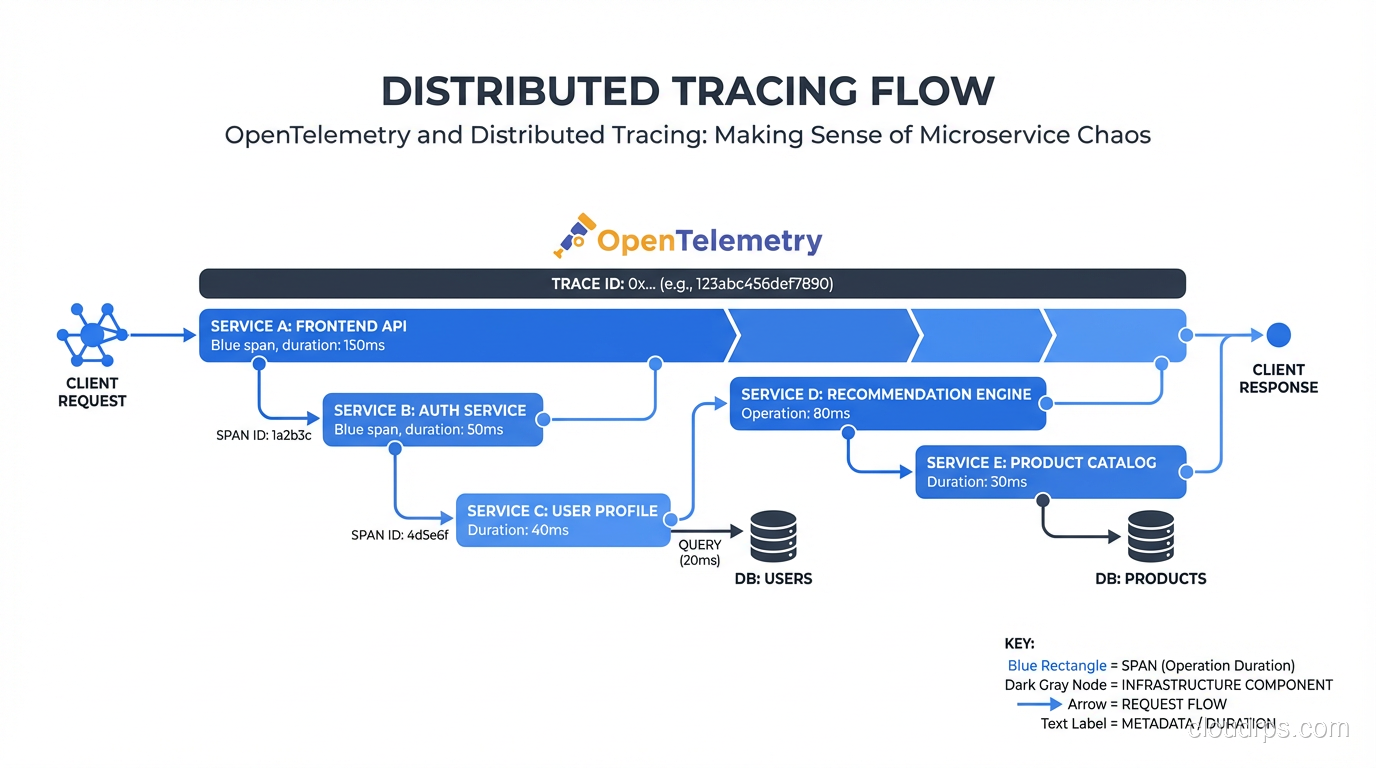
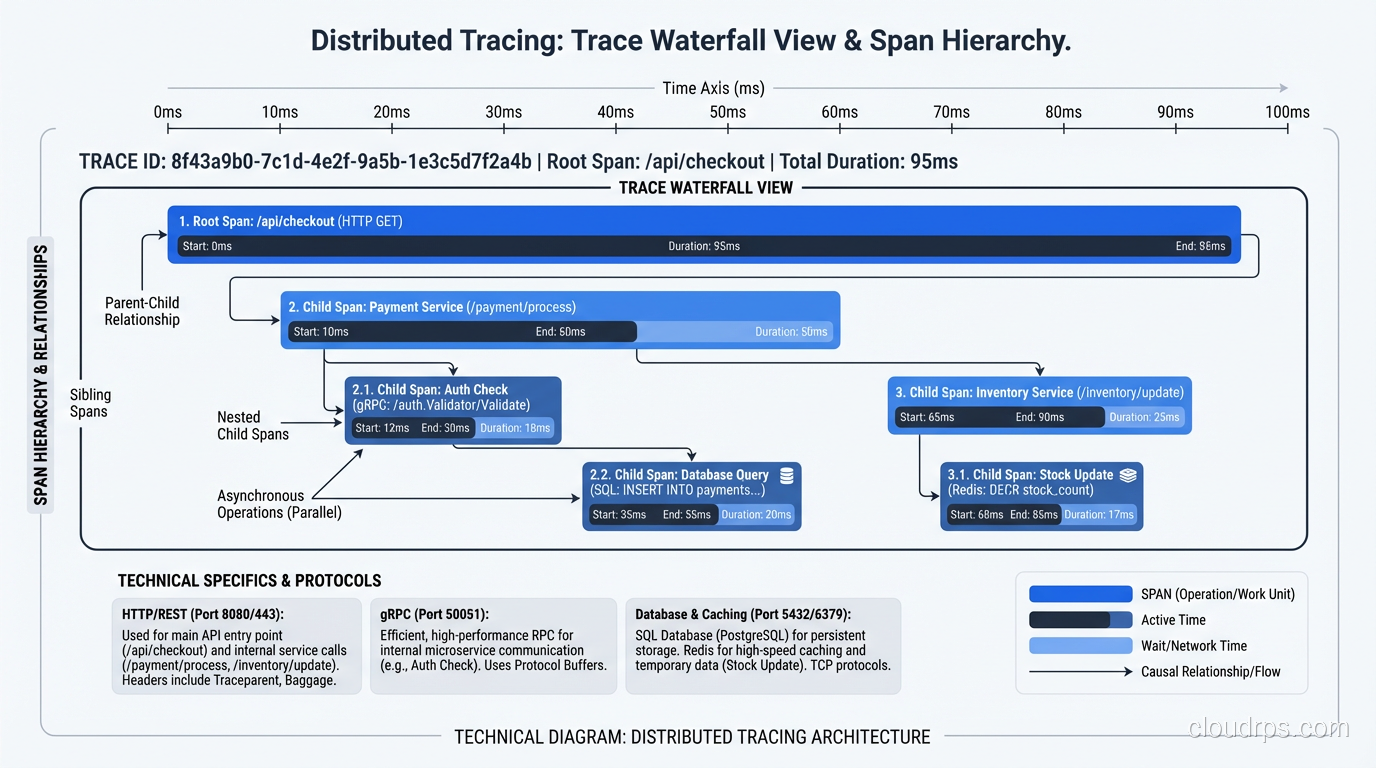
Traces model a request as a tree of spans. Each span represents a unit of work: an HTTP handler, a database query, an external API call. Spans carry timing, status, and attributes, and they’re causally linked to their parent span. The result: you can follow a single request from ingress to database and see exactly where 450ms of latency came from. No guessing, no correlation by timestamp.
These aren’t redundant. You need all three. The monitoring and logging guide covers the metrics and logs sides; this article is about making traces actually useful.
What OpenTelemetry Is (and Isn’t)
OpenTelemetry is a CNCF project that provides vendor-neutral APIs, SDKs, and a collector for generating, collecting, and exporting telemetry data. Before OTel, every observability vendor had their own SDK. You instrumented your code against the Datadog SDK or the Zipkin SDK, and switching backends meant ripping out instrumentation from every service. OTel breaks that coupling.
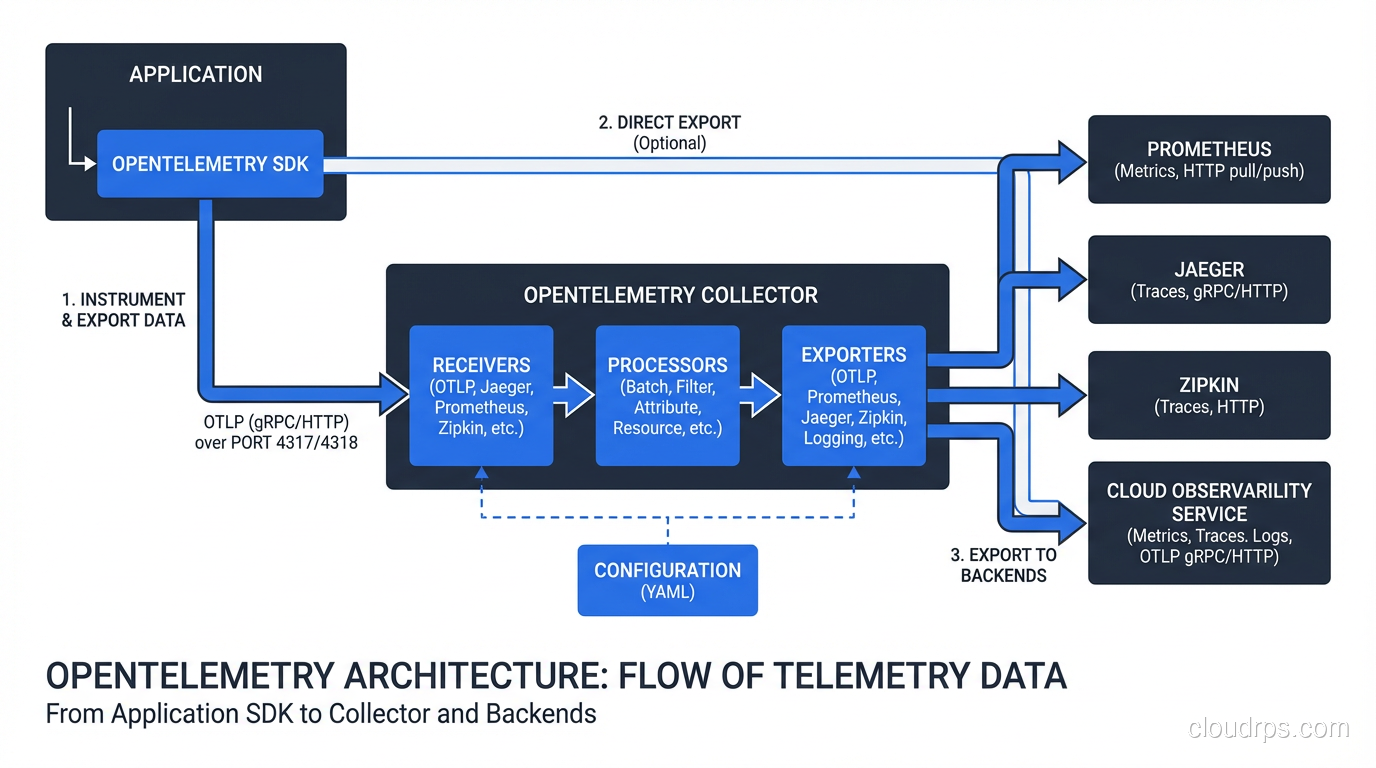
The architecture has three main components:
The API and SDK: Language-specific libraries for instrumenting your code. OTel provides auto-instrumentation for major frameworks (Express, Django, Spring, gRPC) that hooks into popular libraries without code changes. For custom spans, you use the SDK directly.
The Collector: A standalone service that receives telemetry from your applications, processes it (filtering, sampling, enriching), and exports to backends. You can run the Collector as a sidecar, as a DaemonSet in Kubernetes, or as a centralized gateway. It supports dozens of export formats: Jaeger, Zipkin, Prometheus, OTLP, vendor-specific formats.
The Protocol (OTLP): The OpenTelemetry Protocol, a gRPC and HTTP-based protocol for transmitting telemetry. OTLP is becoming the default transport between every component in the observability stack.
OTel is not a backend. It doesn’t store or visualize your traces. You need a separate trace store, typically Jaeger, Grafana Tempo, or a vendor like Honeycomb or Datadog. OTel just standardizes how data gets there.
Instrumenting Your First Service
Let me walk through what this actually looks like. Here’s a Go service being instrumented with OTel:
// Initialize tracer provider
tp, err := newTracerProvider("user-service", "http://otel-collector:4318")
defer tp.Shutdown(ctx)

otel.SetTracerProvider(tp)
otel.SetTextMapPropagator(propagation.NewCompositeTextMapPropagator(
    propagation.TraceContext{},
    propagation.Baggage{},
))

// In your HTTP handler
tracer := otel.Tracer("user-service")

func GetUser(w http.ResponseWriter, r *http.Request) {
    ctx, span := tracer.Start(r.Context(), "GetUser",
        trace.WithAttributes(
            attribute.String("user.id", r.PathValue("id")),
        ),
    )
    defer span.End()

    user, err := db.GetUser(ctx, r.PathValue("id"))
    if err != nil {
        span.RecordError(err)
        span.SetStatus(codes.Error, err.Error())
        http.Error(w, "not found", 404)
        return
    }

    span.SetAttributes(attribute.Bool("user.found", true))
    json.NewEncoder(w).Encode(user)
}
The ctx propagation is the key piece. Every function call that does meaningful work should receive this context and create child spans from it. When your HTTP client makes a downstream call, the OTel HTTP client instrumentation automatically injects the trace context into the request headers, so the receiving service can continue the trace.
That header propagation is how the magic works. The W3C TraceContext headers (traceparent and tracestate) carry the trace ID and parent span ID. Every compliant service reads these headers, continues the trace, and reports spans to its configured backend. The trace backend correlates them all by trace ID into a single timeline.
Auto-instrumentation simplifies this significantly. For a Python Django app:
pip install opentelemetry-distro opentelemetry-exporter-otlp
opentelemetry-bootstrap -a install
Then run your app with:
OTEL_SERVICE_NAME=order-service \
OTEL_EXPORTER_OTLP_ENDPOINT=http://otel-collector:4318 \
opentelemetry-instrument python manage.py runserver
That’s it. OTel auto-instruments Django views, database queries, Redis calls, HTTP clients, and more without any code changes. The result: every request automatically generates a detailed trace.
Sampling: Don’t Trace Everything
A production service doing 10,000 requests per second generates an enormous amount of trace data. Storing all of it is economically untenable and unnecessary. You need sampling.
There are three main approaches:
Head-based sampling makes the sampling decision at the start of a trace, before any spans are generated. The classic version is probability sampling: trace 1% of requests. The problem: that 1% includes mostly successful requests, and the rare failures you actually care about might not be sampled.
Tail-based sampling defers the decision until the entire trace is complete. The OTel Collector supports tail sampling processors that let you say: “always sample traces with errors, always sample traces over 500ms, sample everything else at 1%.” This is the right approach for production systems. It requires buffering traces in the Collector, which adds memory requirements, but the observability improvement is worth it.
Adaptive sampling (supported by some vendors like Honeycomb) automatically adjusts sample rates based on traffic patterns to maintain a target volume of traces. Less operational burden than manual tail sampling configuration.
For most teams, I recommend starting with tail-based sampling in the Collector with these rules:
- Always sample: errors, latency over 1s, specific critical endpoints
- Rate-limit sample: 5-10% of successful fast requests
This ensures you never miss a failure while keeping storage costs manageable.
The Collector: More Than a Data Forwarder
The OTel Collector looks like a simple proxy but has significant processing capabilities that are worth using.
Filtering and sampling processors: Remove spans you don’t care about (health checks, internal probes), apply tail-based sampling logic.
Attribute processors: Add, remove, or transform span attributes. Useful for PII scrubbing: if your services accidentally include user emails in span attributes, you can drop those attributes in the Collector rather than changing every service.
Batch processor: Buffer spans and export in batches. Critical for performance. Without this, each span generates an individual network call.
Routing connector: Send traces to different backends based on service name, environment, or other attributes. Route production traces to your paid observability platform, dev traces to a local Jaeger instance.
A typical Collector configuration for Kubernetes:
receivers:
  otlp:
    protocols:
      grpc:
        endpoint: 0.0.0.0:4317
      http:
        endpoint: 0.0.0.0:4318

processors:
  batch:
    timeout: 10s
  tail_sampling:
    decision_wait: 30s
    policies:
      - name: errors
        type: status_code
        status_code: { status_codes: [ERROR] }
      - name: slow-traces
        type: latency
        latency: { threshold_ms: 1000 }
      - name: probabilistic-sampling
        type: probabilistic
        probabilistic: { sampling_percentage: 5 }

exporters:
  otlp/tempo:
    endpoint: tempo:4317
    tls:
      insecure: true

service:
  pipelines:
    traces:
      receivers: [otlp]
      processors: [batch, tail_sampling]
      exporters: [otlp/tempo]
Backends: Jaeger vs Tempo vs Vendors
Jaeger is the original CNCF distributed tracing backend, now in maintenance mode. It’s battle-tested and widely understood, but the storage architecture hasn’t aged perfectly. Jaeger uses Cassandra or Elasticsearch as backends, which adds operational overhead. If you’re already running Elasticsearch for logs, Jaeger is a reasonable choice.
Grafana Tempo is my current recommendation for self-hosted tracing. Tempo is designed to be cheap: it doesn’t index trace attributes by default, which means it can store traces cheaply in object storage (S3, GCS) rather than in an indexed search engine. The tradeoff: you can only look up a trace if you have the trace ID. Tempo solves this through trace-to-log and trace-to-metric correlation in Grafana: you find the trace ID from a metric dashboard, then jump directly to the trace. This workflow maps well to how teams actually debug: “p99 latency spiked, let me find an example trace from that window.”
For teams using the full Grafana stack (Loki for logs, Prometheus/Mimir for metrics, Tempo for traces), the correlation experience is excellent and the total operational cost is lower than alternatives.
Honeycomb and Lightstep are SaaS platforms built around high-cardinality trace data. They support arbitrary attribute querying that Tempo doesn’t, enabling questions like “show me all traces where customer.tier = enterprise and db.query_count > 10.” If your debugging patterns require that kind of exploration, they’re worth the cost.
Datadog and New Relic provide tracing as part of broader APM platforms. If you’re already in one of those ecosystems, the integration is seamless. The cost per trace-span can be higher than self-hosted alternatives at scale.
Connecting Traces to the Rest of Your Stack
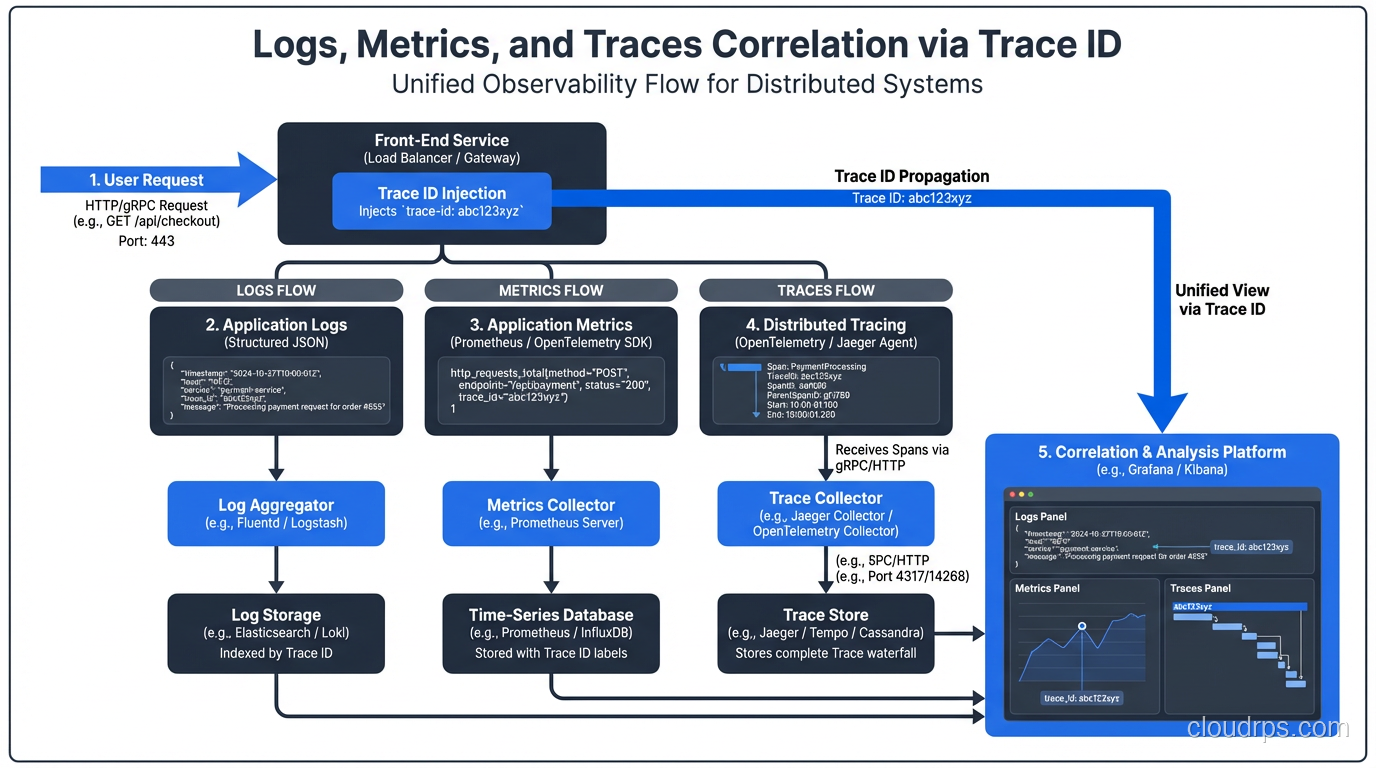
Traces become dramatically more useful when correlated with logs and metrics. The pattern:
Include the trace ID in every log line. In Python with structlog:
import structlog
from opentelemetry import trace

def add_trace_info(logger, method, event_dict):
    span = trace.get_current_span()
    if span.is_recording():
        ctx = span.get_span_context()
        event_dict["trace_id"] = format(ctx.trace_id, "032x")
        event_dict["span_id"] = format(ctx.span_id, "016x")
    return event_dict

structlog.configure(processors=[add_trace_info, ...])
Now when you find a trace with an error, you can pivot directly to the logs for that exact trace ID. Grafana can link this automatically if you configure the right datasource connections.
For metrics, exemplars attach a sample trace ID to a metric data point. Prometheus and Grafana support exemplars: when your p99 latency chart shows a spike, you can click the spike and jump directly to a trace that represents that specific high-latency request. This closes the loop from metrics to traces without any manual correlation.
Pair this with proper secret management to ensure API keys and credentials for your observability backends aren’t leaked through trace attributes. I’ve seen teams accidentally export database passwords in span attributes. Review your attribute data before sending to third-party backends.
Common Mistakes I’ve Seen
Too many attributes: Every attribute you add to a span is stored and potentially indexed. Don’t add high-cardinality values like user UUIDs to the span name (use attributes instead). Don’t add large blobs of data. Keep attribute values short and filterable.
Missing context propagation in async work: When you put work on a queue or job system, the trace context doesn’t propagate automatically. You need to serialize the trace context into the message and deserialize it in the consumer to continue the trace. This is easy to forget and results in broken traces that stop at the queue boundary.
Instrumenting too fine-grained: A 50-line function doesn’t need 10 spans. Aim for spans that represent meaningful units of work: an HTTP request, a database query, an external API call. Too many spans add overhead and make traces harder to read.
Ignoring sampling until you have a bill: Set up tail-based sampling from day one. Tracing every request without sampling in a high-throughput service will surprise you with storage costs.
The Productivity Payback
Setting up OpenTelemetry takes a day or two of engineering time per service, plus the operational work of deploying and maintaining the Collector and backend. It sounds like overhead.
The payback comes during your first major incident. Instead of spending 3 hours grepping logs and theorizing about which service is slow, you spend 10 minutes following the trace. You can see the database query that took 2.3 seconds, the retry loop that caused three redundant API calls, the serialization step that was allocating a 50MB object.
Good traces turn your system from a black box into something you can actually reason about. Given how distributed systems fail (badly, at the intersections between services), that understanding is worth every hour you invest.
For the infrastructure side of running Kubernetes workloads where this matters most, see Kubernetes autoscaling for tuning the deployments your traces will illuminate, and platform engineering for how teams build this kind of observability as a shared platform capability. Chaos engineering becomes dramatically more valuable once you have distributed tracing in place: injecting failures and watching them propagate through traces is how you build genuine resilience confidence.
Get Cloud Architecture Insights
Practical deep dives on infrastructure, security, and scaling. No spam, no fluff.
By subscribing, you agree to receive emails. Unsubscribe anytime.