A few years ago I got pulled into a war room for a major SaaS platform. The system was grinding to a halt every day between 10 AM and 2 PM, right when their customers were most active. The previous two engineers had thrown hardware at the problem: more CPU, more RAM, bigger database instances. The bill had tripled in six months and the performance was still degrading.
I spent two days with their system before making any changes. What I found was painfully common: a single database query buried in the order processing code was doing a full table scan on a 200-million-row table. Adding one index, literally one line of DDL, reduced their average page load time from 4.2 seconds to 180 milliseconds. Their monthly cloud bill dropped by $40,000 because they could downsize all the extra hardware they’d added.
That story is not unusual. In thirty-plus years of tuning systems, I’ve found that the vast majority of performance problems come from a handful of root causes. You don’t need exotic solutions. You need systematic diagnosis and targeted fixes.
The First Rule: Measure Before You Optimize
I cannot emphasize this enough. The single biggest mistake I see is engineers optimizing based on intuition rather than data. “I think the database is slow” is not a diagnosis. “Query X takes 3.2 seconds and runs 400 times per minute, consuming 60% of database CPU” is a diagnosis.
Before you touch anything, establish your baseline:
- What are your current response time percentiles? (P50, P95, P99)
- Where is time being spent? (Application code, database, network, external services)
- What are your resource utilization numbers? (CPU, memory, disk I/O, network)
- What does your traffic pattern look like? (Requests per second over a 24-hour period)
If you don’t have this data, your first step is to get it. Set up proper monitoring and logging before you start tuning. Otherwise, you’re flying blind, and any improvement you make is anecdotal rather than measured.
Database Performance Tuning
Databases are the bottleneck in the vast majority of systems I’ve worked on. Not because databases are slow (modern databases are engineering marvels) but because they’re easy to misuse.
Finding Slow Queries
Every major database has a slow query log. Turn it on. For PostgreSQL, set log_min_duration_statement to something reasonable. I usually start at 100ms. For MySQL, enable the slow query log with a threshold of 100ms. For SQL Server, use Extended Events or Query Store.
But don’t just look at the slowest queries. Look at the most frequently executed queries too. A query that takes 50ms but runs 10,000 times per minute is consuming more total database time than a query that takes 5 seconds but runs once per hour.
The metric I care about most is total time: execution time multiplied by execution count. Sort your queries by total time and work from the top. That’s your hit list.
Indexing: The 80/20 of Database Tuning
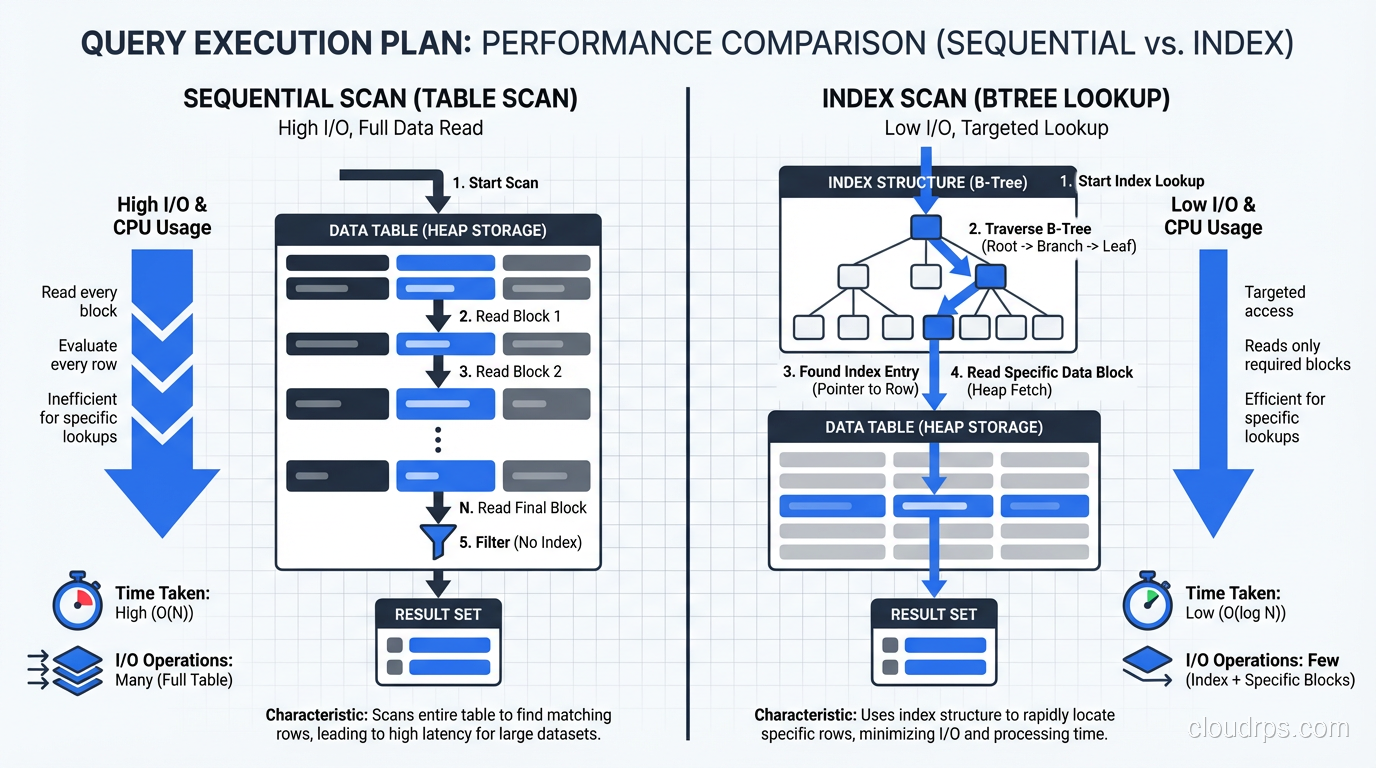
I’m going to state this as strongly as I can: proper indexing solves 80% of database performance problems. Not schema redesign. Not hardware upgrades. Not switching to a different database engine. Indexes.
Read the query plan. Every single slow query should be examined with EXPLAIN ANALYZE (PostgreSQL), EXPLAIN (MySQL), or the equivalent in your database. You’re looking for full table scans (sequential scans in Postgres, full table scans in MySQL) on large tables. These are your targets.
Index the columns in your WHERE clauses. This sounds obvious, but I still find unindexed filter columns in production systems every week. If you’re querying WHERE status = 'active' AND created_at > '2025-01-01', you need an index that covers both columns.
Composite indexes matter. A single-column index on status and a single-column index on created_at is not the same as a composite index on (status, created_at). The composite index is dramatically more efficient for queries that filter on both columns. Column order in the composite index matters too: put the most selective column first.
Don’t over-index. Every index slows down writes and consumes disk space. I’ve seen tables with 25 indexes where only 8 were actually used by any query. Periodically audit your indexes. PostgreSQL’s pg_stat_user_indexes view tells you which indexes are being used and which are just dead weight.
Connection Pooling
Database connections are expensive to create. A full TCP handshake, TLS negotiation, authentication, and session setup can take 50-100ms. If your application opens a new connection for every request, that overhead adds up fast.
Use a connection pooler. PgBouncer for PostgreSQL. ProxySQL for MySQL. Or use your framework’s built-in connection pool (most modern frameworks have one).
Size your pool carefully. Too small and requests queue up waiting for connections. Too large and your database gets overwhelmed with concurrent connections (each PostgreSQL connection consumes about 10MB of memory). I typically start with a pool size of 2x the number of CPU cores on the database server and adjust from there based on actual usage patterns.
A common disaster I’ve seen: an application with 20 instances, each with a connection pool of 50, pointed at a database with max_connections set to 200. That’s 1,000 potential connections competing for 200 slots. Use PgBouncer in transaction mode between your application and the database to multiplex connections.
Query Optimization Patterns
Beyond indexing, these are the query-level optimizations I apply most frequently:
Eliminate N+1 queries. This is the single most common application-level database performance problem. Your ORM loads a list of 100 orders, then makes a separate query for each order’s line items. That’s 101 queries instead of 1 or 2. Use eager loading, joins, or batch fetching.
Paginate large result sets. If you’re loading 10,000 rows to display 25 on a page, you’re wasting enormous amounts of database and network resources. Use LIMIT and OFFSET (or better yet, keyset pagination for large datasets where OFFSET gets expensive).
Avoid SELECT *. Only fetch the columns you need. This reduces I/O, network transfer, and memory usage. It also lets the database use covering indexes more effectively.
Batch writes. Instead of 1,000 individual INSERT statements, use a single batch INSERT. The difference can be 100x in throughput.
For a deeper discussion on choosing between database paradigms, check out my post on SQL vs NoSQL databases.
Caching: The Double-Edged Sword
Caching can dramatically improve performance, but it adds complexity and introduces the hardest problem in computer science: cache invalidation.
Cache at the right level. Application-level caches (in-memory or Redis) for frequently-read, rarely-changed data. Database query caches are mostly useless in modern databases. PostgreSQL doesn’t even have one anymore, and MySQL’s query cache was removed in 8.0 for good reason.
Set appropriate TTLs. A cache without a TTL is a recipe for stale data and confused users. Start with short TTLs (30-60 seconds) and increase them if your data’s change frequency allows it.
Cache the right things. The ideal cache candidate is data that’s expensive to compute, frequently accessed, and tolerant of being slightly stale. User profile data? Great cache candidate. Account balance? Probably not.
Monitor your cache hit rate. A cache with a 50% hit rate is barely doing its job. You want 90%+ for the cache to justify its complexity. If your hit rate is low, either your TTL is too short or you’re caching the wrong things.
For a deeper look at cache eviction policies, the cache-aside vs write-through patterns, and the Redis vs Memcached vs Valkey decision, see our distributed caching guide.
Application Performance Tuning
The database gets blamed for everything, but sometimes the application itself is the bottleneck. Here’s how I approach application-level tuning.
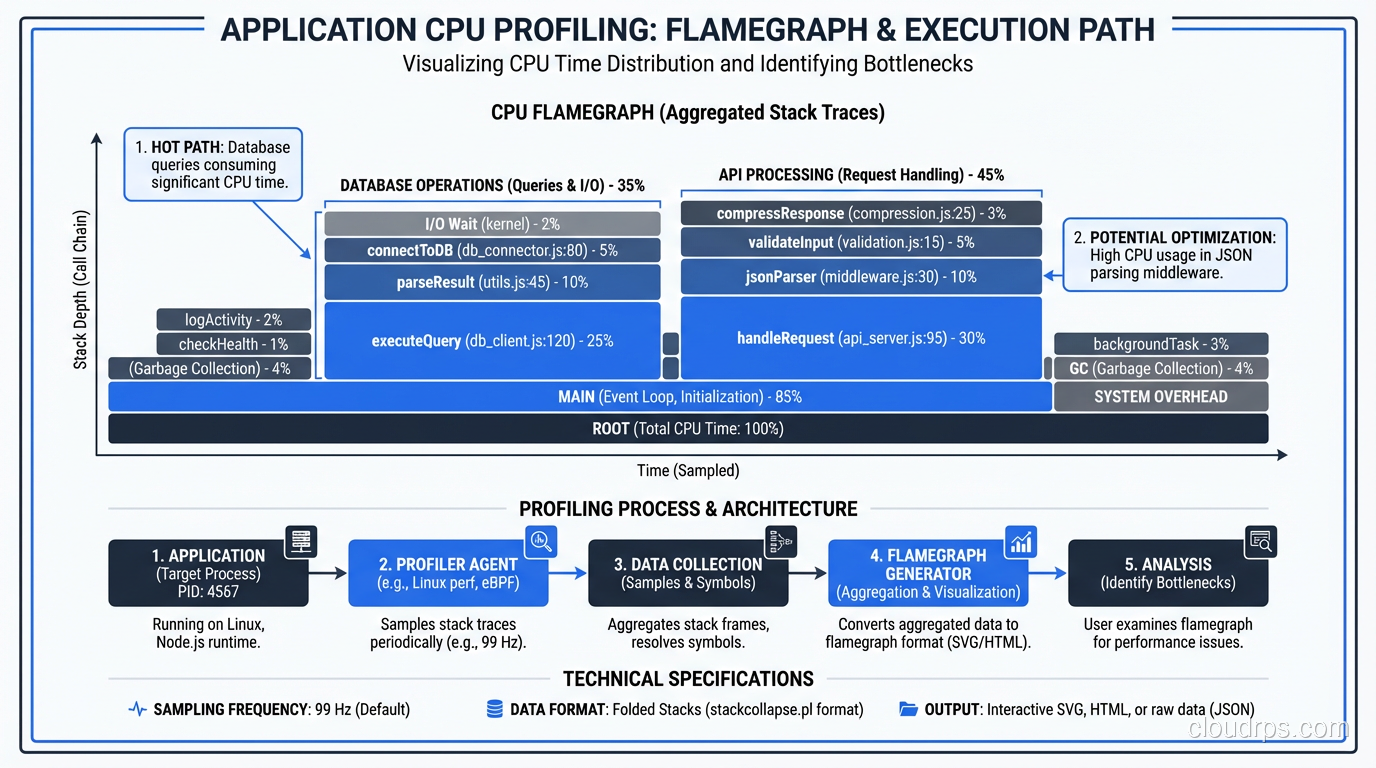
Profiling: Find the Hot Path
Before you optimize, profile. Every major language has profiling tools:
- Java: VisualVM, async-profiler, JFR (Java Flight Recorder)
- Python: cProfile, py-spy, Pyinstrument
- Node.js: Clinic.js, the built-in profiler, 0x
- Go: pprof (built in and excellent)
- .NET: dotTrace, PerfView
Profile under realistic load, not in isolation. A function that’s fast when called once might be catastrophically slow when called 10,000 times per second due to contention, GC pressure, or memory allocation patterns.
I’m looking for three things when I profile:
- CPU hot spots: Where is the CPU spending most of its time?
- Memory allocation: Where is the application allocating the most memory? (High allocation rates cause GC pauses)
- Blocking: Where are threads waiting on locks, I/O, or external calls?

Asynchronous Processing
Not everything needs to happen during the HTTP request-response cycle. If a user places an order, do they need to wait for the confirmation email to be sent? For the analytics event to be recorded? For the inventory system to be updated?
Move non-critical work to background queues. This is one of the easiest and most impactful performance improvements you can make. The user gets a fast response, and the work happens asynchronously.
I use this pattern extensively:
- Email and notification sending
- Report generation
- Data aggregation and analytics
- Third-party API calls that aren’t needed for the response
- Image processing and thumbnail generation
The tools for this are mature: Sidekiq (Ruby), Celery (Python), Bull (Node.js), or cloud-native options like SQS + Lambda.
Serialization and Payload Size
I’ve optimized a surprising number of systems just by reducing response payload sizes. API endpoints returning 2MB JSON responses when the client only needs 50KB of that data. GraphQL is one solution, but often the simpler fix is just creating a lighter endpoint or adding field selection to your existing API.
Also, check your serialization performance. JSON serialization in some languages is shockingly slow with the default libraries. In Java, switching from Jackson’s default ObjectMapper configuration to a tuned one (with specific visibility rules and feature flags) can cut serialization time in half.
HTTP and Network Optimization
Enable compression. gzip or Brotli compression on HTTP responses can reduce payload sizes by 70-90%. If you’re not doing this, you’re wasting bandwidth and making your users wait longer.
Use HTTP/2. Header compression, multiplexing, and server push can significantly reduce latency, especially for pages with many assets.
Set proper cache headers. Static assets should have long cache lifetimes. API responses should have appropriate Cache-Control headers. This reduces load on your servers and improves perceived performance for users.
CDN for static content. If you’re serving static files from your application servers, stop. Put a CDN in front of them. CloudFront, Fastly, Cloudflare: any of them will reduce latency for your global users and offload traffic from your origin servers.
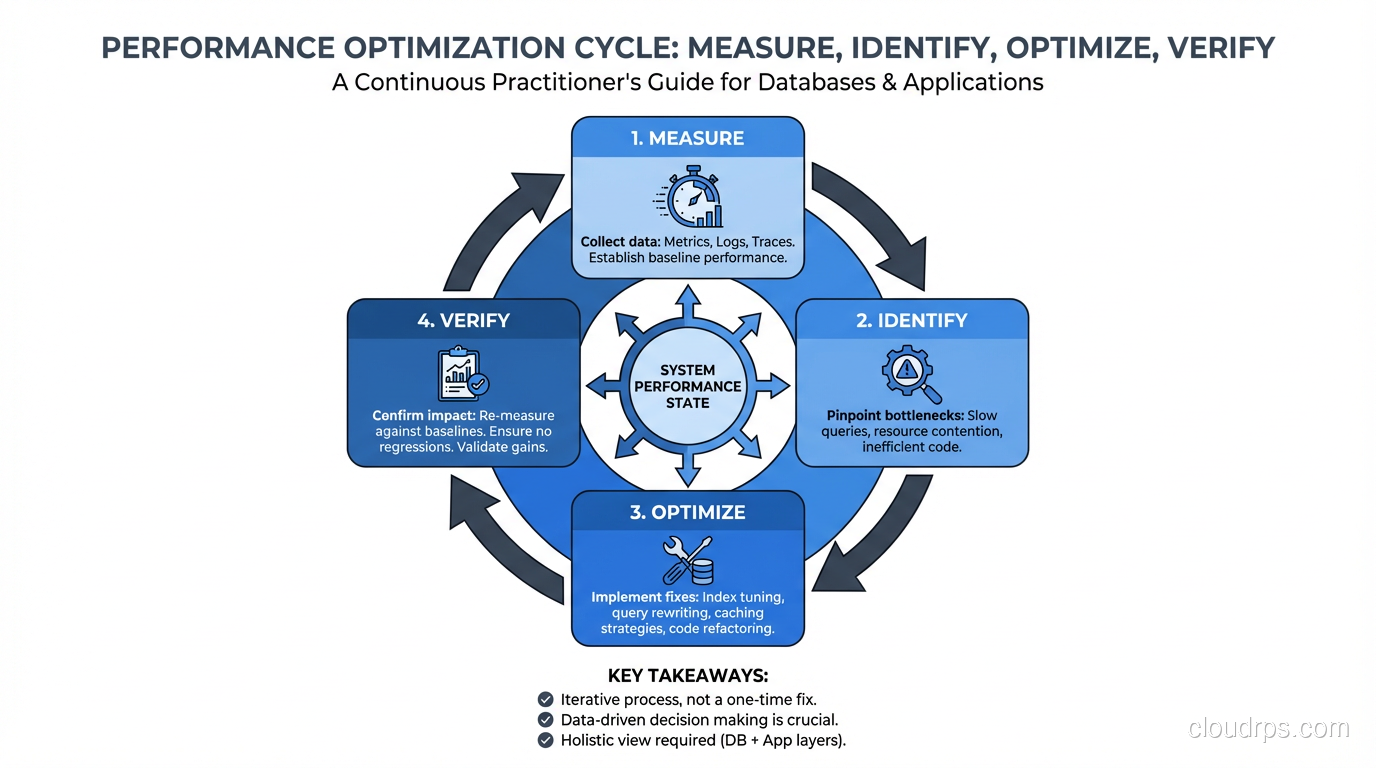
The Systematic Approach
When I’m called in to fix a slow system, I follow this exact process:
- Establish baseline metrics. Current P50/P95/P99 latency, error rate, throughput, resource utilization.
- Identify the bottleneck layer. Use distributed tracing or manual instrumentation to determine where time is spent: application, database, cache, external service, network.
- Drill into the bottleneck. If it’s the database, analyze slow queries. If it’s the application, profile the code. If it’s an external service, measure its response times and consider caching or async processing.
- Make one change at a time. Measure the impact. If it helped, keep it. If it didn’t, revert it. Never make multiple changes simultaneously because you won’t know which one made the difference.
- Repeat. Performance tuning is iterative. Once you fix the biggest bottleneck, the second biggest becomes visible. Keep going until you hit your performance targets.
This approach works. It’s not flashy. It won’t make for an exciting conference talk. But it reliably takes systems from slow to fast, and it does so without the risks of shotgun optimization.
For specific latency debugging techniques, I go deeper in my article on troubleshooting latency.
Common Antipatterns I See Over and Over
“Let’s Just Add More Servers”
Horizontal scaling is great when you’ve actually optimized your code and need more capacity. It’s terrible when you’re using it to mask inefficiency. If each request takes 3 seconds because of a bad query, adding more servers just means more servers executing bad queries. Fix the query first, then scale if you still need to.
“We Should Rewrite It in Rust”
I love Rust. But rewriting a slow Python application in Rust before you’ve profiled it is like replacing your car’s engine because the parking brake is on. Profile first. The bottleneck is almost certainly not “Python is slow”; it’s a specific piece of code doing something unnecessary or inefficient.
“Let’s Cache Everything”
Adding a cache layer without understanding your read/write ratio, your data consistency requirements, and your cache invalidation strategy is asking for trouble. I’ve seen caches that made systems slower (due to cache stampedes), less reliable (due to stale data), and more complex (due to invalidation bugs). Cache strategically, not universally.
“The Database Can’t Handle It”
Nine times out of ten, the database absolutely can handle it. Your queries just aren’t letting it. I’ve seen single PostgreSQL instances handle 50,000 transactions per second when the queries and indexes are right. Before you start thinking about sharding or switching to a different database, exhaust your optimization options on what you have.
The Payoff
Performance tuning is one of the most satisfying types of engineering work. The feedback loop is tight: you make a change, you measure the impact, you see the improvement. And the business impact is direct: faster systems convert better, retain more users, and cost less to operate.
The key is discipline. Measure first. Optimize the biggest bottleneck. Measure again. Resist the urge to guess. Resist the urge to rewrite. Resist the urge to add hardware before you’ve optimized software. Follow the data, and the data will lead you to the fix.
Get Cloud Architecture Insights
Practical deep dives on infrastructure, security, and scaling. No spam, no fluff.
By subscribing, you agree to receive emails. Unsubscribe anytime.