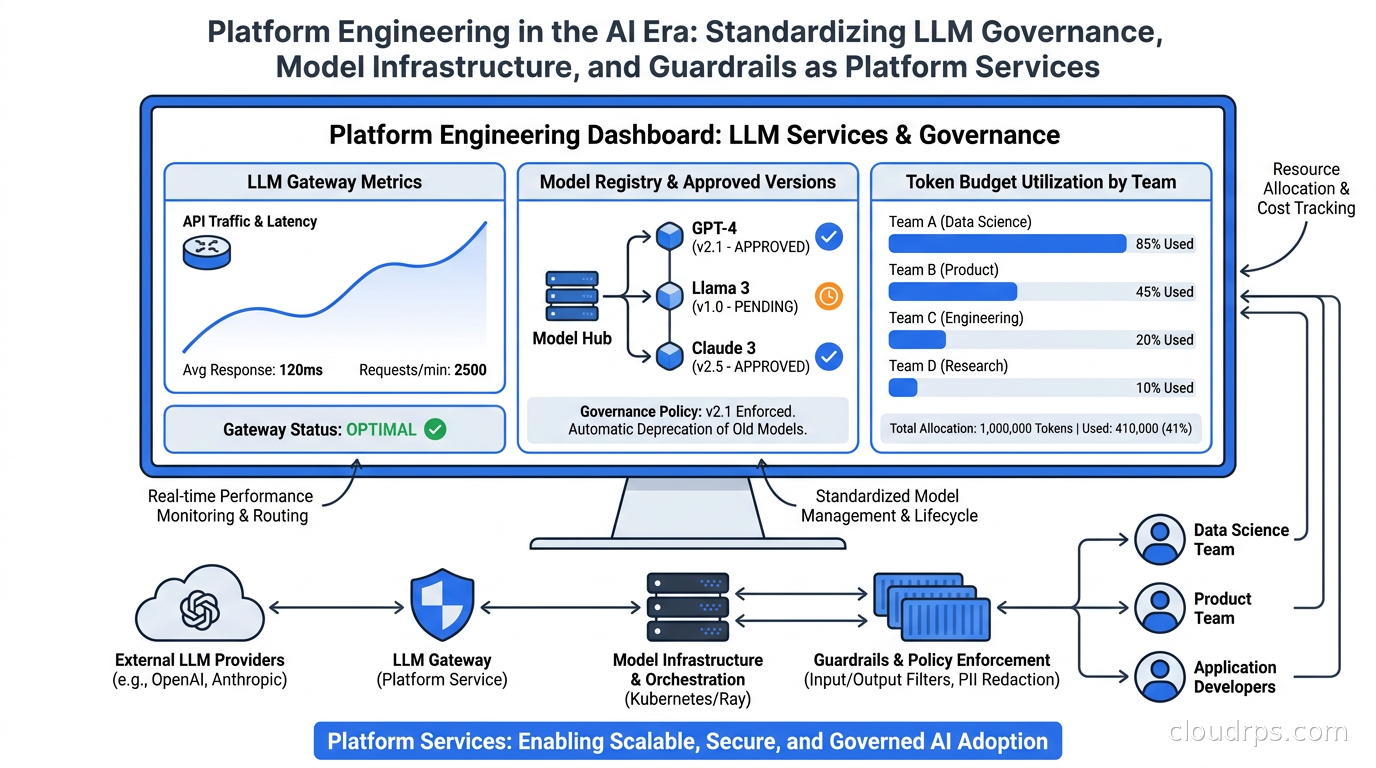
Five years ago, the biggest challenge a platform team faced was convincing developers to use the internal Kubernetes provisioning tool instead of requesting manual cluster access. Internal developer portals were the dominant discussion topic. Today, those same teams are being asked to govern which LLMs engineers can call, enforce token budgets across dozens of services, prevent prompt injection from reaching production pipelines, and ensure that a fine-tuned model does not get deployed without a formal evaluation run.
This is not gradual evolution. It is a step change in what platform engineering means, and most teams are still figuring out where their responsibility ends and the application team’s begins.
After twenty years in this industry, I have watched several transitions reshape what the platform layer needs to own: physical servers to virtual machines, monoliths to containerized microservices, hand-rolled scripts to infrastructure as code. Each one expanded the surface area of platform responsibility. The LLM era is doing the same thing, but faster and with higher stakes. A misconfigured AI pipeline can generate costs orders of magnitude larger than a misconfigured Kubernetes namespace, and the failure modes are stranger: a quality regression in a model prompt can go undetected for days while silently degrading user experience.
This article is about what platform engineering actually looks like when LLMs are first-class citizens of your stack. Not theory, but the specific things teams are building and the sequencing that works.
The New Scope: What Platform Teams Now Own
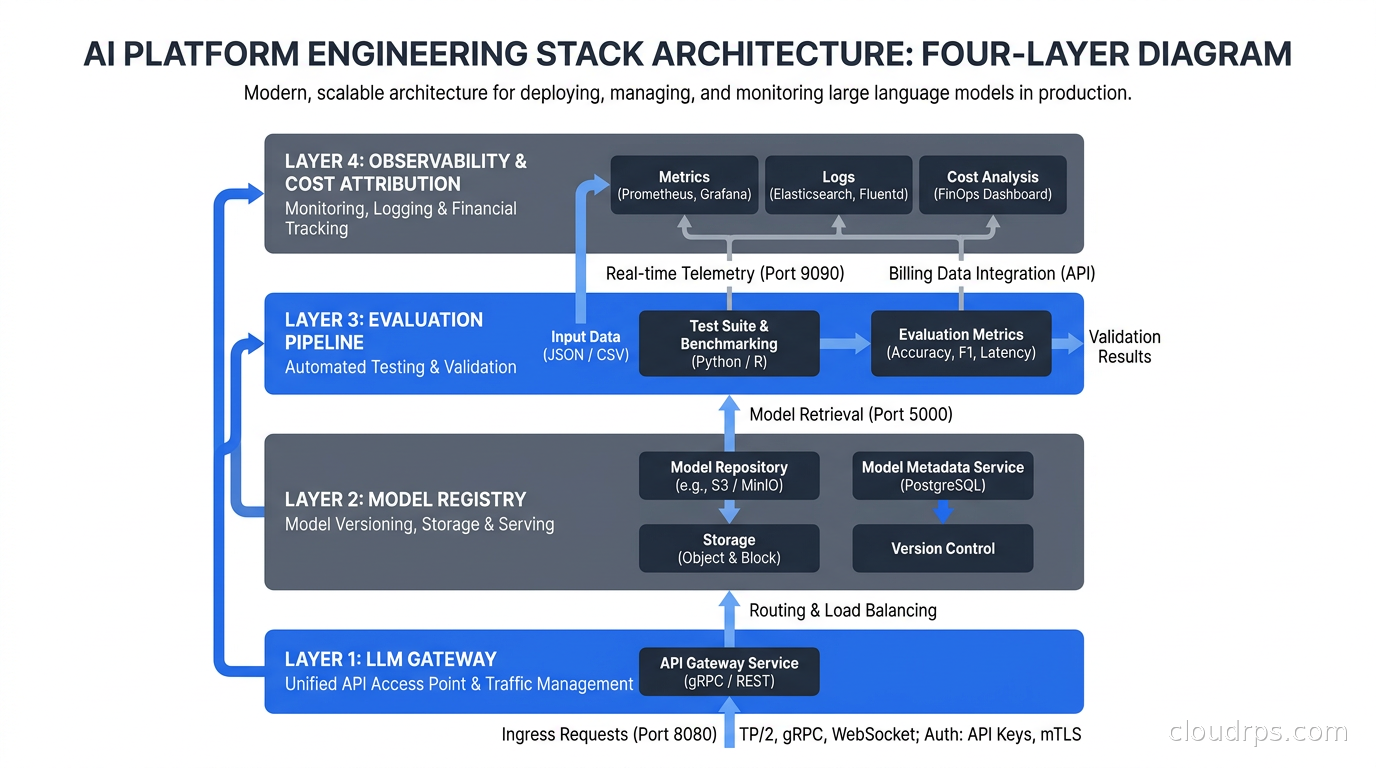
Let me be concrete about what has changed. Traditional platform engineering scope looks something like: container image builds and registries, Kubernetes provisioning and cluster lifecycle, service mesh and networking, secrets injection, CI/CD pipelines and GitOps workflows, and an observability stack covering metrics, logs, and traces.
In teams that have taken AI seriously, the scope now includes:
- An LLM gateway that all internal API calls route through, providing centralized authentication, cost attribution, routing, caching, and policy enforcement
- A model registry that tracks not just ML model artifacts but also versioned prompt configurations and evaluation baselines
- Token budgets allocated per team or service, with gateway-enforced ceilings and alerting
- Guardrail policies that apply uniformly to AI inputs and outputs across all workloads, regardless of which team built the feature
- Evaluation pipelines integrated into CI/CD, running quality regression checks on every commit that touches AI-adjacent code
- Cost attribution for AI spend broken down to the team and feature level, integrated with the broader FinOps stack
Not every organization has all of these yet. Most are somewhere in the middle: they have the gateway, they have some cost alerting, and they are drowning in manual review because they have not automated evaluation. But the direction is clear, and teams that are building this out as a coherent platform are measurably faster at shipping AI features safely than teams leaving it to each application developer to figure out.
The LLM Gateway: The Most Important Platform Primitive
If you are only going to build one thing for AI platform infrastructure, build the LLM gateway. Everything else is harder to retrofit.
The AI gateway pattern is not complicated in principle: a proxy that sits between your application code and LLM APIs, providing centralized routing, authentication, caching, and observability. In practice, getting teams to actually use it instead of calling OpenAI or Anthropic directly is the real challenge.
What I have seen work: make the gateway the only path to a production LLM API credential. If the only way to get a key is through the gateway, adoption is forced rather than optional. This sounds harsh but it eliminates an entire category of governance failure: rogue API keys, untracked spend, and services that bypass every policy you have built.
What the gateway gives you that direct API access does not:
Centralized cost attribution. Every request gets tagged with calling service, team, feature flag, and environment. Your FinOps dashboard can show that the recommendation service spent twice as much on tokens as any other service this week, which is the conversation starter that leads to prompt optimization.
Model routing and fallback. The gateway decides whether a request goes to GPT-4o, Claude Sonnet, a self-hosted model, or a cached response. Application teams do not hardcode model names. When a vendor has an outage or raises prices, platform changes a routing rule and nothing in application code changes. This decoupling is worth the gateway’s overhead on its own.
Semantic caching. The gateway can serve cached responses for semantically similar queries. This is particularly valuable for internal knowledge bases, FAQ bots, and report summaries, categories of workload where repetition is high and the cost of serving a cached response is zero.
Policy enforcement. Input guardrails (blocking PII, detecting prompt injection patterns) and output guardrails (content filtering, format validation) live in the gateway, not scattered across each application team’s code.
The tooling options are real and production-tested. LiteLLM Proxy is open source, self-hosted, and gives you full control; it supports 100-plus providers, exact and semantic caching, and multiple routing strategies. Portkey (now part of Palo Alto Networks) offers a managed control plane with observability, guardrail orchestration, and prompt management layered on the gateway. Some teams run LiteLLM as the routing proxy and pipe telemetry to Portkey or a similar observability backend. Cloud-native options like AWS Bedrock’s gateway capabilities and Vertex AI’s model routing work well if you are already deeply committed to one cloud.
The choice matters less than just having one. The team that deploys a basic LiteLLM proxy this week and builds on it is in a dramatically better position than the team that evaluates gateway options for three months.
Model Registry: Beyond Training Artifacts
The term “model registry” used to mean MLflow or Weights & Biases tracking training runs and checkpoints. That still matters if your team is training or fine-tuning models, but most engineering teams are not; they are calling hosted APIs and building applications. The model registry question for them is different.
Platform teams in 2026 are tracking three things under the model registry umbrella.
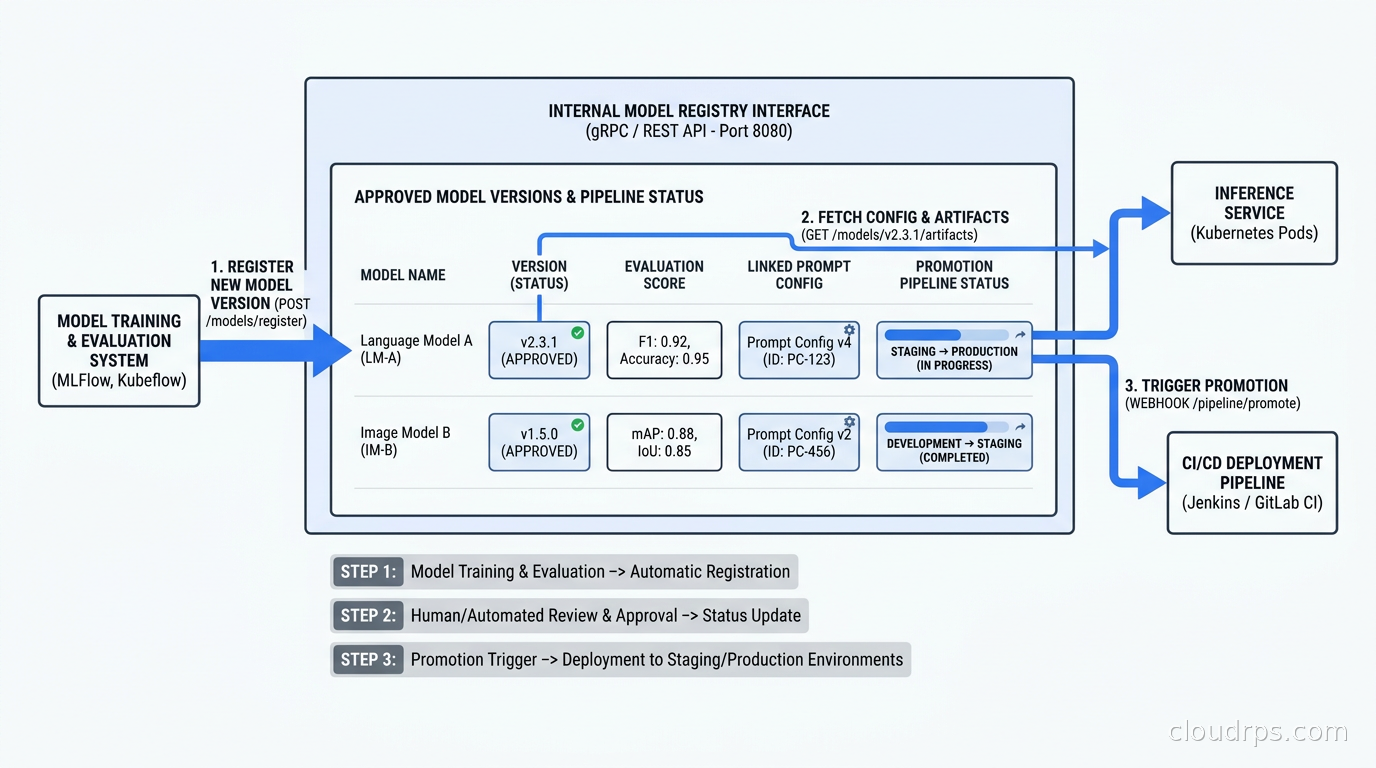
Approved model versions. Which versions of which foundation models have been evaluated and approved for production use? What are their context window sizes, known limitations, and applicable use cases? When a vendor releases a new model, the platform team evaluates it against the internal benchmark suite and publishes updated recommendations. Application teams consume from that list rather than making independent research decisions about every new release.
Versioned prompt configurations. A prompt template is as much of a deployable artifact as a Docker image. It has a version, it can regress, and it should go through a review process before it reaches production. The LLMOps article covers the mechanics of prompt versioning in depth. The platform angle is that the registry provides a shared home for prompts used across teams: system prompts for company-wide AI assistants, shared summarization templates, classification prompts for routing pipelines. When a security review determines that certain data should not appear in prompts, the registry is where that policy gets enforced at a level visible to auditors.
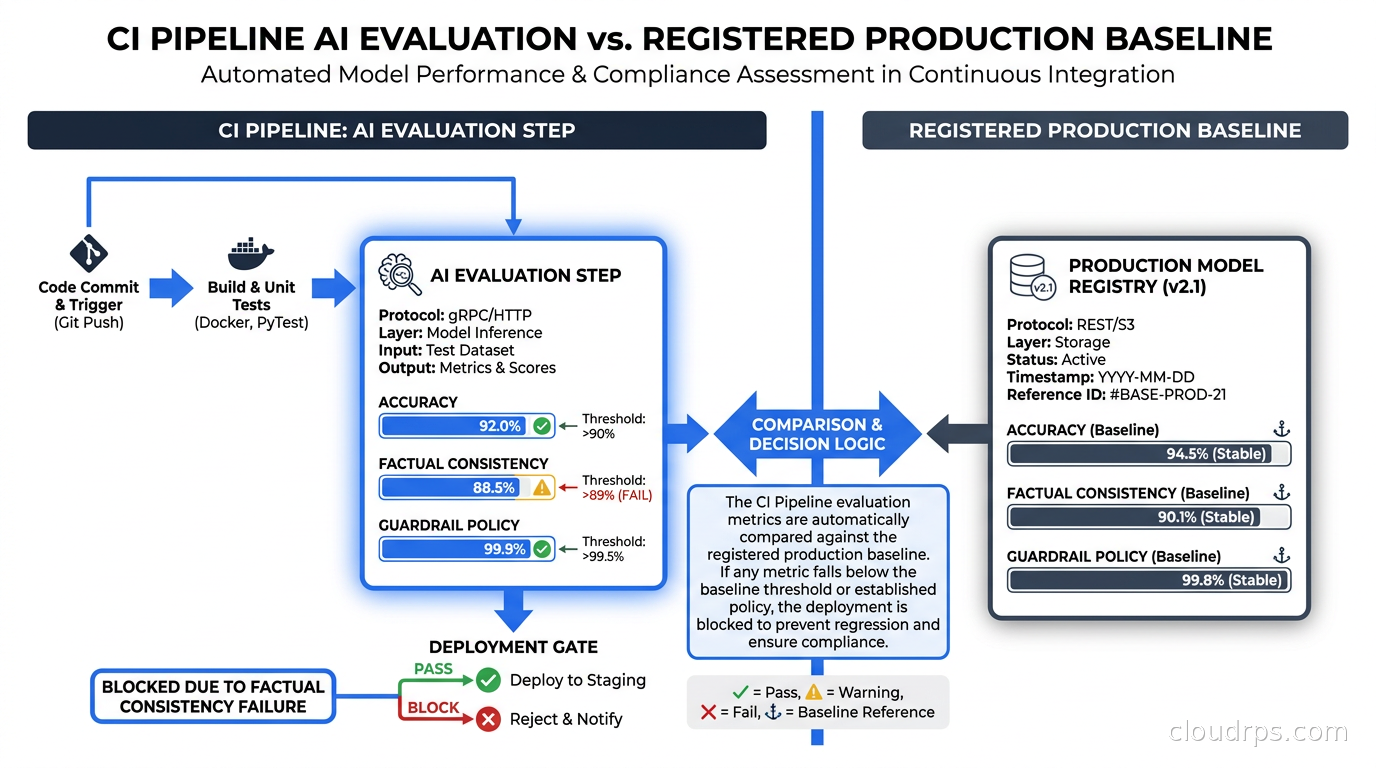
Evaluation baselines. For every model and prompt combination in production, there is a registered baseline: accuracy on a golden test set, latency percentiles at p50, p95, and p99, cost per request at typical usage. When someone proposes a change (swapping the model, updating the prompt, adjusting temperature), the evaluation pipeline runs against the baseline. Changes that regress below threshold cannot be promoted. This is the same principle as a performance regression gate, applied to AI quality rather than latency.
The tooling here is less mature than the gateway side. Some teams build on top of MLflow with custom schemas for prompt metadata. Others use Hugging Face Hub private deployments. A few have built lightweight internal systems on PostgreSQL with a simple API and dashboard. The specific tool matters less than the discipline of treating prompts and model selections as versioned, reviewable artifacts rather than strings scattered across codebases.
Token Budgeting as a Platform Service
Token costs have a different structure than compute costs, and that difference surprises teams the first time they encounter it. Compute is mostly predictable: instances run, you know the hourly rate, a spike usually means something specific happened. Token costs are request-shaped: a single misbehaving feature can generate thousands of long-context requests in minutes, and you may not know about it until the bill arrives.
The AI FinOps article covers monitoring and cost tooling in depth. The platform engineering angle is about building enforcement, not just reporting.
Practical token budgeting operates at three levels.
Hard limits per service. The LLM gateway enforces token consumption ceilings per service per time window. When a service hits its budget, the gateway returns a 429 or triggers a graceful fallback depending on how the service is configured. This is not about blocking legitimate work; it is about preventing one rogue deployment from running up a large bill while the team is asleep. Limits start conservative and are adjusted as teams demonstrate usage patterns.
Soft alerts with runbooks. When services approach their budget threshold, the gateway sends an alert to the team’s Slack channel with a link to a runbook covering common causes: context window accumulation from unbounded conversation history, missing response length limits, features getting called in unexpected tight loops. Most budget exceedances in my experience are not intentional; they are developers who did not realize a downstream service was calling their feature on every page load.
Per-environment model tiering. Production gets the most capable (and expensive) models. Staging and CI get cheaper or smaller models unless there is a specific documented reason to use frontier models. This is a routing rule in the gateway, not something each team implements individually. The default behavior is sensible; teams can override for legitimate reasons but the override needs to be explicit and reviewable.
The organizational question this raises is who owns the budget. In most teams I have seen get this right, the platform team sets per-service limits based on a baseline negotiated with engineering managers. Teams are responsible for staying within budget for their services. Platform is responsible for the tooling that makes it possible to track, enforce, and adjust. This mirrors how cloud budget alerts work: engineering managers own spend, platform owns the visibility infrastructure.
Guardrails as Platform Primitives
Every team building AI features eventually writes some kind of guardrail layer: input validation, output filtering, policy enforcement. Left to application teams, this ends up inconsistent, duplicated, and often inadequate. I have reviewed codebases where three different teams each implemented their own regex-based PII detection, all with different accuracy profiles and none tested against the same adversarial dataset.
Platform guardrails solve this by providing a common enforcement layer in the gateway, plus a policy definition format that teams can extend for their use cases.
The platform layer typically handles: PII detection and scrubbing in both inputs and outputs (names, payment card numbers, social security numbers, health information), prompt injection pattern detection, topic policy enforcement for regulatory contexts, output format validation against expected schemas, and a first-pass content safety classifier.
Application teams layer domain-specific policies on top: entity types specific to their industry, business logic constraints, role-based content filtering.
The tooling options are real. Guardrails AI is an Apache 2.0 open-source project that ships a hub of over 70 pre-built validators (PII, profanity, JSON schema, regex) and wraps any LLM call with input and output validation; best suited for teams that want full control and lightweight integration. Lakera Guard, acquired by Check Point in 2025, is a real-time LLM security API that applies purpose-built ML models for prompt injection, jailbreaking, and data leakage detection. Meta’s LlamaGuard 4 is an open-weight safety classifier that teams can self-host as a secondary model alongside their primary LLM, useful for organizations that cannot send data to a third-party guardrail API for compliance reasons. NVIDIA NeMo Guardrails offers a policy DSL called Colang for encoding safety rules as programmable flows.
The platform team’s role is to pick a consistent approach, validate it against the organization’s actual risk profile, and give application teams a reliable interface to consume. The worst outcome is requiring each team to independently evaluate the guardrail ecosystem and make inconsistent choices. The second worst outcome is deploying guardrails that are never tested against adversarial inputs: a guardrail policy that passes unit tests but fails under real attack patterns gives a false sense of security. For more on the security model, the AI agent security article covers prompt injection and related attack patterns in depth.
Evaluation Pipelines in CI/CD
This is where most teams are furthest behind, and where the cost of getting it wrong is highest.
An AI feature with no automated evaluation is a feature you cannot safely change. Every prompt tweak, model upgrade, or parameter adjustment is a roll of the dice. You ship it, watch support tickets and user feedback for a few days, and hope nothing regressed. At low usage, this is annoying. At production scale, it is a reliability risk that erodes user trust faster than almost any other class of failure.
The LLM observability article covers production monitoring. Evaluation pipelines are about pre-production quality gates. A functional CI evaluation setup has several components.
A golden test set. A curated collection of inputs with expected outputs or quality criteria. This is work (someone has to create and maintain it), but it is the foundation of everything else. Good golden sets include edge cases, adversarial inputs, and representative samples from the actual production distribution. A hundred well-chosen test cases catches more regressions than a thousand random ones.
A CI step that runs evaluation. When a pull request touches anything in the AI path (prompt templates, model selection, parameters, application logic that affects context construction), the CI pipeline runs the evaluation suite and reports results against registered thresholds. A deployment that drops factual accuracy or safety scores below threshold cannot merge. This works the same as a test suite gate and should be treated with the same seriousness.
Comparison to baseline. New results are compared to the registered baseline for the current production configuration. Regression is blocking; improvement updates the baseline after review. The baseline is stored in the model registry alongside the prompt configuration and model version.
LLM-as-judge for generation quality. For tasks without a single right answer (summarization, classification, creative generation), a secondary LLM scores quality against a rubric. This is not perfect, and the judge model’s own accuracy should be periodically validated against human labels. But it scales to large test sets in a way that human review cannot, and it catches obvious regressions reliably.
Tooling options include Braintrust, DeepEval, and RAGAS (specifically for RAG pipelines). Most mature teams end up with a combination: a standard framework for infrastructure metrics (latency, cost, error rates) and custom evaluators for domain-specific quality criteria. The evaluation pipeline itself is a CI/CD artifact that needs to be versioned and maintained like any other pipeline.
Observability for AI Workloads
Traditional observability still applies to AI workloads. Response time, error rate, and throughput are as important as ever. They tell you whether the system is working. They do not tell you whether it is working correctly.
AI workloads need an additional observability layer that the platform team should provide as instrumented defaults, not leave to each team to build.
Trace-level prompt logging. Every LLM request logged with the full prompt, model, parameters, completion, token counts, latency, and cost. Not just for debugging; for auditing, building evaluation datasets, and detecting quality drift over time. The LLM observability tooling ecosystem covers Langfuse, LangSmith, and Arize Phoenix in detail. The platform team’s job is to make this instrumentation automatic through SDK wrappers or gateway-level capture, not a per-team implementation task.
Quality drift detection. Model providers update their models. Prompts that worked reliably last month may behave differently after a provider-side update. Periodic evaluation runs against the golden test set, scheduled independently of deployments, alert when quality metrics shift outside expected ranges even without a code change on your side.
Cost attribution dashboards. Per-service, per-team, per-feature token spend over time, integrated with the broader cloud cost stack so AI expenses appear alongside compute and storage in the same allocation framework that engineering managers already review.
Agent-specific traces. When agentic workflows span multiple LLM calls, tool invocations, and branching decisions, a single trace showing the full execution graph is essential for understanding failures. Instrumenting this without adding friction to the application developer experience is a platform concern. SDK wrappers that propagate trace context automatically through agentic frameworks save each team from having to wire this up manually.
Organizational Patterns
The teams doing this well share a few structural patterns worth naming explicitly.
An AI platform sub-team within platform engineering. Not a separate AI team that reports to research. Not each application team figuring out the stack independently. A focused team within platform engineering that owns the gateway, the registry, the evaluation infrastructure, and the governance policies. This team works directly with application teams to drive adoption and collects feedback to improve the platform.
A self-service model with guardrails. The platform team does not review every AI feature before it ships; that does not scale and is not the goal. Instead, the platform provides the guardrails, evaluation infrastructure, and cost controls such that teams can move at their own pace without creating risk. Teams that need something outside the default configuration go through a lightweight exception process, not a full review cycle.
“AI Feature Ready” as a deployment gate. The deployment checklist for any feature touching AI includes: uses the LLM gateway rather than direct API access, has an evaluation suite with a passing baseline, has a token budget configured, and has guardrail policies defined. The CI pipeline enforces this automatically. A feature that cannot pass these checks cannot reach production, the same way a feature without tests cannot merge in a team with strong testing culture.
Quarterly model review cycles. The model landscape moves fast. A quarterly cycle where the platform team evaluates new foundation models against the internal benchmark suite and publishes updated recommendations keeps application teams from making independent decisions about every new release and keeps the approved model list current. This also catches quality regressions when providers update models in place.
Where to Start
The temptation is to build everything at once. The reality is that most teams need to sequence this thoughtfully.
Start with the LLM gateway. Even a basic proxy that centralizes authentication and adds cost attribution tags is worth deploying before anything else. You cannot retrofit governance into a system where every team has its own direct API keys.
Next, wire up cost attribution and set soft budget alerts. Understanding where money is going must come before setting limits. Limits without data create conflict; limits backed by data create conversations. Most teams are surprised by what they find when they first see token spend broken down by service.
Third, work with the teams building the most active AI features on a golden test set and an evaluation CI step. Start small: a hundred well-chosen test cases is enough to catch most regressions. The tooling is secondary; the discipline of treating AI outputs as testable artifacts is what matters.
Model registry, standardized guardrail policies, and quality drift detection come after the foundation is solid. These are high-leverage investments, but they need the gateway and evaluation infrastructure to be meaningful and maintained.
What Platform Engineering Is Actually For
I have seen two versions of AI platform engineering play out. In the first, the platform team says “that is the application team’s problem” and each team builds its own fragile AI stack. Prompt injection defenses are inconsistent. Costs are untracked until a bill arrives. A model upgrade breaks three services simultaneously because each team made independent assumptions about provider behavior. An audit asks where PII appears in production prompts and nobody can produce a complete answer.
In the second version, the platform team treats LLM infrastructure with the same seriousness they bring to Kubernetes or CI/CD. The gateway is as reliable as the service mesh. The evaluation pipeline is as mandatory as the lint check. Token costs are as visible as compute costs. When a vendor changes model behavior or raises prices, the blast radius is contained because there is a single abstraction layer rather than dozens of independent integrations.
The original platform engineering article framed the mission as making the right way the easy way. That framing still holds. The hard work is not building clever tooling; it is building tooling that developers actually use because it genuinely removes friction rather than adding ceremony. An evaluation pipeline that catches real regressions and runs in under two minutes gets adopted. One that takes twenty minutes and produces confusing output gets bypassed.
For teams starting to instrument the AI coding infrastructure specifically, the AI coding agent infrastructure article covers the CI/CD integration patterns for agentic development environments. The principles carry over directly to the governance patterns described here.
The mission of platform engineering has not changed. The infrastructure underneath it has. Teams that build the AI governance layer now will be in a dramatically better position when the next wave of AI capability shifts requires rapid adoption, because they will already have the observability, evaluation, and cost controls to move fast without breaking things.
Get Cloud Architecture Insights
Practical deep dives on infrastructure, security, and scaling. No spam, no fluff.
By subscribing, you agree to receive emails. Unsubscribe anytime.