
I have seen databases with 500 GB of actual live data sitting on a 2 TB volume because nobody tuned autovacuum. I have also watched a production database refuse connections at midnight because the transaction ID counter crossed the danger threshold, and the only fix was a three-hour maintenance window that nobody had planned. Both outcomes are preventable. Both happen regularly. Both trace back to the same root cause: teams treat PostgreSQL’s garbage collector as a detail to configure later.
PostgreSQL’s VACUUM subsystem is not a nice-to-have. It is load-bearing infrastructure. Understanding how it works, how it fails, and how to tune it for your workload is as important as choosing the right index type or setting up replication. This is a deep dive into all of it.
Why PostgreSQL Has Dead Tuples at All
To understand VACUUM, you first have to understand why the garbage exists in the first place.
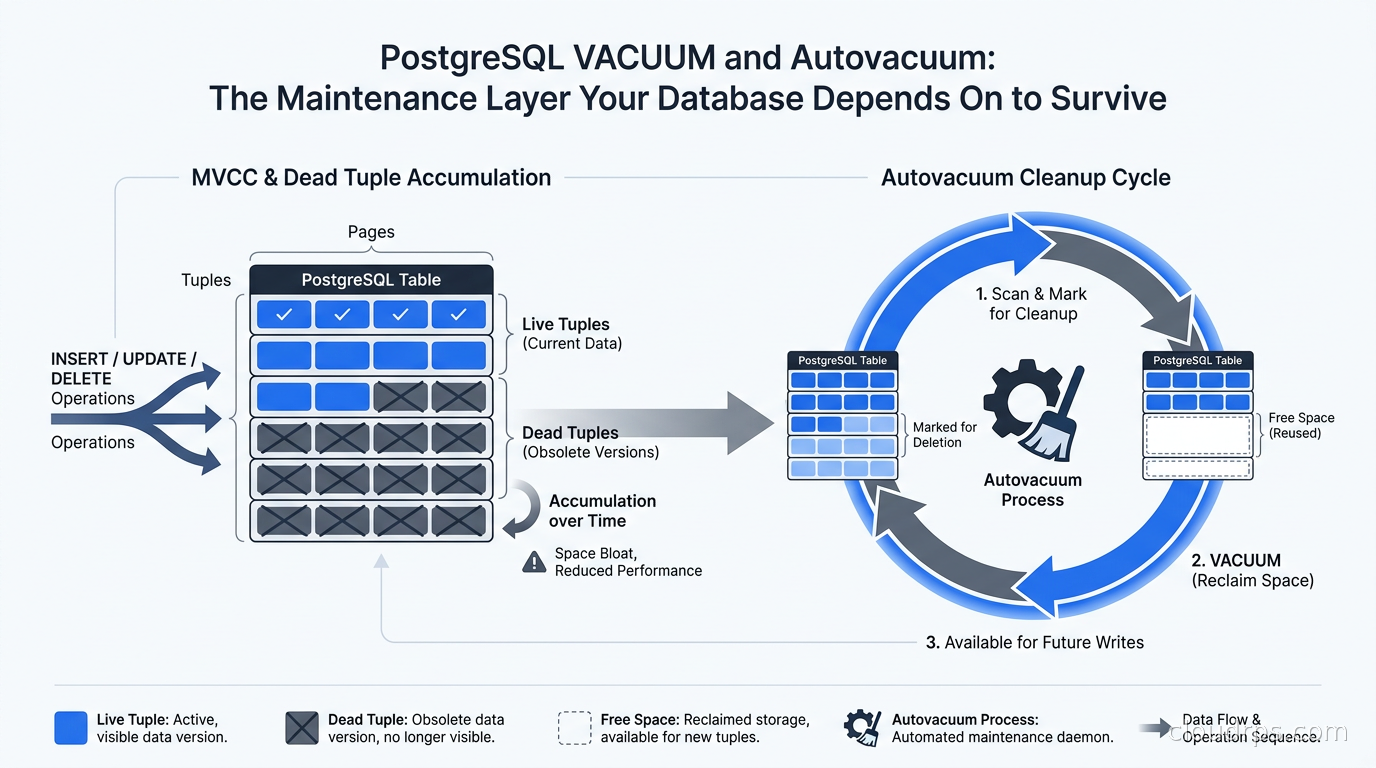
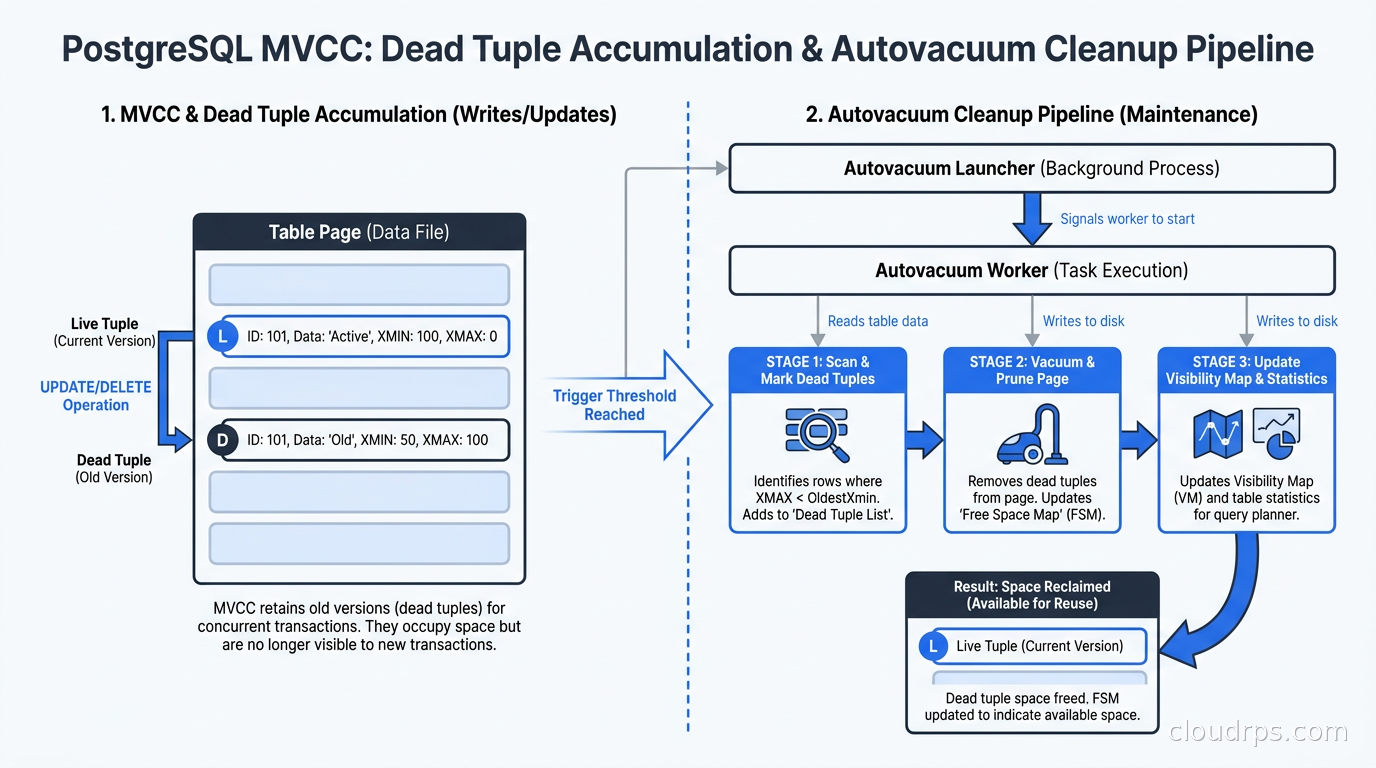
PostgreSQL uses Multi-Version Concurrency Control, or MVCC, to handle concurrent reads and writes without locking. When you issue an UPDATE, PostgreSQL does not overwrite the old row in place. Instead, it writes a new version of the row with a new transaction ID in the xmax header field of the old tuple and writes the new row as a fresh heap tuple. When you DELETE a row, PostgreSQL marks it dead by setting its xmax but leaves the bytes on disk. The old version stays physically present until vacuum comes along to reclaim it.
This design is why PostgreSQL can run long-running analytics queries without blocking writers. The query sees a consistent snapshot of the data at the time it started, reading old tuple versions while writers add new ones. The tradeoff is that somebody has to clean up those old versions eventually. That somebody is VACUUM.
Every UPDATE and DELETE leaves behind dead tuples. On a write-heavy table, this means the physical size of the table grows well beyond the size of its live data. Those dead tuples slow down sequential scans, bloat indexes, and waste I/O. And if vacuum cannot keep up, the problem compounds until you hit one of two hard walls: bloat so severe that performance degrades catastrophically, or transaction ID wraparound that forces PostgreSQL to shut down to protect data integrity.
What VACUUM Actually Does
VACUUM (without FULL) does not compact the table. It marks dead tuples as free space that can be reused by future inserts. It updates the free space map so PostgreSQL knows where to put new rows. It also updates visibility maps so index-only scans work correctly. And it advances the relfrozenxid counter, which is the mechanism PostgreSQL uses to prevent transaction ID wraparound.
What VACUUM does not do is return space to the operating system. A table that bloated to 50 GB and then had its dead rows cleaned up by a regular vacuum will still report a 50 GB file size on disk. The dead space is reclaimed internally as reusable pages, but the file does not shrink.
VACUUM FULL is a different beast entirely. It rewrites the entire table to a new file, compacts it, and returns the freed space to the operating system. The catch is that it holds an exclusive lock on the table for the entire duration. On a 50 GB table, that could be an hour or more. Using VACUUM FULL on a production table during business hours is a decision you make once and then spend the rest of the day explaining to your incident channel. The right tool for shrinking a production table without a lock is pg_repack, which we cover later, or the CLUSTER command with a rewrite approach, both of which can run with lower-impact locks.
How Autovacuum Works
Manual VACUUM is something you run when you already have a problem. Autovacuum is the daemon that prevents problems from developing in the first place.
Autovacuum runs a pool of worker processes in the background. The launcher process wakes up every autovacuum_naptime seconds (default: 60 seconds) and checks pg_stat_user_tables for tables that need attention. It triggers a vacuum on a table when the number of dead tuples exceeds a threshold calculated as:
autovacuum_vacuum_threshold + (autovacuum_vacuum_scale_factor * table_rows)
With defaults of autovacuum_vacuum_threshold = 50 and autovacuum_vacuum_scale_factor = 0.2, autovacuum fires when a table accumulates more than 50 dead tuples plus 20% of the live row count. On a table with 10 million rows, that means autovacuum waits until there are over 2 million dead tuples before cleaning up. That is too late for most write-heavy workloads.
Autovacuum also runs ANALYZE to update query planner statistics. That threshold is controlled by autovacuum_analyze_threshold (default: 50) and autovacuum_analyze_scale_factor (default: 0.1).
The autovacuum cost throttle is something most teams configure wrong. By default, autovacuum sleeps for autovacuum_vacuum_cost_delay milliseconds (default: 2 ms) after accumulating autovacuum_vacuum_cost_limit (default: 200) cost units. Cost units are charged based on I/O: reading an already-in-cache page costs 1 unit (vacuum_cost_page_hit), reading from disk costs 10 (vacuum_cost_page_miss), and writing a dirty page costs 20 (vacuum_cost_page_dirty). This throttle prevents vacuum from saturating the I/O subsystem, but the defaults are extremely conservative. On modern SSDs or NVMe storage in cloud instances, a cost limit of 200 is like asking a racecar to drive in first gear.
For most production systems on fast storage, you want:
-- Global autovacuum throttle settings
autovacuum_vacuum_cost_delay = 1        -- ms, was 2
autovacuum_vacuum_cost_limit = 800      -- was 200, raise proportional to storage speed
autovacuum_max_workers = 5             -- was 3, more parallelism
These are reasonable starting points. You tune from there by watching pg_stat_user_tables.last_autovacuum and observing whether tables are keeping up.
Tuning Per-Table Autovacuum
Global autovacuum settings are a blunt instrument. The real power comes from per-table overrides using ALTER TABLE ... SET (storage_parameter = ...). This is essential in any production PostgreSQL cluster because every application has a mix of tables: tiny reference tables that barely change, and hot transaction tables that process thousands of writes per second.
For a high-throughput events table that accumulates dead tuples fast:
ALTER TABLE events SET (
  autovacuum_vacuum_scale_factor = 0.01,  -- trigger at 1% dead tuples
  autovacuum_vacuum_threshold = 100,
  autovacuum_analyze_scale_factor = 0.005,
  autovacuum_vacuum_cost_limit = 2000     -- allow more I/O for this table
);
For a large, rarely-updated reference table where default vacuum would trigger unnecessarily:
ALTER TABLE product_catalog SET (
  autovacuum_vacuum_scale_factor = 0.5,
  autovacuum_analyze_scale_factor = 0.1
);
The pattern I use in practice: any table over 10 million rows gets an explicit autovacuum_vacuum_scale_factor of 0.01 or lower. The 20% default sounds reasonable until you realize that 20% of a 100 million row table is 20 million dead tuples. By the time autovacuum fires on that table, you have substantial bloat and a long vacuum run ahead of you.
PostgreSQL 17 and 18 VACUUM Improvements
PostgreSQL 17, released in September 2024, shipped a redesigned memory management system for VACUUM that reduces its memory footprint by up to 20x compared to earlier versions. This matters in practice because it means VACUUM processes can handle more fragmented heaps without hitting maintenance_work_mem limits as quickly, and they leave more memory available for query workloads on the same server.
PostgreSQL 18 brings the largest set of VACUUM improvements in years. The headline feature is asynchronous I/O: VACUUM can now overlap reads with processing, which dramatically speeds up vacuum on I/O-bound systems. PostgreSQL 18 also introduces autovacuum_vacuum_max_threshold, a new hard cap on dead tuples that triggers autovacuum earlier on large tables regardless of scale factor. This addresses the longstanding problem where a scale_factor of 0.2 on a 500-million-row table means waiting for 100 million dead tuples before autovacuum fires. The new vacuum_max_eager_freeze_failure_rate parameter controls how aggressively VACUUM freezes visible pages to spread out the anti-wraparound work more evenly over time.
If you are running PostgreSQL 17 or 18 in production, updating your autovacuum_vacuum_cost_limit upward is now more justified than ever because the underlying I/O path has gotten more efficient.
XID Wraparound: The Catastrophic Case
Transaction ID wraparound is the failure mode that ends careers. It is also entirely preventable, but it requires understanding why it exists.
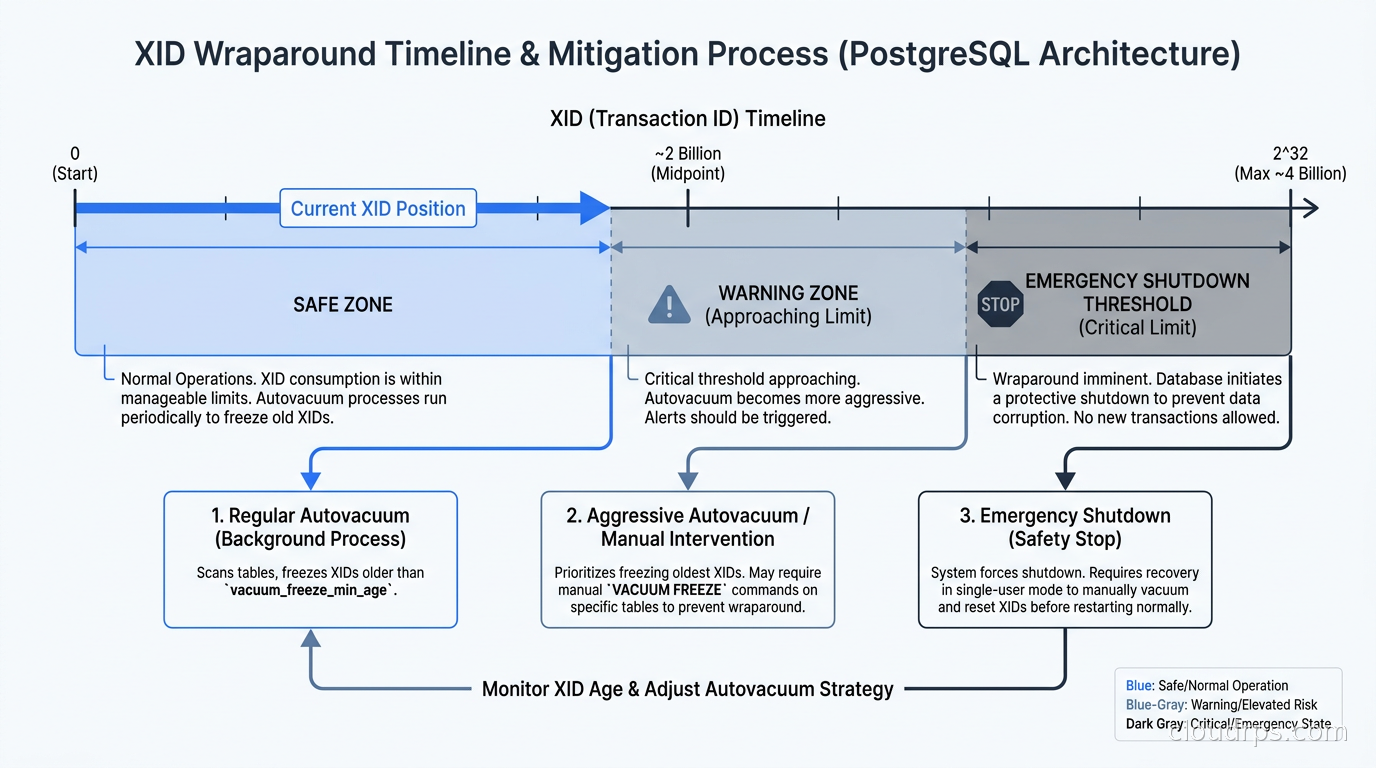
PostgreSQL assigns a 32-bit transaction ID (XID) to every transaction. At roughly 4.3 billion possible values, the counter eventually wraps around. Because MVCC uses XID comparisons to determine tuple visibility, a wraparound would make old tuples look like future transactions, which would corrupt the database. PostgreSQL prevents this by periodically “freezing” old tuples: marking them with a special frozen XID that is always considered visible regardless of the current XID counter.
The freeze process is triggered by the vacuum cycle. When a table’s oldest unfrozen transaction crosses autovacuum_freeze_max_age (default: 200 million transactions), autovacuum is forced to run an anti-wraparound vacuum on that table, regardless of any other thresholds or whether autovacuum is otherwise disabled. If that vacuum cannot complete in time, PostgreSQL will issue warnings in the logs starting at roughly 40 million transactions before the danger zone, and if the age reaches a hard limit, it stops accepting new write transactions with a message like:
ERROR: database is not accepting commands to avoid wraparound data loss
At that point, the only path forward is vacuumdb --freeze --all run as the superuser in single-user mode. This is the kind of Saturday night nobody wants.
The monitoring query you should run daily, or preferably alert on hourly:
SELECT
  datname,
  age(datfrozenxid) AS frozen_xid_age,
  current_setting('autovacuum_freeze_max_age')::bigint AS max_age,
  round(100.0 * age(datfrozenxid) /
    current_setting('autovacuum_freeze_max_age')::bigint, 1) AS pct_toward_emergency
FROM pg_database
ORDER BY frozen_xid_age DESC;
Alert when pct_toward_emergency crosses 75%. Investigate immediately at 85%. When you see tables with unfrozen XIDs getting close to autovacuum_freeze_max_age, you can manually trigger a freeze with:
VACUUM FREEZE VERBOSE your_table_name;
Running this manually is fine. What is not fine is relying on it as a substitute for understanding why autovacuum is not keeping up.
What Blocks Autovacuum
Autovacuum can be blocked from cleaning dead tuples even when it is running and the thresholds are hit. The most common culprits:
Long-running transactions. MVCC requires PostgreSQL to keep tuple versions visible to any active transaction. A transaction that has been open for two hours holds back the vacuum horizon across the entire cluster. Any dead tuple created after that transaction started cannot be cleaned until it commits or rolls back. You will see this in pg_stat_activity as sessions with long xact_start times. Consider setting idle_in_transaction_session_timeout to terminate sessions that have been idle in a transaction for too long.
Abandoned replication slots. Each logical or physical replication slot has an xmin that prevents vacuum from removing tuples that might still be needed by the consumer. If a replication slot is created and the consumer goes away without dropping it, the slot’s xmin stays fixed forever while the primary keeps accumulating dead tuples it cannot clean. Monitor pg_replication_slots for slots where inactive_since is set, or where xmin has not advanced in hours. Drop slots that are no longer in use.
Autovacuum worker limits. With the default autovacuum_max_workers = 3, it is entirely possible for three large tables to each hold a worker while dozens of smaller tables queue up. Increasing this to 5 or 6 on a system with available CPU and I/O headroom is usually worth it.
Misconfigured cost throttle. If autovacuum_vacuum_cost_delay is set high to protect I/O on spinning disks, and you have since migrated to SSDs, the throttle may be causing vacuum to run so slowly it can never catch up with the write rate on busy tables.
Detecting Bloat
There is no single authoritative query for measuring PostgreSQL bloat, but the following gives a reasonable estimate for tables:
WITH table_bloat AS (
  SELECT
    schemaname,
    tablename,
    pg_size_pretty(pg_total_relation_size(schemaname || '.' || tablename)) AS total_size,
    n_dead_tup,
    n_live_tup,
    round(100.0 * n_dead_tup / nullif(n_live_tup + n_dead_tup, 0), 1) AS dead_pct,
    last_autovacuum,
    last_autoanalyze
  FROM pg_stat_user_tables
)
SELECT *
FROM table_bloat
WHERE dead_pct > 10
  OR n_dead_tup > 1000000
ORDER BY n_dead_tup DESC;
For index bloat, the pgstattuple extension gives the most accurate picture:
CREATE EXTENSION IF NOT EXISTS pgstattuple;
SELECT * FROM pgstatindex('your_index_name');
The avg_leaf_density field tells you how packed index pages are. A healthy B-tree index runs around 70-90% leaf density. Below 50%, the index has significant bloat and query performance may be suffering. Rebuilding it with:
REINDEX INDEX CONCURRENTLY your_index_name;
The CONCURRENTLY option is critical in production. Without it, REINDEX takes a lock that blocks all reads and writes on the table.
For a higher-level bloat assessment without per-table overhead, the pgmetrics tool and the bloat estimation queries from Bloat Check (part of check_postgres) are standard tools in the database reliability engineering toolkit described in our database reliability engineering guide.
pg_repack: The Right Way to Reclaim Space in Production
When a table has accumulated significant bloat and you need to reclaim that disk space, VACUUM alone will not do it. The options are:
VACUUM FULLtakes an exclusive lock for the duration of the rewrite. Non-starter on production during business hours for anything above a few hundred megabytes.CLUSTERrewrites the table in index order and does compact it, but also requires a lock.pg_repackrewrites the table online with minimal locking.
pg_repack works by creating a new copy of the table, applying ongoing changes from a trigger log, then swapping the tables with a very brief exclusive lock at the end to rename them. For a 200 GB bloated table, the rewrite might take 40 minutes, but the exclusive lock at the end is typically under a second. The tradeoff is disk space: you need room for the second copy of the table during the process.
Installation and usage:
# Install pg_repack extension
CREATE EXTENSION pg_repack;

# From the command line
pg_repack -h your-host -U your-user -d your-db --table your_table
We covered zero-downtime schema operations in depth in our zero-downtime database migrations article, and pg_repack fits directly into that toolkit.
Building a VACUUM Monitoring Practice
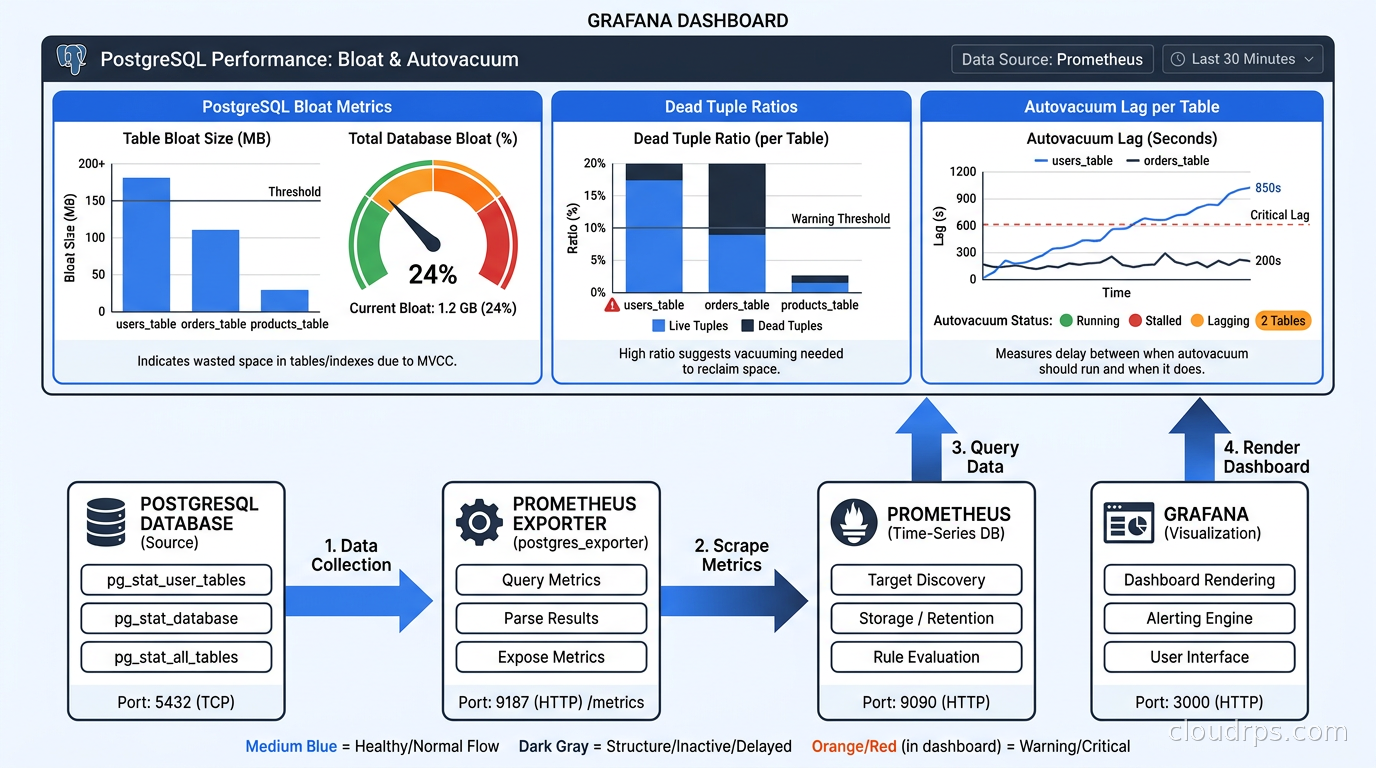
You cannot tune what you cannot see. The queries and tools I use in practice for ongoing VACUUM monitoring:
Daily health check query:
SELECT
  schemaname,
  tablename,
  n_live_tup,
  n_dead_tup,
  round(100.0 * n_dead_tup / nullif(n_live_tup + n_dead_tup, 0), 2) AS dead_pct,
  last_vacuum,
  last_autovacuum,
  vacuum_count,
  autovacuum_count
FROM pg_stat_user_tables
WHERE n_dead_tup > 10000
ORDER BY n_dead_tup DESC
LIMIT 20;
Check for autovacuum lag (tables that should have been vacuumed but weren’t):
SELECT
  relname AS table_name,
  age(relfrozenxid) AS xid_age,
  n_dead_tup,
  last_autovacuum,
  EXTRACT(EPOCH FROM (now() - last_autovacuum)) / 3600 AS hours_since_vacuum
FROM pg_stat_user_tables
JOIN pg_class ON relname = tablename
WHERE EXTRACT(EPOCH FROM (now() - last_autovacuum)) / 3600 > 24
  AND n_dead_tup > 50000
ORDER BY hours_since_vacuum DESC;
Check for blocking long transactions:
SELECT pid, now() - xact_start AS duration, state, query
FROM pg_stat_activity
WHERE xact_start IS NOT NULL
  AND now() - xact_start > interval '1 hour'
ORDER BY duration DESC;
Check replication slot health:
SELECT slot_name, slot_type, active, age(xmin) AS xmin_age, inactive_since
FROM pg_replication_slots
ORDER BY age(xmin) DESC;
Export these to your metrics system. At minimum, alert on xid_age approaching 150 million and on tables with dead_pct above 20% for more than 24 hours.
The observability setup for these metrics fits naturally into the monitoring patterns described in our PostgreSQL high availability guide and the SLO-based reliability framework in our database reliability engineering article.
Connection Pooling Interaction with VACUUM
There is a subtle interaction between connection poolers like PgBouncer and autovacuum that trips teams up. PgBouncer in transaction pooling mode recycles connections between transactions, which is the most efficient pooling mode for high-concurrency OLTP workloads. But if an application opens a transaction, does work, and then the application crashes without closing the connection, PgBouncer holds that connection open and the transaction stays active indefinitely.
This is one of the reasons idle_in_transaction_session_timeout exists. The connection pooling setup detailed in our database connection pooling guide covers how to detect and handle abandoned transactions through the pooler layer, which matters directly for VACUUM health.
Managed PostgreSQL and VACUUM
If you run PostgreSQL on a managed service like AWS Aurora, AlloyDB, or Azure Flexible Server, you still need to understand autovacuum tuning, but some behavior differs. Aurora PostgreSQL uses a modified vacuum implementation that is integrated with Aurora’s distributed storage layer. Aurora tracks dead tuples differently from vanilla PostgreSQL, and the freeze/XID-wraparound mechanism is preserved but the underlying storage reclamation works differently.
AlloyDB for PostgreSQL has made autovacuum adaptive tuning a managed service concern, and as of recent updates, it adjusts scale_factor and cost throttling based on observed write patterns. That is useful, but it does not eliminate the need to monitor pg_stat_user_tables and watch for tables that are falling behind. Managed services can miscalibrate just as easily as self-managed ones.
A full comparison of how managed services handle vacuum and other maintenance operations is part of our managed PostgreSQL comparison guide.
Autovacuum and Extensions
The PostgreSQL extensions ecosystem adds significant capabilities on top of the base vacuum system. pg_partman combined with proper partitioning strategy changes the vacuum calculus significantly: partition pruning means vacuum only has to work on smaller, bounded partitions rather than massive monolithic tables. TimescaleDB chunks work similarly, and its automatic chunk compression reduces the amount of live data that vacuum needs to track. We covered the full extensions landscape in our PostgreSQL extensions ecosystem article. The indexing strategies in our PostgreSQL indexing guide also directly affect vacuum cost, because index bloat from dead tuples is cleaned during the same vacuum pass as table bloat.
Putting It Together: A Production Tuning Checklist
This is what I do when I inherit a PostgreSQL cluster that nobody has tuned:
Step 1: Establish baselines. Run the monitoring queries above. Find the top 10 tables by dead tuple count and the top 10 by XID age. Find any tables that have not been autovacuumed in the last 24 hours.
Step 2: Fix any immediate blockers. Kill long-running idle transactions with pg_terminate_backend. Drop abandoned replication slots. These should fix themselves quickly in the monitoring queries.
Step 3: Tune global autovacuum. Raise autovacuum_vacuum_cost_limit to 800 as a starting point on cloud instances with SSD storage. Raise autovacuum_max_workers to 5. Set autovacuum_naptime = 30s to check more frequently.
Step 4: Per-table tuning. Any table over 10 million rows gets autovacuum_vacuum_scale_factor = 0.01. Any table that processes more than 10,000 writes per second gets a cost_limit override of 2000 or higher.
Step 5: Freeze emergency pass. For any table where age(relfrozenxid) is above 150 million, manually run VACUUM FREEZE on that table during a low-traffic window. This is a preventive measure, not a reaction.
Step 6: Address bloat. For tables with dead_pct > 20% that have not responded to tuning, schedule pg_repack runs during low-traffic windows. Do not use VACUUM FULL in production.
Step 7: Instrument and alert. Build the monitoring queries into your observability stack. Set alerts on XID age crossing 150 million and tables falling more than 48 hours behind autovacuum.
This is not a one-time exercise. Autovacuum tuning is ongoing maintenance work. Write patterns change, table sizes grow, and the settings that were right for your database six months ago may not be right today. Treat it like capacity planning: revisit it quarterly at minimum.
The Bottom Line
PostgreSQL’s MVCC model is one of the most elegant designs in database engineering. It enables the read concurrency and consistency guarantees that make PostgreSQL the right choice for most production workloads. VACUUM is the tax you pay for that design. It is a well-designed tax, and it is entirely manageable with the right configuration and monitoring practices.
The teams that get into trouble are the ones who leave autovacuum on defaults, never look at pg_stat_user_tables, and discover they have a problem when query latency spikes or, worse, when XID wraparound forces an emergency maintenance window. The teams that run PostgreSQL reliably at scale treat vacuum tuning as infrastructure work on the same level as index design, replication configuration, and connection pool sizing.
Twenty years of working with production databases has taught me that PostgreSQL almost never fails without warning. The warnings are in pg_stat_user_tables, in the autovacuum logs, in the XID age counters. Instrument them, read them, and respond before the warnings become incidents.
Get Cloud Architecture Insights
Practical deep dives on infrastructure, security, and scaling. No spam, no fluff.
By subscribing, you agree to receive emails. Unsubscribe anytime.