I’ve watched teams hit the Prometheus wall more times than I can count. The pattern is always the same: they start with a single Prometheus instance, things work beautifully, then they add a few hundred more services, spin up three more Kubernetes clusters, and suddenly their monitoring instance is scraping 50 million active time series, consuming 128 GB of RAM, and falling over on every node restart. The on-call pager goes off during the incident because the monitoring is down too.
In twenty years building cloud infrastructure, the observability layer has been the thing that teams under-architect more consistently than almost anything else. You think carefully about database HA, you set up multi-region failover for your app tier, and then you run a single Prometheus instance with 15-day retention and call it a day. That works fine until it doesn’t, and when it stops working it stops working at exactly the wrong moment.
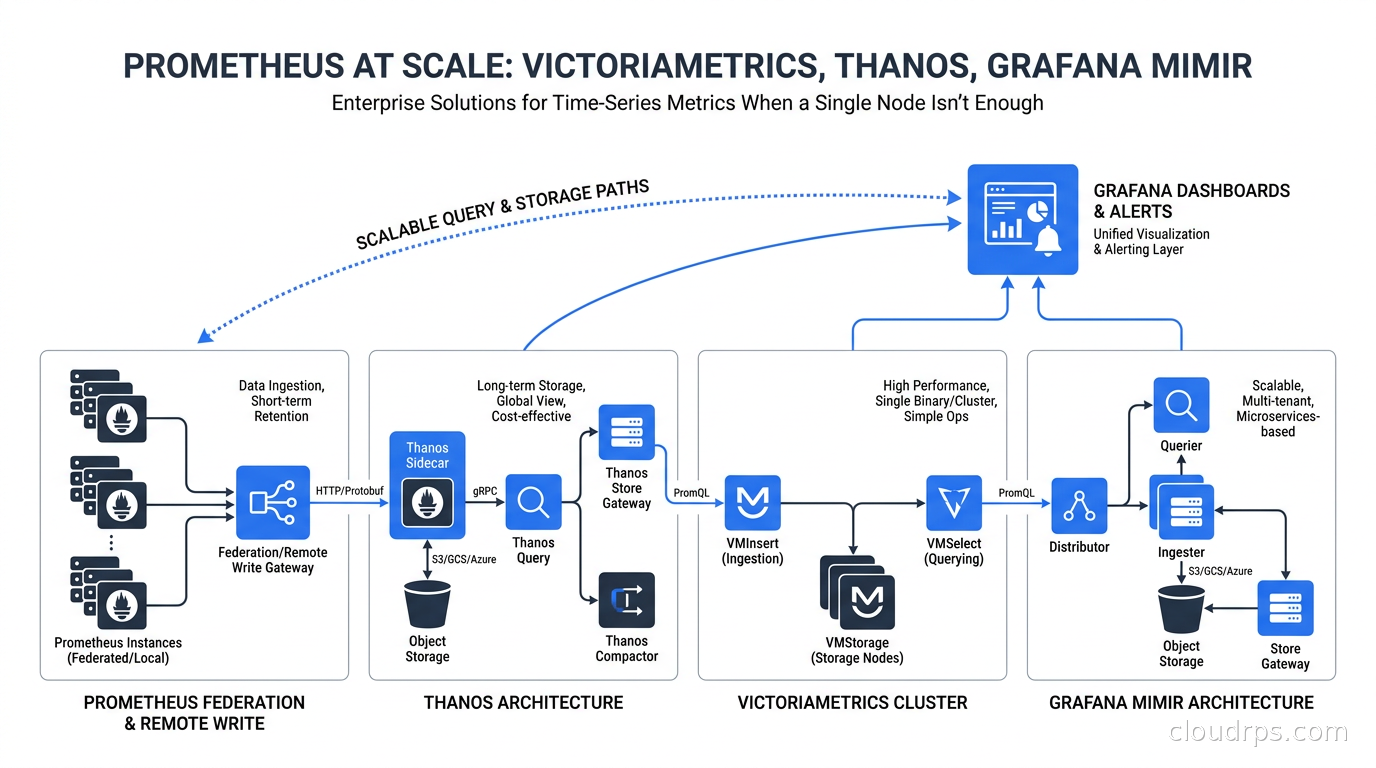
This article is about what to do when you’ve hit that wall, or when you want to design your way around it before you hit it. We’ll cover the three dominant solutions: Thanos, VictoriaMetrics, and Grafana Mimir, with the architectural nuances that actually matter when you’re choosing between them.
Why Single-Node Prometheus Breaks
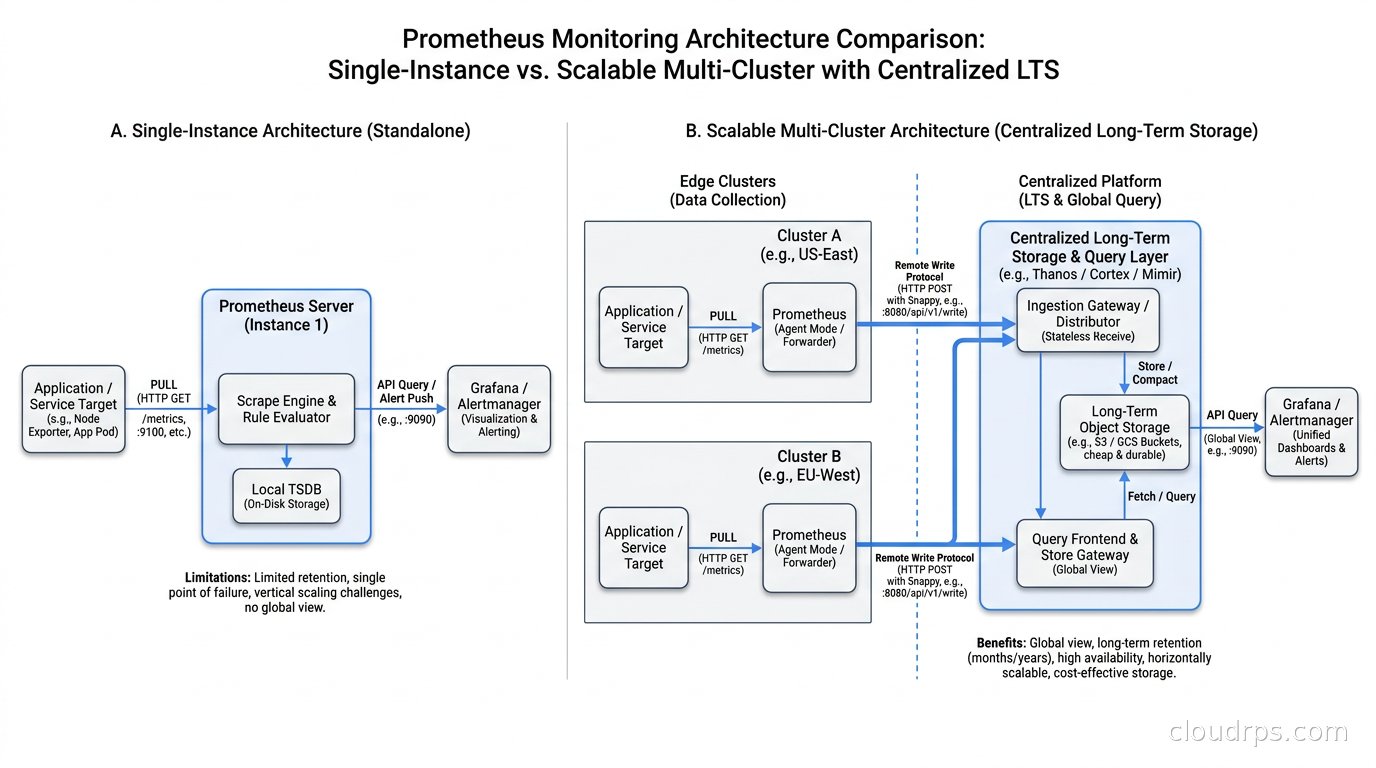
Before jumping to solutions, it’s worth understanding the specific failure modes. Prometheus is a pull-based time-series database that scrapes metrics from targets at regular intervals. Its local TSDB storage is excellent, but it has hard limits you will eventually encounter.
Memory pressure. Prometheus keeps its active series in memory. The rule of thumb is roughly 2-3 bytes per sample in memory, but the head block alone for large cardinality environments can consume tens of gigabytes of RAM. When you’re running 20 million active time series, you need a machine with serious RAM just to keep up.
Retention limits. Default Prometheus retention is 15 days. Extending it to 90 or 365 days with the --storage.tsdb.retention.time flag is possible, but disk consumption scales linearly and eventually becomes unmanageable. More importantly, a single disk failure or node eviction wipes your entire history.
Single point of failure. A single Prometheus instance means your monitoring goes down when that instance goes down. For most teams this is unacceptable, but the naive HA solution of running two Prometheus instances scraping the same targets produces duplicate series that break alerting and query semantics.
Multi-cluster visibility. Once you’re running more than one Kubernetes cluster, each cluster’s Prometheus only sees its own metrics. Getting a unified view requires either federation (which doesn’t scale) or a dedicated aggregation layer.
The classic mistake I see is Prometheus federation: setting up a global Prometheus that scrapes aggregated metrics from cluster-level Prometheus instances. Federation works until you want to query raw data from the global view, or until your cardinality grows enough that the federation scrapes themselves become a bottleneck. Federation was always a workaround, not a solution.
The Three Real Solutions
Thanos: Proven, Flexible, Complex
Thanos was originally developed at Improbable and open-sourced in 2018. It extends Prometheus by adding durable object storage, global querying, and high availability. It’s the solution that most teams turn to first because it plugs into existing Prometheus deployments without replacing them.
The core Thanos model is this: Prometheus instances keep scraping normally, but a Thanos Sidecar runs alongside each one, uploading completed TSDB blocks to object storage (S3, GCS, Azure Blob, etc.) every two hours. A separate Thanos Query component provides a global query layer that can read from both live Prometheus instances (via gRPC) and from long-term storage via Thanos Store Gateway and Thanos Compactor.
The component list for a full Thanos deployment:
- Thanos Sidecar - lives next to each Prometheus, uploads blocks to object storage, serves gRPC for live queries
- Thanos Query - global query layer, deduplicates results from multiple Prometheus replicas
- Thanos Store Gateway - serves queries against object storage
- Thanos Compactor - merges and downsamples blocks in object storage
- Thanos Ruler - handles recording rules and alerting rules against the global view
- Thanos Query Frontend - optional caching and query splitting layer
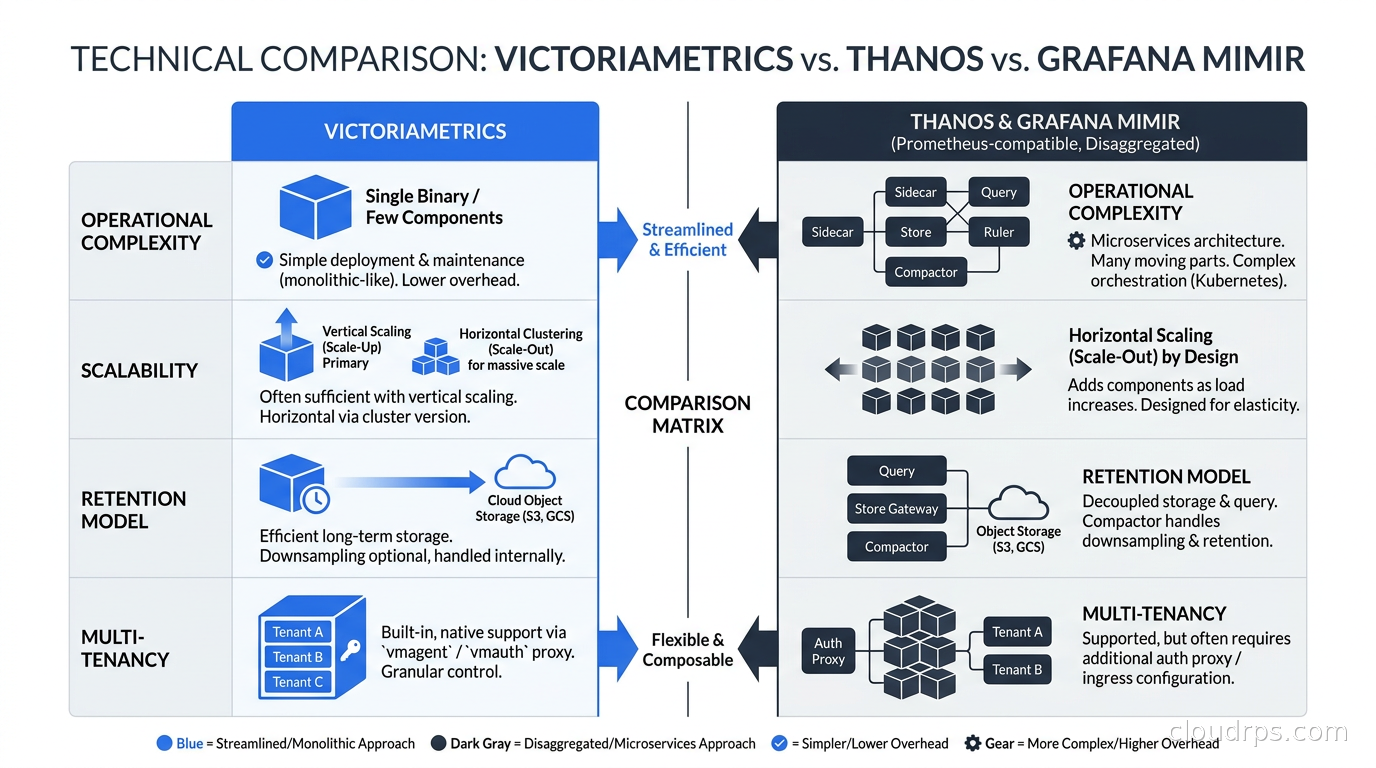
That’s six separate components, each of which needs to be deployed, configured, and operated. This complexity is Thanos’s biggest drawback. I’ve seen teams spend weeks getting deduplication working correctly, and the Thanos Query architecture means every query fans out to multiple backends and then merges results, which can introduce latency at query time.
Thanos’s Receiver mode is an alternative to the Sidecar model: Prometheus remote-writes to Thanos Receiver, which buffers and uploads to object storage. This is preferable when you can’t run a sidecar (managed Prometheus services, for example), but it changes the operational model significantly.
The key advantage Thanos has is deduplication semantics. When you run two Prometheus instances scraping the same targets (which you should for HA), Thanos can merge their time series and return deduplicated results. This is harder to achieve correctly than it sounds, but Thanos has been solving this problem for years.
A realistic Thanos deployment for a mid-sized organization looks something like this:
# Thanos Query - global query layer
containers:
- name: thanos-query
  args:
  - query
  - --store=thanos-store-gateway:10901
  - --store=prometheus-cluster-a:10901
  - --store=prometheus-cluster-b:10901
  - --query.replica-label=prometheus_replica
  - --query.auto-downsampling
The --query.replica-label flag is what makes deduplication work. Any two series that differ only by this label are considered duplicates and merged.
VictoriaMetrics: Performance-First, Drop-In Replacement
VictoriaMetrics took a fundamentally different approach. Rather than extending Prometheus, it replaces it. It’s a purpose-built time-series database that speaks the Prometheus query language (MetricsQL, which is PromQL-compatible with some extensions), accepts Prometheus remote write, and is designed from the ground up for high performance and low resource consumption.
The numbers are not subtle: VictoriaMetrics uses roughly 5-10x less RAM than Prometheus for equivalent data. Its custom compression algorithm achieves 70% smaller disk footprint than Prometheus TSDB on real-world workloads. These aren’t marketing claims - they’re reproducible in production environments.
For single-node deployments, VictoriaMetrics is a literal drop-in replacement. Change your Prometheus storage backend to VictoriaMetrics and nothing else in your stack needs to change. Grafana dashboards still work, existing PromQL queries still work, alerting rules still work.
The cluster version splits into three components:
- vminsert - stateless write layer, fans out data to vmstorage nodes
- vmselect - stateless query layer, fans in results from vmstorage nodes
- vmstorage - stateful storage layer, stores the actual time-series data
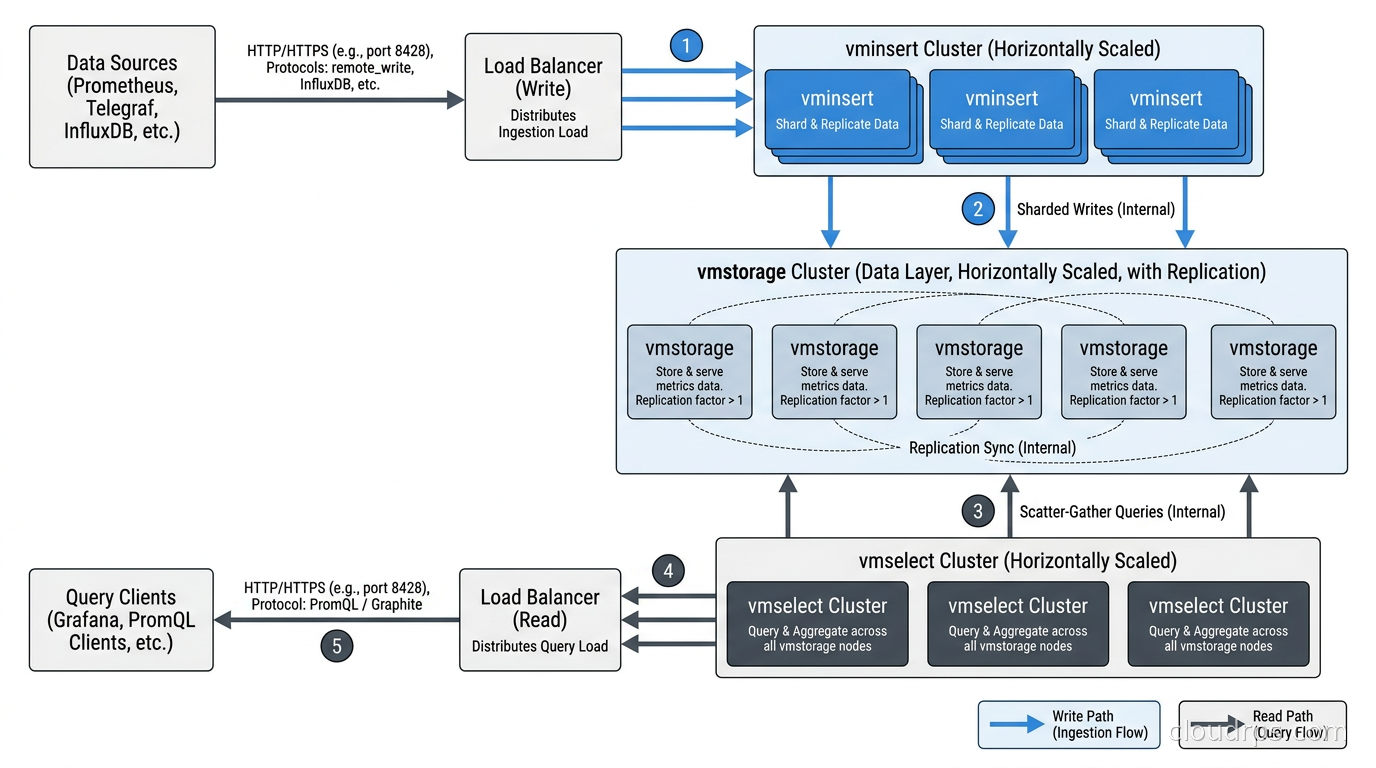
This architecture scales cleanly. vminsert and vmselect are stateless and scale horizontally without coordination. vmstorage scales by adding nodes, with automatic replication via the replication factor flag. A three-node vmstorage cluster with replication factor 2 tolerates a single node failure without data loss.
The VictoriaMetrics ecosystem has expanded significantly. Key components beyond the core database:
- vmagent - lightweight metrics collection agent that replaces Prometheus for scraping, with remote write support
- vmalert - evaluates alerting and recording rules, compatible with Prometheus rule format
- vmauth - authentication proxy with routing rules
- vmbackup/vmrestore - backup and restore to object storage
One thing I appreciate about VictoriaMetrics is the MetricsQL extensions. The keep_last_value() function fills gaps in sparse metrics, which is enormously useful for infrastructure metrics where targets go offline periodically. Prometheus PromQL will return no data for those gaps; MetricsQL can fill them in based on your instructions.
The main limitation: VictoriaMetrics uses its own storage format. Long-term storage is to local disk, not object storage, though vmbackup can snapshot to S3 or GCS. This is a different model than Thanos or Mimir, and it means your long-term retention is bounded by your disk capacity unless you set up a tiered backup strategy.
Grafana Mimir: Horizontally Scalable, Object-Storage Native
Grafana Mimir is the newest of the three, though it has the oldest lineage - it’s the spiritual successor to Cortex, the original horizontally scalable Prometheus solution developed at Weaveworks. Mimir is Cortex refactored, with a cleaner architecture, better performance, and full open-source licensing under AGPLv3.
The architectural philosophy of Mimir is fundamentally different from both Thanos and VictoriaMetrics: every component is designed to be stateless and horizontally scalable, with object storage as the primary data store. There’s no local disk that holds your canonical data. Object storage (S3, GCS, Azure Blob) is the system of record, and the various Mimir components are computation engines that read and write to it.
Mimir uses a consistent hashing ring (borrowed from Cassandra’s architecture) to distribute series across ingesters. Writes come into the distributor, which routes each series to the correct ingester based on the hash ring. Ingesters buffer data in memory and periodically flush to object storage blocks. Queriers serve queries by reading from both ingesters (for recent data) and object storage (for historical data). A compactor merges and optimizes blocks in object storage over time.
For large organizations that need genuine multi-tenant isolation, Mimir has a built-in tenancy model. Each tenant’s data is stored in separate object storage prefixes, with configurable per-tenant limits on cardinality, ingestion rate, and query time range. This is the feature that makes Mimir the choice for SaaS platforms that need to offer Prometheus-compatible monitoring to customers.
The operational complexity of Mimir is substantial. A production Mimir deployment typically includes: distributor, ingester, querier, query-frontend, query-scheduler, compactor, store-gateway, ruler, alertmanager, and the overrides-exporter. Each component needs independent scaling and monitoring. Grafana provides a Helm chart that manages this complexity reasonably well, but you still need to understand what each component does when things go wrong.
How to Actually Choose
I’ll give you the framework I use when evaluating which solution is right for a team.
Start with your scale. Single-node VictoriaMetrics handles up to 100 million active time series and roughly 2 million samples per second on capable hardware. This covers most organizations. If you’re not above 10 million active time series today and don’t expect to be in the next year, the single-node VictoriaMetrics is the right answer. It’s the simplest operational model.
Multi-cluster with moderate scale: Thanos. If you’re running 2-10 Kubernetes clusters and need a unified query view, Thanos is the most battle-tested option. The operational complexity is real but manageable, and the ecosystem tooling (especially Prometheus Operator’s Thanos integration) makes deployment substantially easier than it used to be. The Thanos Receiver mode simplifies the architecture by eliminating the sidecar.
High-throughput ingestion with existing Prometheus: VictoriaMetrics cluster. If you’re running a large fleet and need the ingestion throughput that VictoriaMetrics delivers, the cluster version gives you horizontal write scalability without rebuilding your entire monitoring stack. Your existing Prometheus instances remote-write to VictoriaMetrics. Existing dashboards and alerts work without modification.
Multi-tenant SaaS or massive scale with object storage budget: Mimir. Grafana Mimir makes sense when you need true horizontal scalability without disk provisioning concerns, or when you need hard per-tenant isolation. The object storage costs replace local disk costs, and at sufficient scale the economics work in Mimir’s favor because you’re not paying for SSD IOPS.
Managed options. Grafana Cloud uses Mimir under the hood. VictoriaMetrics offers VictoriaMetrics Cloud. Chronosphere, Coralogix, and Observe.Inc offer Prometheus-compatible managed services. If your team doesn’t want to operate the storage layer, managed options are increasingly compelling. I’ve seen the total cost of operating Thanos at scale (engineer time, compute, storage) significantly exceed the cost of managed alternatives once you factor in the expertise required.
The Cardinality Problem Nobody Wants to Talk About
None of these solutions fully solve cardinality explosion, because cardinality explosion is a data modeling problem, not a storage problem.
High cardinality is what happens when someone adds a label that has unbounded values. Customer ID as a Prometheus label. Request ID as a Prometheus label. User agent string as a Prometheus label. Each unique combination of label values creates a new time series. Ten million customers each making ten requests per minute generates time series that will overwhelm any system.
I’ve seen this happen with well-intentioned instrumentation. A developer adds user_id as a label to track per-user request latency. Sounds reasonable. The application has 500,000 active users. Prometheus suddenly has 500,000 new time series for that one metric. Add a few more high-cardinality labels and you’ve created a cardinality bomb.
The fix is data modeling, not scaling. High-cardinality data belongs in a different store, typically a distributed tracing system or a log analytics system. For Prometheus, the rule is: labels should have bounded, low cardinality values. Status codes, HTTP methods, service names, environment names. Not user IDs, not request IDs, not order IDs.
Observability pipelines like those covered in our observability pipeline guide with OpenTelemetry Collector and Cribl can help here - you can drop high-cardinality labels before they reach your metrics store, or route that data to a more appropriate backend.
VictoriaMetrics, Thanos, and Mimir all expose cardinality exploration tools. Use them. Set up alerts on cardinality growth. The worst incidents I’ve dealt with in monitoring infrastructure started with unbounded label cardinality that nobody noticed until it was too late.
Getting Retention Right with Object Storage
All three solutions support object storage for long-term retention, and object storage is the right answer at scale. The economics are compelling: S3 Standard storage costs roughly $23 per terabyte per month, compared to $50-150 per terabyte for SSD storage in cloud environments. For 12-month metric retention at scale, the difference is significant.
The implementation details matter. Thanos compacts data blocks and downsamples them in object storage - raw data at 2-hour blocks, 5-minute downsampling for data older than 40 days, 1-hour downsampling for data older than 10 months. This means you can query 2 years of metrics with reasonable performance because you’re not reading raw samples.
VictoriaMetrics with vmbackup creates incremental snapshots to object storage but doesn’t do long-term downsampling natively. If you need multi-year retention with VictoriaMetrics, you’re typically looking at tiered storage configurations or using VictoriaMetrics alongside an object storage query layer.
Mimir stores all data in object storage as parquet-style TSDB blocks and handles compaction transparently. The compactor merges small blocks into larger ones and applies downsampling over time. The result is predictable, automatic long-term storage that doesn’t require separate configuration.
For any of these systems, I recommend separate object storage buckets with lifecycle policies: keep raw data for 90 days, move to infrequent access tier after 90 days, expire after your retention period. The lifecycle policy saves 50-60% on storage costs for the historical tail.
The Monitoring-for-Monitoring Problem
Here’s a practical concern that sounds meta but matters in production: how do you monitor your monitoring infrastructure?
With Thanos, your Prometheus instances are still running normally. If Thanos query is slow or unavailable, you can still alert from individual cluster Prometheus instances. The separation of concerns is operationally valuable.
With VictoriaMetrics cluster, the vmstorage nodes need monitoring. vmagent provides metrics about ingestion, and vmselect exposes query metrics. But you need a separate lightweight Prometheus or VictoriaMetrics single-node instance that monitors the cluster components themselves - avoid the obvious circular dependency.
Mimir ships with a comprehensive set of dashboards and alerts for its own components. The Grafana Mimir operational runbook is one of the better pieces of operational documentation I’ve seen. But again, you need a monitoring-of-monitoring layer that isn’t Mimir itself.
In practice, I run a small, simple Prometheus instance (single-node, 7-day retention) specifically for monitoring infrastructure health. It doesn’t need to be scalable because it’s only watching a handful of components. This avoids the circular dependency and gives you a reliable signal when the main monitoring system is having problems. This is consistent with the observability practices described in our Prometheus, Loki, and Grafana production guide.
Kubernetes-Specific Considerations
If you’re running these systems on Kubernetes, the Prometheus Operator (and its fork, the Victoria Metrics Operator) dramatically simplifies management. The Prometheus Operator introduces ServiceMonitor and PodMonitor custom resources that let application teams declare their own scrape configurations without touching the central Prometheus config.
The Thanos integration with Prometheus Operator is mature. Enabling Thanos sidecar is a few lines in the Prometheus CRD:
apiVersion: monitoring.coreos.com/v1
kind: Prometheus
metadata:
  name: cluster-prometheus
spec:
  thanos:
    image: quay.io/thanos/thanos:v0.34.0
    objectStorageConfig:
      name: thanos-objstore-secret
      key: config
For VictoriaMetrics, the VMSingle and VMCluster CRDs in the VictoriaMetrics Operator provide equivalent functionality. The VMAgent CRD replaces Prometheus entirely for scraping when you want a fully VictoriaMetrics-native stack.
On the observability side, scaling Prometheus is one part of the picture. Complementing it with continuous profiling via Pyroscope or Parca gives you the CPU-level visibility that metrics alone can’t provide - profiling catches the specific function calls burning CPU that counters only hint at.
The persistent storage requirements for each system interact with your Kubernetes storage architecture. VictoriaMetrics vmstorage needs fast local SSDs for the hot data path, which means StorageClass backed by SSDs, not general-purpose network attached storage. Mimir’s ingesters need write-ahead log storage that’s fast but not large. This connects directly to the design considerations in Kubernetes persistent storage with CSI, Rook/Ceph, and Longhorn.
When Managed Services Win
I want to be direct about this: at a certain scale and staffing ratio, running any of these systems yourself is the wrong choice.
If you have fewer than three experienced platform engineers and your organization’s core competency isn’t infrastructure, a managed Prometheus-compatible service is almost certainly cheaper in total than running Thanos or Mimir yourself. The hidden cost is the engineering time to operate, upgrade, debug, and on-call for these systems. Thanos, Mimir, and VictoriaMetrics are all operationally demanding.
Grafana Cloud, Chronosphere, Coralogix, and AWS Managed Service for Prometheus (which uses Cortex under the hood) all provide Prometheus-compatible endpoints that accept remote write. The economics are roughly $0.10-0.50 per million samples ingested plus storage. At moderate scale this is significantly cheaper than the engineering labor cost of self-hosting.
The case for self-hosting is strong when: you have regulatory requirements that prevent third-party data processors from seeing your metrics, you’re at a scale where managed costs become prohibitive, or you have the platform team to absorb the operational overhead.
My Current Recommendation
For most organizations arriving at the “Prometheus isn’t scaling” moment in 2026, I recommend starting with VictoriaMetrics single-node. It’s a 30-minute migration from Prometheus (change the remote write endpoint, switch your long-retention scraper), the resource reduction is immediately visible, and it handles a surprisingly large workload. You’re not adding operational components, you’re replacing one with a more efficient version.
If you’re past single-node capacity or you have explicit multi-cluster requirements, VictoriaMetrics cluster is my second choice. The architecture is clean, the performance is outstanding, and the MetricsQL extensions make complex queries more readable than equivalent PromQL.
Thanos makes sense if you’re already heavily invested in the Prometheus Operator ecosystem and need the native integration, or if you have specific deduplication requirements that VictoriaMetrics doesn’t handle the same way. The Receiver mode specifically has gotten much more stable in recent releases.
Mimir is the right choice for genuine multi-tenant scenarios and for teams that want an architecture where “add more nodes to scale” works without exception at every layer. The operational complexity is high, but for platform teams building monitoring-as-a-service for internal customers, the tenancy model is hard to replicate elsewhere.
Whatever you choose, start by fixing your cardinality problems first. Then make sure your SLO/error budget tracking is properly separated from the observability layer that’s under stress. The monitoring system is load-bearing infrastructure, and it deserves the same architectural care you’d give your primary database.
I’ve rebuilt monitoring stacks at organizations ranging from 50-person startups to multi-thousand-node clusters. The teams that got it right were the ones that treated observability as a product they shipped to their engineers, not infrastructure they bolted on after the fact. Prometheus at scale is not a trivial problem, but with the right architecture it’s a solved one.
Get Cloud Architecture Insights
Practical deep dives on infrastructure, security, and scaling. No spam, no fluff.
By subscribing, you agree to receive emails. Unsubscribe anytime.