The first time I heard someone describe their reliability strategy as “we have a 99.9% uptime SLA,” I asked what they actually measured. Turns out they measured nothing. The number came from their legal team negotiating with a vendor five years earlier and had somehow become gospel. That company had experienced three major outages in the past year, each lasting four or more hours, but nobody had ever done the math to notice they were way below their stated SLA.
This is the reality for most organizations. They have SLAs that are either untracked, unmeasurable, or completely disconnected from user experience. The Google SRE book introduced a framework that changed how I think about reliability entirely: Service Level Indicators (SLIs), Service Level Objectives (SLOs), and error budgets. After implementing this at multiple organizations, I can say it’s the most useful operational framework I’ve encountered.
Let me give you the practitioner’s version, not the theory.
The Three Concepts and Why the Distinction Matters
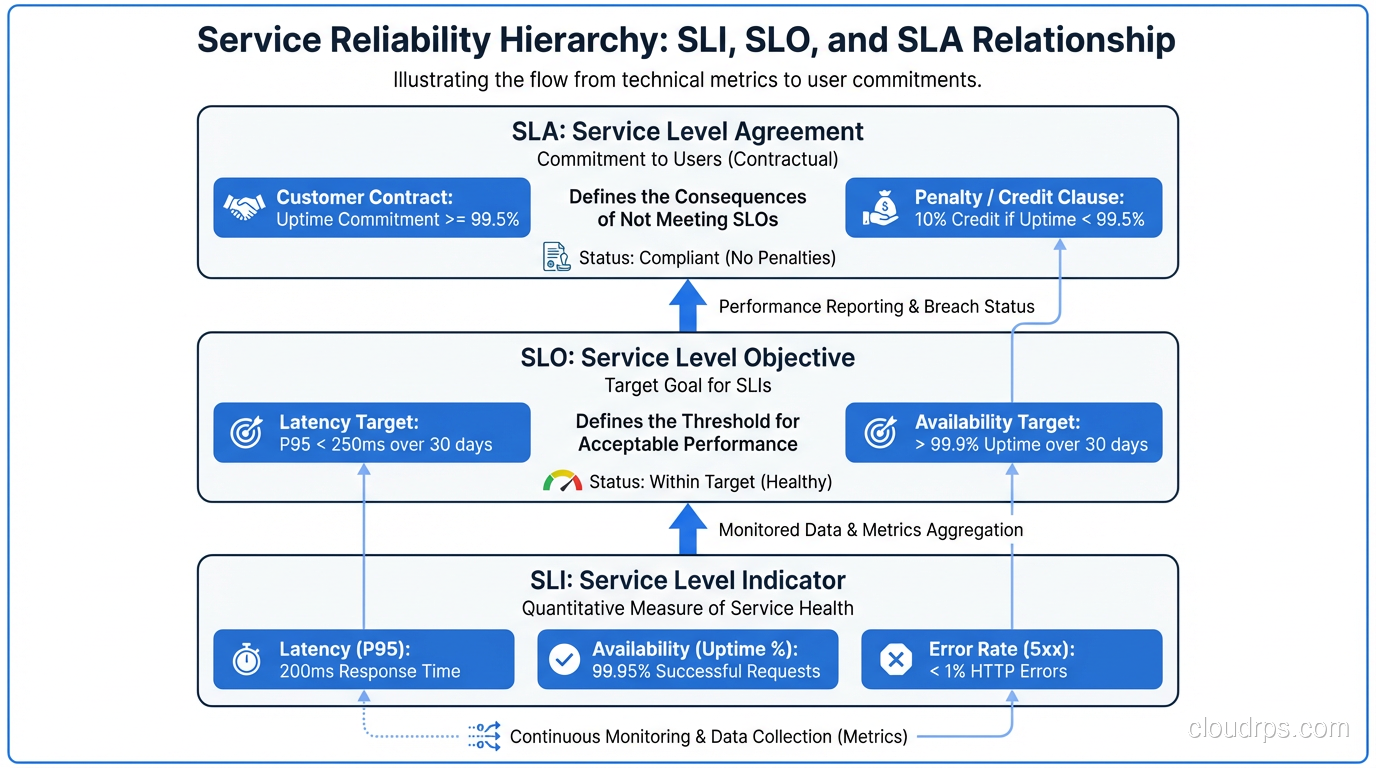
SLA (Service Level Agreement): A contract with teeth. Usually involves money, legal language, and remedies when violated. SLAs are almost always defined too loosely to be operationally useful. “99.9% availability” without defining what “available” means is a SLA. Almost every SLA I’ve seen is written to be hard to violate rather than to reflect what users actually experience.
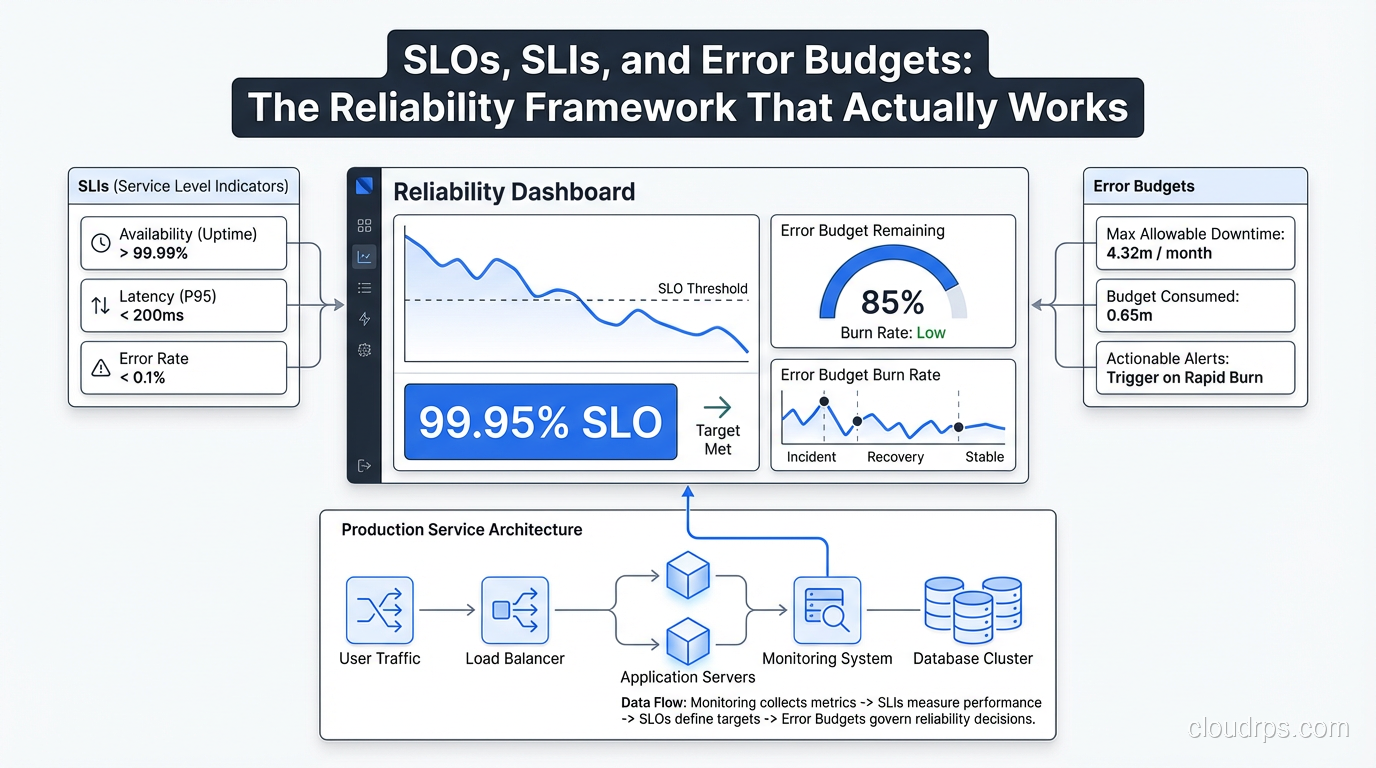
SLO (Service Level Objective): An internal target for a specific behavior. “99.5% of requests to the payment API return in under 200ms over a 30-day rolling window.” SLOs should be precise, measurable, and slightly more ambitious than your SLA. The SLO is what you operate against.
SLI (Service Level Indicator): The actual metric you measure. The ratio of good events to total events. An SLI for request latency might be: “(requests completing in under 200ms) / (total requests).” Your SLO is “this SLI must be >= 99.5%.”
The relationship: SLI is what you measure, SLO is the target you set for the SLI, SLA is the legal commitment you make to customers (usually based on your SLO with a buffer).
The reason this framework is powerful is that it forces precision. You can’t have a vague SLI. Either requests meet the latency threshold or they don’t. Either the service responded successfully or it didn’t. This precision is what makes the error budget concept work.
Choosing the Right SLIs
The hardest part of implementing this framework isn’t the math. It’s picking SLIs that actually reflect user experience.
The most common mistake is instrumenting what’s easy to measure rather than what matters. CPU utilization is easy to measure. It’s almost never a useful SLI. The question to ask is: “Would a user care about this?” A user doesn’t care about your CPU. They care about whether the page loaded, whether the payment processed, whether their message was delivered.
The four categories of SLIs that most user-facing services need:
Availability: What fraction of requests succeeded? This is the “did it work?” metric. A failed request (5xx error, timeout, connection refused) is a bad event. A successful response (2xx, 3xx, even 4xx client errors) is a good event.
availability_SLI = successful_requests / total_requests
Latency: What fraction of requests completed within an acceptable time? The critical insight here is that mean latency is useless. Use percentiles. p99 latency tells you what the worst 1% of users experience. p50 tells you the median. I usually define latency SLIs at both p95 and p99.
latency_SLI = requests_under_threshold_ms / total_requests
Quality/Correctness: Did the service return the right answer? This is relevant for data services, ML models, search, or anything where “technically responded” isn’t enough. Harder to measure but often the most important.
Freshness/Coverage: For data pipelines and batch systems, is the data current? “What fraction of requests returned data less than 1 hour old?” is a freshness SLI.
One pattern that works extremely well for HTTP services is using your existing monitoring infrastructure and treating any request where the response time exceeded your threshold OR the status code was 5xx as a “bad minute.” This gives you a clean time-based SLI that’s easy to explain to stakeholders.
Some SLIs I’ve found particularly valuable in production:
For APIs: error rate (non-5xx / total), p99 latency For databases: query success rate, p95 query latency For message queues: delivery success rate, end-to-end latency For batch jobs: job completion rate, job completion within SLA time window For CDNs: cache hit rate, origin error rate
What you should not use as SLIs: CPU utilization, memory usage, disk I/O, network throughput, queue depth. These are symptoms, not causes, and they don’t map to user experience.
Setting SLO Targets
Once you have SLIs, you need targets. The instinct is to set the target as high as possible. “Let’s aim for 99.99%!” Resist this instinct. High targets have consequences.
99.9% availability means you can be down 8.7 hours per year. 43.8 minutes per month. That sounds like a lot, but it gives you room to deploy, to do maintenance, to have partial failures without emergency all-hands incidents.
99.99% means 52.6 minutes per year. 4.4 minutes per month. That’s not “we have a brief outage.” That’s “every second of elevated error rate triggers a page.” At 99.99%, you’re running in permanent panic mode unless you have an extremely mature platform.
My approach: start by measuring actual performance for 30 days before setting any targets. You’ll often find that you’re running at 99.7% and you had no idea. Set your first SLO at your current performance level minus a small safety margin (maybe 0.2%). Then, as you improve reliability, tighten the SLO. Setting an aspirational target you can’t hit just poisons the concept.
A useful starting point for most internal services: 99.5% availability SLO. For user-facing services: 99.9%. For critical payment or auth paths: 99.95%. For the single service that everything depends on: maybe 99.99%, but understand what that requires operationally.
For latency, I typically set:
- p99 under X ms where X is “95th percentile of your current p99 latency over the past 30 days”
- p95 under Y ms where Y is “95th percentile of your current p95 latency”
This anchors your SLO to observed reality and gives you a baseline to improve from.
Error Budgets: Where the Framework Gets Interesting
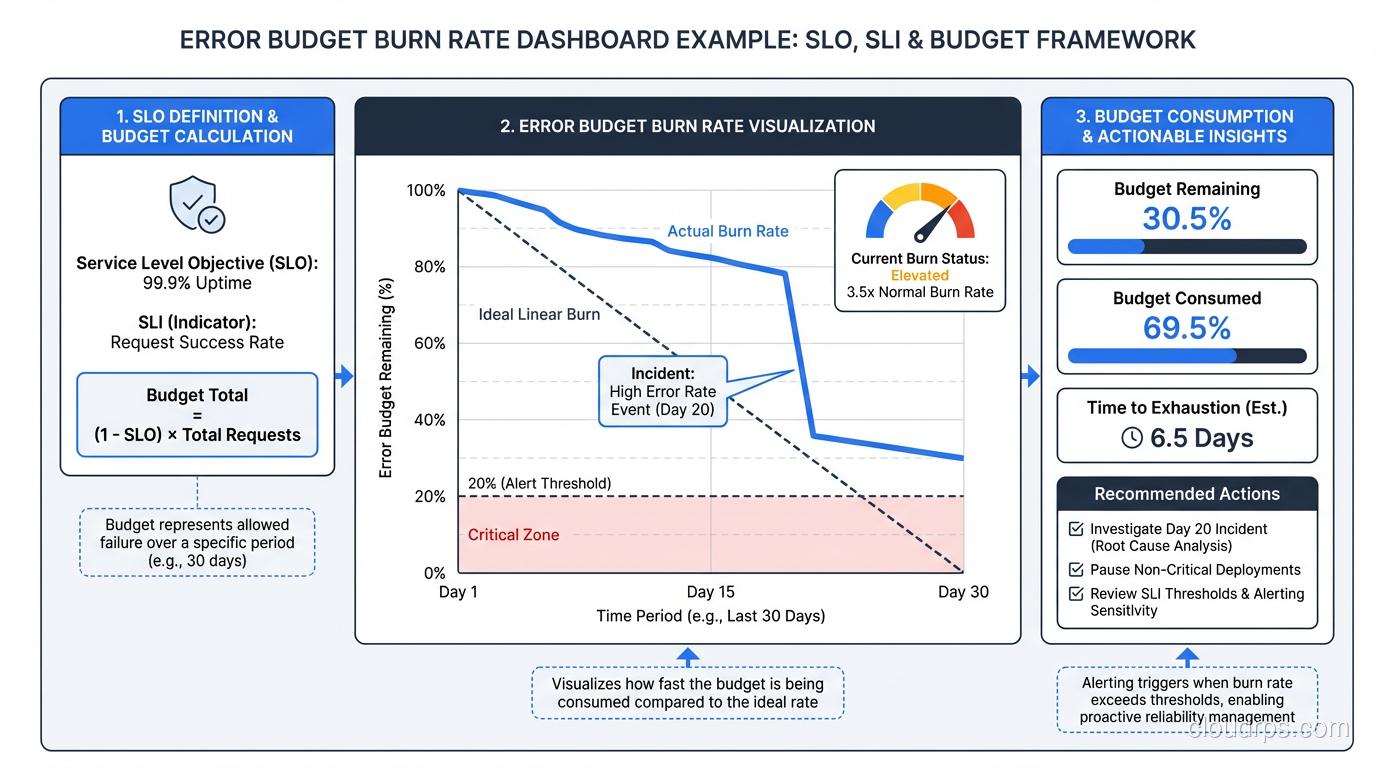
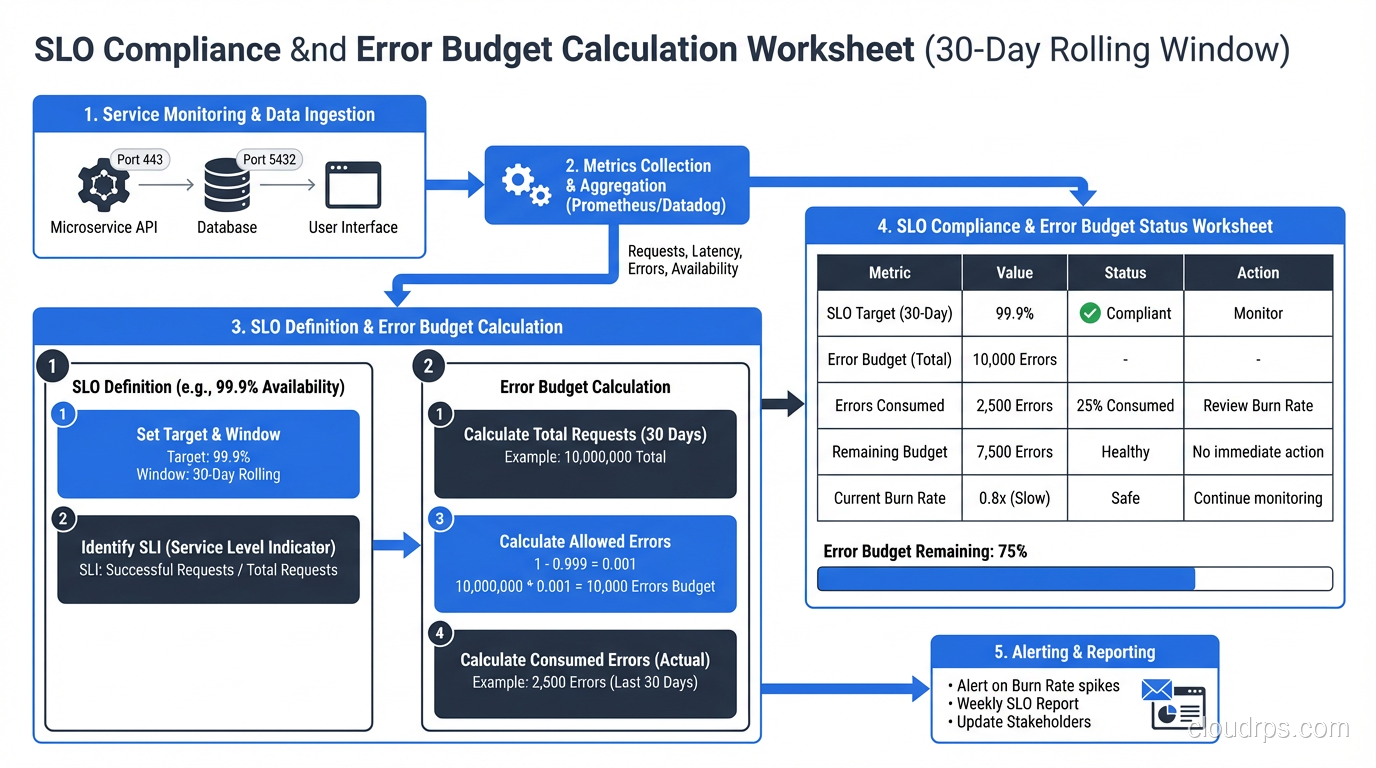
An error budget is the flip side of an SLO. If your SLO is 99.9% availability, your error budget is 0.1% of requests. In a 30-day window of 1 million requests, that’s 1,000 bad requests. You can spend those requests on deploys that cause brief elevated error rates, on planned maintenance, on experiments.
The critical insight is that the error budget makes reliability a shared resource between development velocity and operational stability. Previously, “can we deploy?” was a judgment call. With error budgets, it’s a policy question: “Do we have budget?”
Here’s how the error budget changes behavior:
If you have budget remaining: Ship features. Experiment. Accept that some changes cause small reliability hits. The math says you can absorb them.
If your budget is nearly exhausted: Slow down. No new features until reliability improves. Focus engineering effort on fixing the issues burning through your budget.
If your budget is exhausted: Feature freeze. Only reliability work until the budget recovers. This is not a punishment; it’s the system working as designed. It means your users have been experiencing below-acceptable service and they deserve better before you add more complexity.
This is the policy part: you need agreement in advance, from engineering and product leadership, that a depleted error budget actually triggers a feature freeze. The policy only works if it has teeth. If you can always get an exception, the system collapses into “we have a 99.9% SLO but we don’t actually enforce it,” which is right back where you started.
Measuring and Alerting on SLOs
You need to measure SLIs continuously and calculate SLO compliance in near-real-time. The tooling ecosystem here is solid.
Prometheus with Sloth or Pyrra: Sloth is a tool that generates Prometheus recording rules and alerting rules from a high-level SLO definition. You define your SLOs in a simple YAML file and Sloth generates the multi-window multi-burn-rate alerts that are the recommended way to alert on SLOs.
Google Cloud Operations (formerly Stackdriver): Has native SLO support. Define your SLO in the console, point it at a metric, and it calculates error budget burn rate automatically.
Datadog SLOs: Similar first-class support. If you’re already in Datadog, this is the easiest path.
The key alerting concept is burn rate. Rather than alerting “SLO is violated,” you alert on the rate at which you’re consuming your error budget. A burn rate of 1x means you’re consuming budget at exactly the rate that would exhaust it by the end of the window. A burn rate of 14x means you’d exhaust 14 days of budget in 1 day.
Multi-window alerting catches both slow burns (low traffic, gradual errors) and fast burns (sudden spike):
# Alert when burn rate is fast - page immediately
- alert: HighErrorBudgetBurnRate
  expr: |
    (
      error_budget_burn_rate_1h > 14
      and
      error_budget_burn_rate_5m > 14
    )
  labels:
    severity: critical
  annotations:
    summary: "Error budget burn rate is critically high"

# Alert when burn rate is moderate - ticket/Slack
- alert: ModerateErrorBudgetBurnRate
  expr: error_budget_burn_rate_6h > 3
  labels:
    severity: warning
This connects directly to your distributed tracing setup. When an SLO burn rate alert fires, the first thing you do is look at traces to find the bad requests that are consuming your budget. The SLO tells you there’s a problem; the traces tell you where.
Practical Advice from the Trenches
Start with one service. Don’t try to instrument everything at once. Pick one service that has clear users and clear user expectations. Get the full loop working: SLI measurement, SLO defined, error budget calculated, alerts set up, policy agreed to. Then expand.
Put SLO dashboards in the room. Literally. The team’s main monitoring screen should show error budget consumption alongside feature work. When the error budget is at 70% consumed with two weeks left in the month, that’s visible context for every sprint planning conversation.
Don’t set SLOs for SLOs’ sake. I’ve seen teams define 30 SLOs for a single service and then promptly ignore all of them because the noise is overwhelming. Two to four SLOs per service is usually right: one for availability, one for latency, maybe one for freshness or quality if applicable.
Build error budget into your deployment process. Add a pre-deploy check that reads current error budget consumption. If budget is below 20% remaining, require explicit approval. This makes the budget real and operational rather than a dashboard curiosity.
Be honest about measurement gaps. If you’re behind a load balancer and don’t have per-service request metrics, you need to fix that instrumentation before you can set meaningful SLOs. Fake precision (setting an SLO you can’t actually measure) is worse than having no SLO.
The chaos engineering practices at mature organizations often use error budgets directly: you’re only allowed to run chaos experiments when your error budget is healthy. If you’re at 90% budget consumed, running a Chaos Monkey experiment is irresponsible. The budget provides objective criteria for when experimentation is safe.
Distinguish between user-facing and internal SLOs. Your user-facing SLOs are what determines whether you wake someone up at 2am. Your internal infrastructure SLOs (database availability, message queue latency) should be set tighter than your user-facing ones, because they’re what your user-facing SLOs depend on. The fault tolerance model is layered: infrastructure SLOs buffer the user-facing SLOs.
The Organizational Side
I want to be direct about this: the tooling is the easy part. The organizational change is hard.
Product teams don’t want feature freezes. They’ll argue that the error budget policy is inflexible, that the specific outage was a special case, that users “didn’t really notice.” You’ll need executive air cover for the first few times the policy is enforced. Without it, the first feature freeze that happens will be the last time the framework is taken seriously.
The counter-argument that works: “Without this policy, reliability improvements never happen because they’re always lower priority than the next feature. The error budget policy is the mechanism that forces reliability work to get prioritized. If you want to keep shipping features forever, you need to invest in reliability now.”
The other organizational challenge is attribution. When an error budget is consumed, whose fault is it? Don’t let this become a blame game. Error budget consumption is information. It tells you where to invest. The team running the service that’s consuming budget fastest needs more reliability investment, not a performance review.
SLOs connected to disaster recovery planning create another useful metric: the error budget impact of a simulated DR scenario. If your DR test would consume 40% of your monthly budget, that tells you something important about your recovery procedures. Tie it to your RTO/RPO targets and you have a complete reliability picture.
Implementing this framework properly takes three to six months to get right. The tooling setup is a day or two. The calibration of SLO targets takes a month of measurement. Getting the organizational alignment takes ongoing effort. But once it’s working, it changes the entire conversation about reliability from “we need to be more reliable” (vague, unactionable) to “we’re burning budget at 3x rate, here’s what’s causing it, here’s the fix” (specific, actionable, measurable).
That’s a conversation worth having.
Get Cloud Architecture Insights
Practical deep dives on infrastructure, security, and scaling. No spam, no fluff.
By subscribing, you agree to receive emails. Unsubscribe anytime.