The way I have historically learned about production outages falls into two categories: my own alerting firing before users noticed, or a Slack message that said “hey, is the site down?” Usually the latter came from a customer, through a support ticket, with enough frustration attached that there was already a reputation problem before I even opened my laptop.
Synthetic monitoring fixed that for me. After twenty years of building and running cloud infrastructure, I can tell you with confidence that proactively simulating user traffic is the single most effective way to catch failures before they become incidents. Not because the concept is complicated, it is not, but because most teams underinvest in it, treat it as an afterthought, or confuse it with load testing.
This article is about building a production-grade synthetic monitoring strategy with Checkly, Grafana k6, and related tooling. I will cover the architecture, what to monitor, how to write checks that actually catch real failures, and how to integrate synthetic data into your SLO tracking and incident response.
What Synthetic Monitoring Actually Is
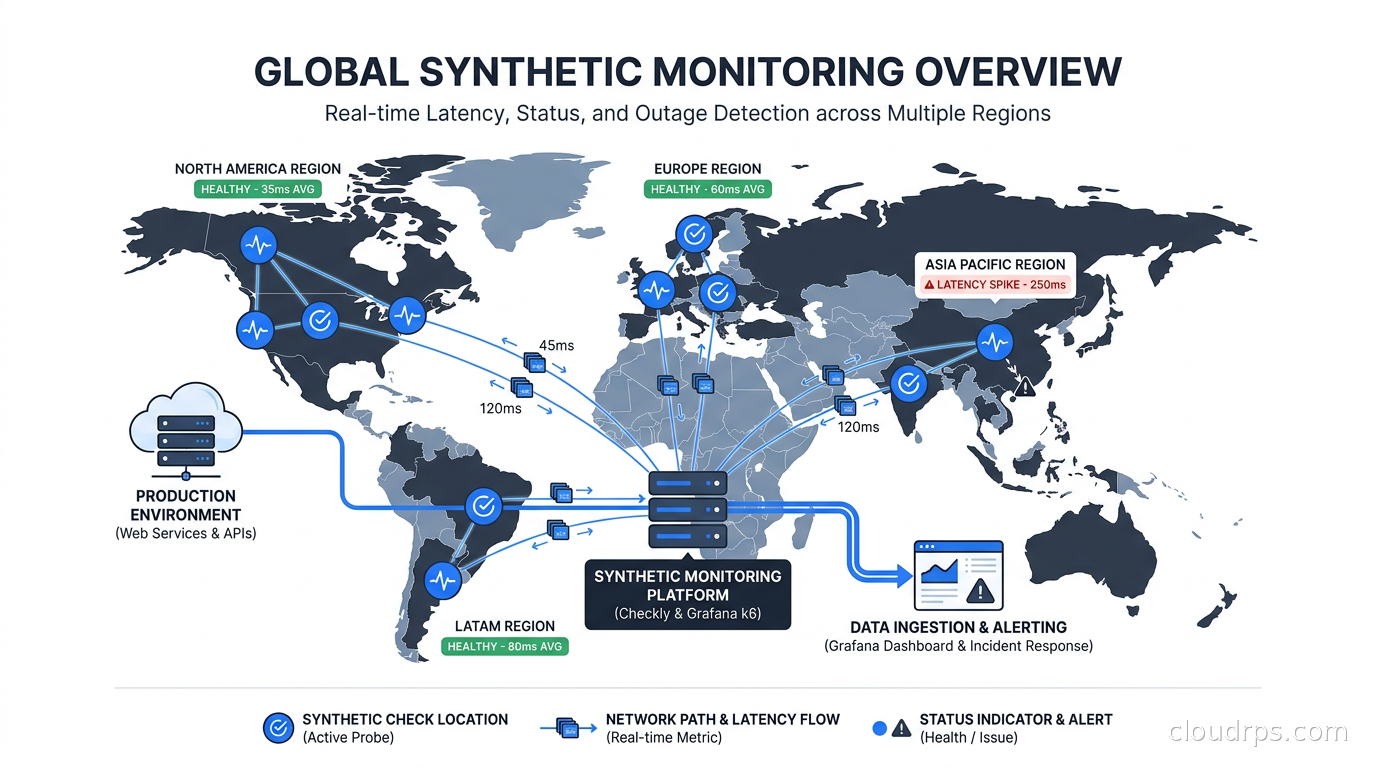
Synthetic monitoring means running scripted, simulated user interactions against your production systems on a schedule, from multiple geographic locations, and alerting when they fail. The script is “synthetic” because it is not real user traffic. It is controlled, repeatable, and predictable. You define exactly what should happen, and the monitor tells you when it does not.
This is distinct from two related concepts that often get conflated with it.
Real-user monitoring (RUM) instruments your actual users. JavaScript snippets in the browser or SDK calls in mobile apps capture performance and errors as real people use your product. RUM tells you what users experienced. Synthetic monitoring tells you what users would experience if they tried right now.
Passive observability, which includes metrics, logs, traces, and the Prometheus and Grafana stack, captures signals from real traffic. If nobody is using your checkout flow at 3 AM, your dashboards look fine even if the feature is completely broken. Synthetic monitoring fills that gap.
The combination you actually want is all three layers. But if I had to pick one layer to build first for a new system, I would pick synthetic monitoring. The feedback loop is immediate, the signal is clean, and you control exactly what gets tested.
The Tool Landscape in 2026
The major players are Checkly, Grafana k6, Datadog Synthetics, New Relic Synthetics, and a handful of niche tools like Honeycomb’s newer offerings and various open-source Playwright-based runners.
Here is my honest assessment of each tier:
Checkly is my current recommendation for most teams. It is built specifically for synthetic monitoring, uses Playwright under the hood for browser checks, and has an excellent “monitoring as code” workflow via their CLI and Terraform provider. You define checks in JavaScript or TypeScript, version-control them, and deploy them through your CI pipeline. The API is clean, the alerting integrations are solid, and the pricing is reasonable at scale. The fact that it runs on top of AWS Lambda globally means low overhead and genuinely fast check execution.
Grafana k6 is the right tool when you want to unify load testing and synthetic monitoring in the same framework. k6 scenarios can run as continuous synthetic checks (low VUs, high frequency) or as load tests (high VUs, one-time runs). If your team already uses Grafana Cloud, the integration is seamless. The scripting model is JavaScript-based and comfortable for most developers.
Datadog Synthetics makes sense if you are already deep in the Datadog ecosystem and want everything in one pane of glass. The tooling is mature, the geo-distribution is wide, and the correlation between synthetic failures and APM traces is genuinely useful. The cost at scale is the limiting factor.
For small teams or early-stage products, even a simple uptime monitor like BetterUptime provides real value. But you will hit their limitations quickly as your checks become more complex.
What to Monitor: Building Your Check Portfolio
The mistake I see most often is monitoring the homepage. Teams set up a check that hits https://yourapp.com, gets a 200, and declare victory. The homepage is usually the last thing to break because it is cached, simple, and has no external dependencies. Meanwhile, the checkout API is returning 503, the password reset email is not sending, and your authentication token exchange is timing out.
Start with your critical user journeys. Not infrastructure endpoints, but user journeys. Ask yourself: if I could only know one thing about whether my product is working right now, what would it be? For an e-commerce site, it is probably “can a user find a product, add it to the cart, and initiate checkout?” For a SaaS product, it might be “can a user log in and load their dashboard?” For an API-first product, it is “are the top three endpoints returning valid responses within SLA?”
Here is a practical framework for building your initial check portfolio:
Tier 1: Critical path checks (run every minute). These are the flows that, if broken, mean your product is essentially down. Authentication, core data retrieval, payment initiation. Keep these lean. You want them fast and focused. A Tier 1 check should complete in under 10 seconds and alert within 3 minutes of failure.
Tier 2: Important feature checks (run every 5 minutes). Features that matter to significant user segments but are not core to the product. Email delivery confirmation, notification sending, third-party integrations. These can be slightly more complex.
Tier 3: Canary checks for integrations (run every 15-30 minutes). External dependencies, partner APIs, data pipeline outputs. These catch failures in your dependency graph that may not surface in your own metrics.
The total number of checks should reflect your product complexity, but I typically start teams at 10-15 checks and grow from there. More than 50 checks usually means you are monitoring infrastructure instead of user journeys.
Writing Checks That Actually Catch Failures
Most synthetic monitoring articles show you the happy path: “here is how to write a check that GETs your API and asserts a 200 response.” That is table stakes. The checks that actually save you are the ones that validate behavior, not just status codes.
Here is a bad API check:
import http from 'k6/http';
import { check } from 'k6';

export default function () {
  const res = http.get('https://api.yourapp.com/health');
  check(res, { 'status is 200': (r) => r.status === 200 });
}
This check passes when the health endpoint returns 200 even if the database connection is severed and every real API request is returning 503. Health endpoints often lie. Yours probably does too.
Here is a better check:
import http from 'k6/http';
import { check } from 'k6';

export default function () {
  // Create a resource (tests write path)
  const createRes = http.post(
    'https://api.yourapp.com/v1/items',
    JSON.stringify({ name: 'synthetic-test-item', test: true }),
    {
      headers: {
        'Content-Type': 'application/json',
        'Authorization': `Bearer ${__ENV.SYNTHETIC_API_KEY}`
      }
    }
  );

  check(createRes, {
    'item created': (r) => r.status === 201,
    'response has id': (r) => JSON.parse(r.body).id !== undefined,
  });

  const itemId = JSON.parse(createRes.body).id;

  // Fetch the resource (tests read path and consistency)
  const getRes = http.get(`https://api.yourapp.com/v1/items/${itemId}`, {
    headers: { 'Authorization': `Bearer ${__ENV.SYNTHETIC_API_KEY}` }
  });

  check(getRes, {
    'item retrieved': (r) => r.status === 200,
    'item name matches': (r) => JSON.parse(r.body).name === 'synthetic-test-item',
    'latency under 500ms': (r) => r.timings.duration < 500,
  });

  // Clean up (do not pollute production data)
  http.del(`https://api.yourapp.com/v1/items/${itemId}`, null, {
    headers: { 'Authorization': `Bearer ${__ENV.SYNTHETIC_API_KEY}` }
  });
}
This tests both the write and read paths, validates data consistency, asserts latency, and cleans up after itself. When this check fails, I know something is actually broken in the user-facing data layer.
The cleanup step is important and often forgotten. Synthetic checks that write data to production without cleaning up will eventually pollute your analytics, trigger billing webhooks, and create noise in your real-user data. Use dedicated test accounts, mark synthetic data with a flag, and clean up in every check.
Browser Checks: Testing What Users Actually See
API checks tell you your backend is working. Browser checks tell you your users can actually use your product. The difference matters more than most teams realize.
I once spent three hours debugging an API that was returning perfect responses while the frontend displayed a blank page. The issue was a JavaScript error in a third-party widget blocking the entire React render tree. API checks showed everything green. Real users were staring at white space. A browser check would have caught it in minutes.
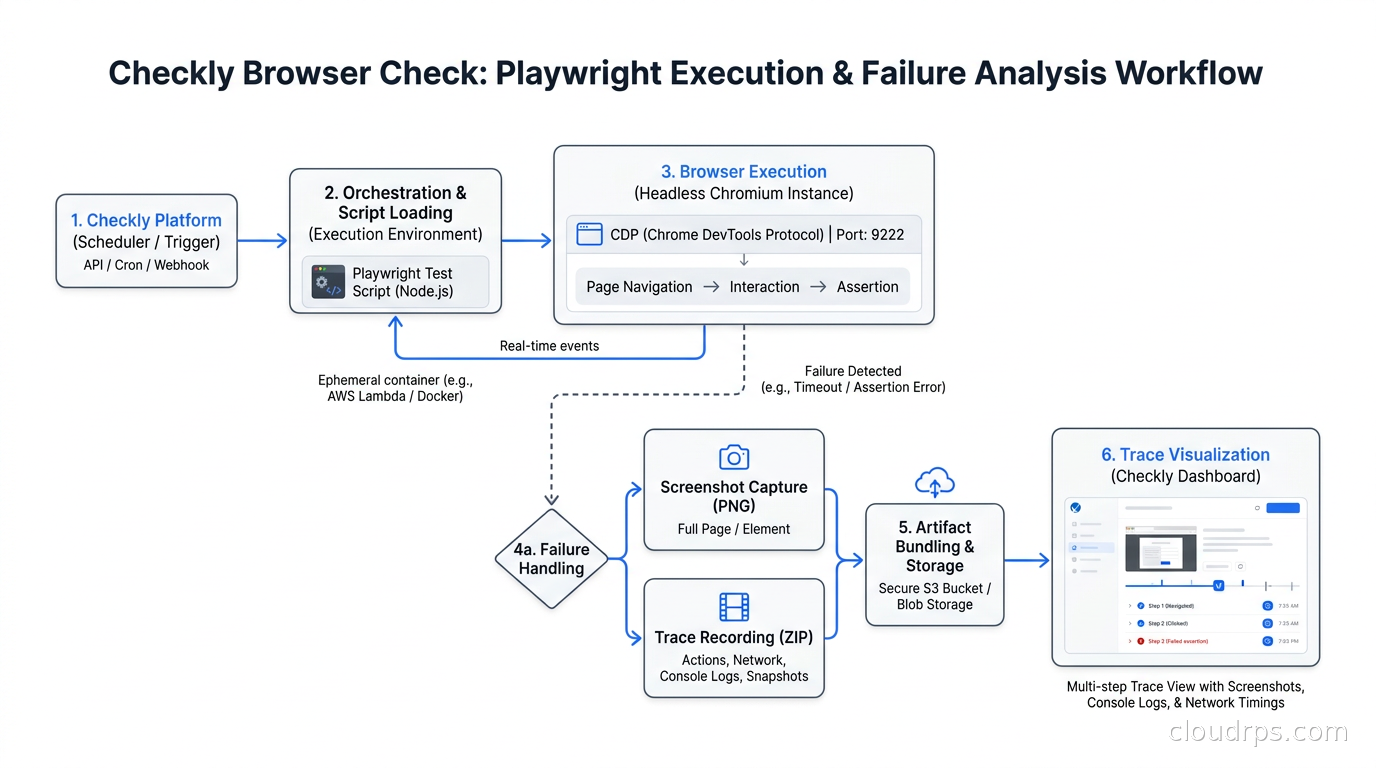
Checkly’s browser checks run Playwright under the hood, which means you get a real Chromium browser executing real JavaScript, loading real assets, and rendering real pages. Here is what a browser check for a login flow looks like:
const { chromium } = require('playwright');

const browser = await chromium.launch();
const page = await browser.newPage();

// Navigate to login
await page.goto('https://app.yourapp.com/login');

// Fill credentials
await page.fill('#email', process.env.SYNTHETIC_USER_EMAIL);
await page.fill('#password', process.env.SYNTHETIC_USER_PASSWORD);
await page.click('#login-button');

// Wait for dashboard and assert content
await page.waitForSelector('.dashboard-header');
const headerText = await page.textContent('.dashboard-header');
expect(headerText).toContain('Welcome');

// Check that key UI elements are present
await expect(page.locator('.nav-menu')).toBeVisible();
await expect(page.locator('[data-testid="user-avatar"]')).toBeVisible();

await browser.close();
This check validates that authentication works end-to-end, including the session cookie flow, that the frontend renders successfully after login, and that key UI elements are present. A failed check attaches a screenshot and a trace file, which makes debugging significantly faster. When I get paged at 2 AM, a screenshot of what the browser actually saw saves ten minutes of reproduction effort.
The cost of browser checks is higher than API checks. They are slower (10-30 seconds vs. 1-3 seconds) and more resource-intensive. Use them for critical user journeys only. I typically run browser checks every 5-10 minutes rather than every minute.
Multi-Location Monitoring and Global Coverage
A check that only runs from us-east-1 tells you your app works for engineers in Virginia. Your users in Singapore, São Paulo, and Frankfurt have a different experience, and you will not know about their outages unless you monitor from their locations.
Most synthetic monitoring platforms support running checks from 10-30 global locations simultaneously. This serves two purposes: geographic failure detection (a CDN misconfiguration that only affects European traffic, for example) and latency monitoring from user-representative locations.
The configuration is straightforward in most tools. In Checkly, you select from a list of AWS regions and they handle the distribution. In k6 Cloud, you define load zones. In Datadog Synthetics, you pick from private and managed locations.
The alert strategy matters here. For critical checks, I alert if the check fails from more than one location simultaneously. This filters out ephemeral single-region hiccups. For latency-based alerts, I use percentile thresholds from specific regions rather than averages across all locations, which can mask regional degradation. An average that looks fine globally can hide a 3-second P95 for your European users.
One underused feature is private locations. Both Checkly and k6 support running synthetic checks from infrastructure you control. This is essential for testing internal services, staging environments, and anything behind a VPN or private network boundary. We run a private Checkly agent inside our Kubernetes cluster to test internal APIs that are never exposed to the public internet.
Synthetic Monitoring in CI/CD Pipelines
The shift-left version of synthetic monitoring runs your checks against ephemeral environments in your CI/CD pipeline before promoting code to production. If the check passes against staging, you have higher confidence that the production deployment will not break user flows.
Checkly CLI makes this particularly clean. You check your Checkly configuration into source control alongside your application code and run checks as part of your deployment pipeline:
# Run checks against staging before deploying
npx checkly test --env-file .env.staging

# If checks pass, deploy to production and activate checks
npx checkly deploy
The mental model I use: synthetic checks are your production acceptance tests. They are the last gate before a deployment is considered successful. If you are using feature flags and progressive delivery, synthetic checks serve as your canary signal. Deploy to 5% of traffic, run checks against the canary, and roll back automatically if checks fail. This is one of the most reliable mechanisms for safe deployments that I have seen work consistently across teams.
This is different from chaos engineering, which deliberately injects failures to test resilience. Chaos engineering tests your system’s resilience. Synthetic CI checks test your system’s correctness. Both are necessary and they complement each other well. Run synthetic checks continuously to know when things are broken; run chaos experiments periodically to know how your system behaves when dependencies fail.
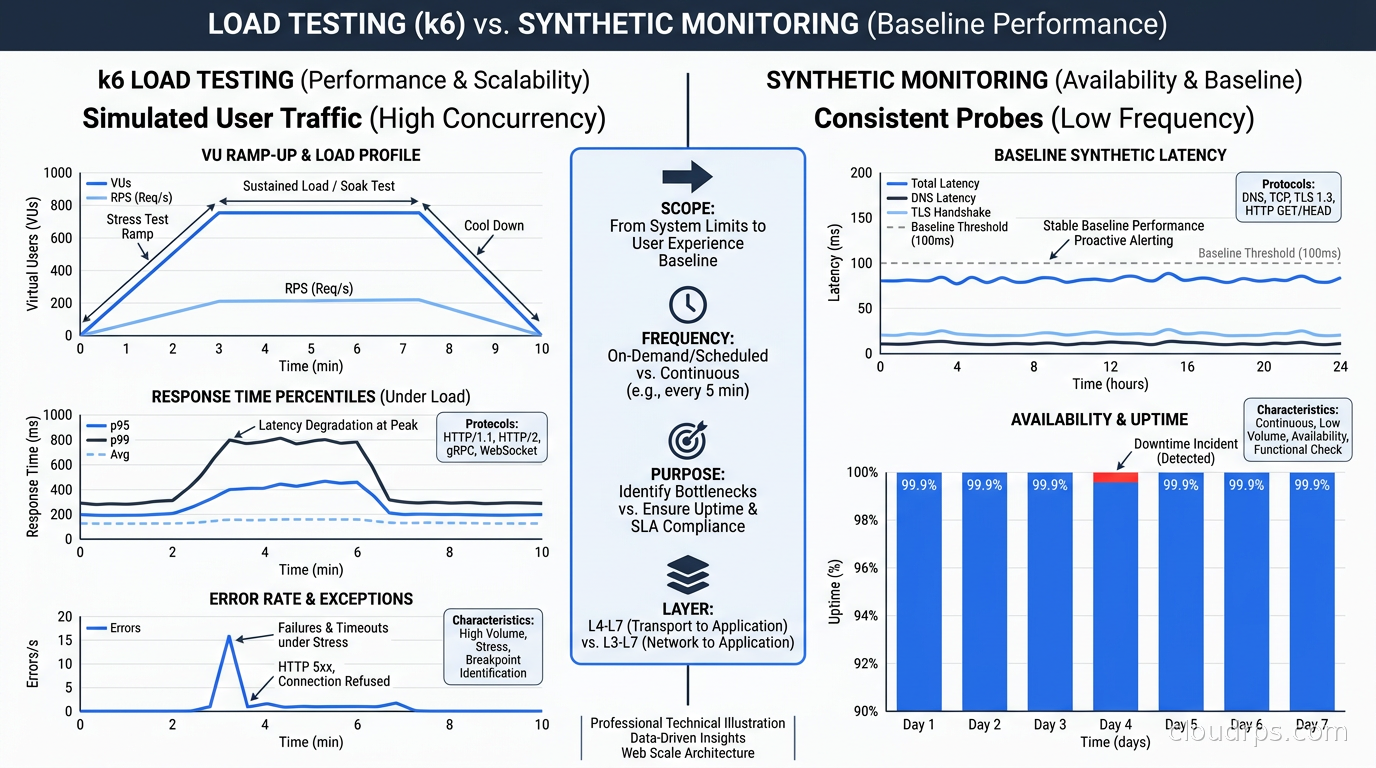
Load Testing vs. Synthetic Monitoring: Two Uses of the Same Framework
I want to address a common source of confusion because it trips up many teams. k6 is both a load testing tool and a synthetic monitoring tool, and these use cases are different enough that conflating them creates real problems.
Synthetic monitoring: low VUs (usually 1), high frequency (every 1-5 minutes), continuous, alert on failure, measure latency against SLO thresholds. The goal is constant validation that the system works.
Load testing: high VUs (hundreds to thousands), one-time runs, measure throughput and latency degradation under load, find breaking points. The goal is capacity planning and performance regression detection.
The underlying framework handles both, but you configure them very differently. A synthetic check that inadvertently runs with high concurrency generates artificial load on your production system. A load test accidentally configured to run continuously will burn your infrastructure and your budget.
In practice, I use Checkly for synthetic monitoring because the monitoring-as-code workflow is cleaner and the check scheduling is purpose-built. I use k6 for load testing because the scenario configuration and result analysis fit that use case better. Using both gives you the full picture: k6 tells you what your system does under stress, Checkly tells you what your system does right now.
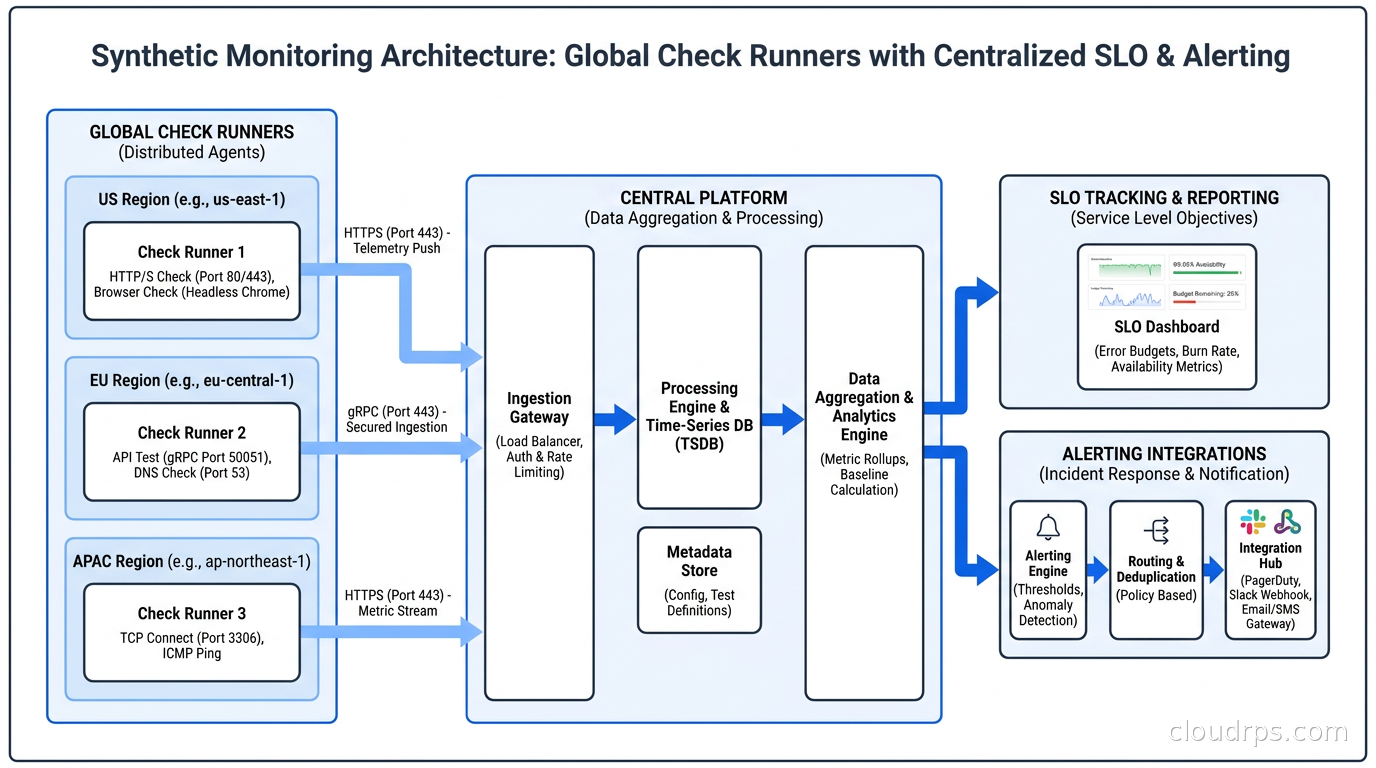
Connecting Synthetic Monitoring to SLOs
Synthetic monitoring data is one of the most reliable inputs for SLI calculation. If you are using error rate as an SLI, synthetic check failure rate is a clean, consistent signal. No sampling bias, no traffic variance, no dependency on real users hitting particular endpoints.
The integration looks like this:
- Define your SLI as “percentage of synthetic checks that succeed” for availability, or “percentage of synthetic checks completing within 500ms” for latency.
- Burn down your error budget based on synthetic check failures, not just real-user errors.
- Alert on error budget burn rate rather than individual check failures.
This matters because individual check failures are noisy. A single failed check from one location might be a network blip. But if your error budget is burning faster than expected, something systematic is wrong and you need to investigate regardless of whether any single alert threshold was crossed.
Both Checkly and Grafana Cloud have native integrations with SLO tracking. Checkly exports metrics via Prometheus format or direct integrations. Grafana Cloud’s k6 output connects directly to SLO tracking in Grafana SLO.
The other integration that matters is with your incident management toolchain. When a critical synthetic check fails for more than two consecutive runs from multiple locations, that should automatically create a PagerDuty or incident.io incident. I configure severity based on check tier: Tier 1 critical path failures page the on-call engineer immediately, Tier 2 failures create a low-priority ticket that gets picked up during business hours.
A War Story: The Silent Checkout Failure
A few years ago, I was running infrastructure for a mid-sized e-commerce platform heading into a high-traffic period. We had Prometheus, Grafana, distributed tracing, and solid log aggregation. We thought we were well-instrumented.
Late at night, our payment provider rotated a TLS certificate on their webhook endpoint. Our callback handler stopped receiving payment confirmations. Orders were placed, money was charged, but our system never received the confirmation event and kept orders in “pending” status. Users were getting charged without receiving order confirmations.
Our metrics looked fine. API response times were normal. Error rates were flat. Real-user monitoring showed users completing the checkout form successfully. But they were not actually completing the purchase flow from the business perspective – they were submitting orders that disappeared into limbo.
A synthetic check that simulated an end-to-end checkout, including verifying that an order reached “confirmed” status within 60 seconds of placement, would have caught this within two minutes of the certificate rotation. Instead, we found out from a flood of support contacts. The incident took four hours to diagnose because the failure was in a webhook path that our observability covered poorly.
After that incident, we built a comprehensive synthetic monitoring suite. The checkout confirmation check alone has fired four times in the years since, each time before a single user noticed anything wrong. The ROI of synthetic monitoring is not theoretical.
What Not to Monitor Synthetically
This is a section most articles skip, but it matters. Synthetic monitoring has real costs: infrastructure costs for check runners, engineering time to maintain checks, and alert fatigue if you monitor too aggressively.
Do not monitor:
Things already tested exhaustively in CI. Unit tests and integration tests in your pipeline are faster feedback loops than synthetic checks for application logic. Synthetic checks are for production validation, not functional testing.
Highly variable, non-deterministic features. AI-generated content, recommendation engines, and anything that legitimately returns different results on every call are difficult to assert against meaningfully. You can check that the endpoint responds, but asserting on content creates constant false positives.
Third-party services you do not control. Monitoring api.stripe.com directly is not useful. You cannot fix their outages. Monitor your own integration with Stripe instead: did the API call succeed, did the webhook arrive?
Static assets and CDN content. Your CDN provider already monitors availability better than you can from outside. CDN performance is better covered by your observability pipeline and real-user monitoring.
Synthetic Monitoring as Code
The most important operational choice you will make is whether to manage your checks through a UI or through code. My strong recommendation is always code.
Checkly CLI and their Terraform provider allow you to define checks as TypeScript or Terraform configuration, version-control them, code-review them, and deploy them in your CI pipeline. Your checks evolve with your application code, broken checks get fixed in the same PR that introduced the breakage, and you have a complete audit trail.
The alternative, clicking through a UI to create and maintain checks, leads to checks that are undocumented, un-reviewed, and often abandoned when the engineer who created them moves to another team. I have inherited monitoring systems where nearly half the checks were testing endpoints that no longer existed, running every minute, generating noise that nobody paid attention to.
Define your checks in code. Treat them like infrastructure as code. Review them in pull requests. This discipline pays dividends. A Checkly configuration repository that lives alongside your application code and gets reviewed in PRs is a monitoring system that stays accurate and useful.
Getting Started: A Practical Sequence
If you are starting from scratch, here is the sequence I recommend:
Week 1: Pick your three most critical user journeys. Write API checks that test the full read/write cycle for each. Deploy them with a 1-minute interval from three geographic locations. Wire alerts to your existing notification channel.
Week 2: Add browser checks for the same three journeys. Run them every 5 minutes. Set up screenshot capture on failure.
Week 3: Add your Tier 2 checks for important features. Establish a monitoring-as-code workflow using Checkly CLI or k6 plus Terraform.
Month 2: Integrate check results into SLO tracking. Add checks to your CI/CD pipeline for staging validation. Start tracking error budget burn rate from synthetic data.
This sequence gets you from zero to a production-grade synthetic monitoring practice in about six weeks without overwhelming your team or creating a maintenance burden before you understand what you actually need to monitor.
Closing Thoughts
The teams that find out about outages from users are the teams that rely entirely on passive observability. Metrics and traces are essential for understanding what happened after the fact. They are poor substitutes for knowing what is happening right now to a user trying to complete a purchase, reset a password, or view their account data.
Twenty years of running production systems has taught me that the best incident response is avoiding incidents. Synthetic monitoring is the most reliable mechanism I have found for doing that. It is not complicated, it is not expensive, and the value compounds over time as you add more checks and integrate them more deeply into your deployment workflow.
Start with three critical user journeys, write checks that test behavior rather than status codes, and page someone when they fail. The first time a check fires at 2 AM and you fix a problem before a single user notices, you will understand why this practice is non-negotiable for serious production systems.
For the full observability picture alongside synthetic monitoring, see our guide to distributed tracing with OpenTelemetry and how to track engineering outcomes through DORA metrics.
Get Cloud Architecture Insights
Practical deep dives on infrastructure, security, and scaling. No spam, no fluff.
By subscribing, you agree to receive emails. Unsubscribe anytime.