
In 2016, I helped a mid-size company migrate to the cloud. The CFO had done back-of-napkin math: their data center costs $1.2 million per year, and the cloud provider’s pricing calculator said the equivalent workload would cost $600,000. Easy decision, right? Slash the infrastructure bill in half.
Eighteen months after the migration, their annual cloud spend was $2.1 million. The CFO was furious. The CTO was embarrassed. And I got brought back in to figure out what went wrong.
What went wrong was that nobody had calculated the actual total cost of ownership. They compared the sticker price of cloud instances to the lease cost of their data center and called it analysis. They forgot about data transfer costs, premium support tiers, the extra engineering time to architect for the cloud, the monitoring tools, the security tools, and the fact that nobody was turning off dev/test instances at night.
TCO analysis is not glamorous work. But getting it wrong costs real money, sometimes millions of dollars. Let me show you how to do it right.
What TCO Actually Includes
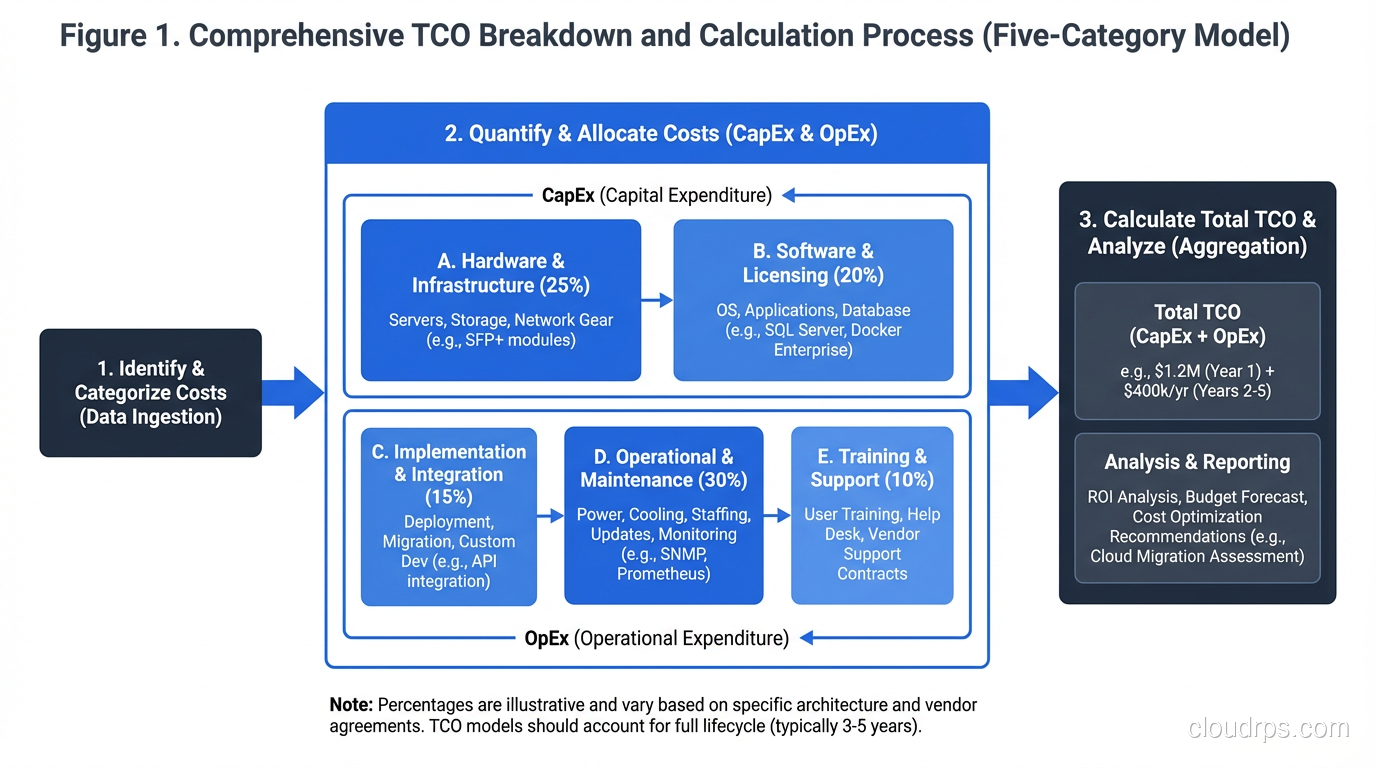
Total Cost of Ownership is every cost associated with running a system over its lifetime. Not just the obvious costs. All the costs. When I do a TCO analysis, I break it into five categories.
1. Infrastructure Costs (The Obvious Ones)
These are the costs everyone remembers to include:
On-Premises:
- Server hardware (amortized over 3-5 years)
- Storage systems (SAN, NAS, disk arrays)
- Network equipment (switches, routers, firewalls, load balancers)
- Data center space (lease, power, cooling, physical security)
- Hardware maintenance contracts
- Spare parts inventory
Cloud:
- Compute instances (on-demand, reserved, spot)
- Storage (block, object, file, archive)
- Database services (managed vs. self-managed)
- Networking (load balancers, NAT gateways, VPN)
- Container/serverless services
These are straightforward to calculate, which is why they’re the only costs most people include. But they’re typically only 40-60% of the true total.
2. Data Transfer Costs (The Cloud Tax)
This is the cost category that blindsides cloud migrants more than any other. Cloud providers charge for data leaving their network (egress), and the numbers add up fast.
AWS charges $0.09 per GB for data transfer out to the internet (as of this writing, though they’ve been adjusting this). That sounds trivial until your application serves 50TB per month of API responses, images, and downloads. That’s $4,500 per month ($54,000 per year) just for data leaving your cloud.
Cross-region data transfer adds up too. If your primary is in us-east-1 and your DR site is in us-west-2, every byte of replication data costs money. Cross-AZ traffic within a region isn’t free either; it’s typically $0.01/GB in each direction.
I’ve seen organizations where data transfer is 20-30% of their total cloud bill. Always model this explicitly.
3. Software and Licensing Costs
On-Premises:
- Operating system licenses (Windows Server, RHEL)
- Database licenses (Oracle, SQL Server, which can be staggering)
- Virtualization platform licenses (VMware vSphere)
- Backup software
- Monitoring tools
- Security software (antivirus, IDS/IPS, WAF)
Cloud:
- Managed service premiums (RDS costs more than running your own database on EC2, but you’re paying for management)
- Third-party SaaS tools (monitoring, security, CI/CD)
- Marketplace software licenses
- Premium support tiers
One of the biggest cost savings in cloud migration comes from dropping expensive software licenses, particularly Oracle and VMware. But this only works if you actually migrate off those platforms. I’ve seen “cloud migrations” that were just running Oracle on EC2 instances, which combines the worst of both worlds: cloud markup AND Oracle licensing.
4. People Costs (The Biggest Line Item Nobody Tracks)
This is almost always the largest category, and it’s almost always underestimated.
On-Premises:
- System administrators
- Network engineers
- Storage administrators
- Data center facilities staff
- Hardware procurement and lifecycle management
- Vendor management
Cloud:
- Cloud architects
- DevOps/SRE engineers
- Cloud security specialists
- FinOps analysts
- Training and certification
Here’s the uncomfortable truth: cloud doesn’t eliminate people costs. It shifts them. You need fewer hardware-focused roles but more software-focused roles. And cloud-skilled engineers command premium salaries.
The calculus gets more nuanced when you factor in what those people could be doing instead. If your sysadmins spend 40% of their time on hardware maintenance, migrating to the cloud frees that 40% for more valuable work. But only if you actually redirect that capacity. If they just find other low-value work to fill the time, you haven’t gained anything.
5. Opportunity Costs and Indirect Costs
These are the hardest to quantify but often the most significant:
- Time to market: How much faster can you launch new features in the cloud? What’s that speed worth in competitive advantage?
- Elasticity value: Can you handle traffic spikes without over-provisioning? What revenue would you lose during peak events if you couldn’t scale?
- Innovation access: Managed ML services, serverless, global CDN: capabilities that would take months to build on-premises are available immediately in the cloud.
- Risk reduction: What’s the value of the cloud provider handling physical security, hardware failures, and facility management?
- Migration costs: The one-time cost of actually getting to the cloud. Re-architecting applications, training staff, running dual environments during transition.
For a broader understanding of what cloud computing offers, see my overview on what cloud computing is. And for understanding the different service models and their cost implications, check out my comparison of IaaS, PaaS, and SaaS.
How to Build a TCO Model
I’ve built TCO models for organizations ranging from 10-person startups to Fortune 500 companies. Here’s the process I follow.
Step 1: Define the Scope and Time Horizon
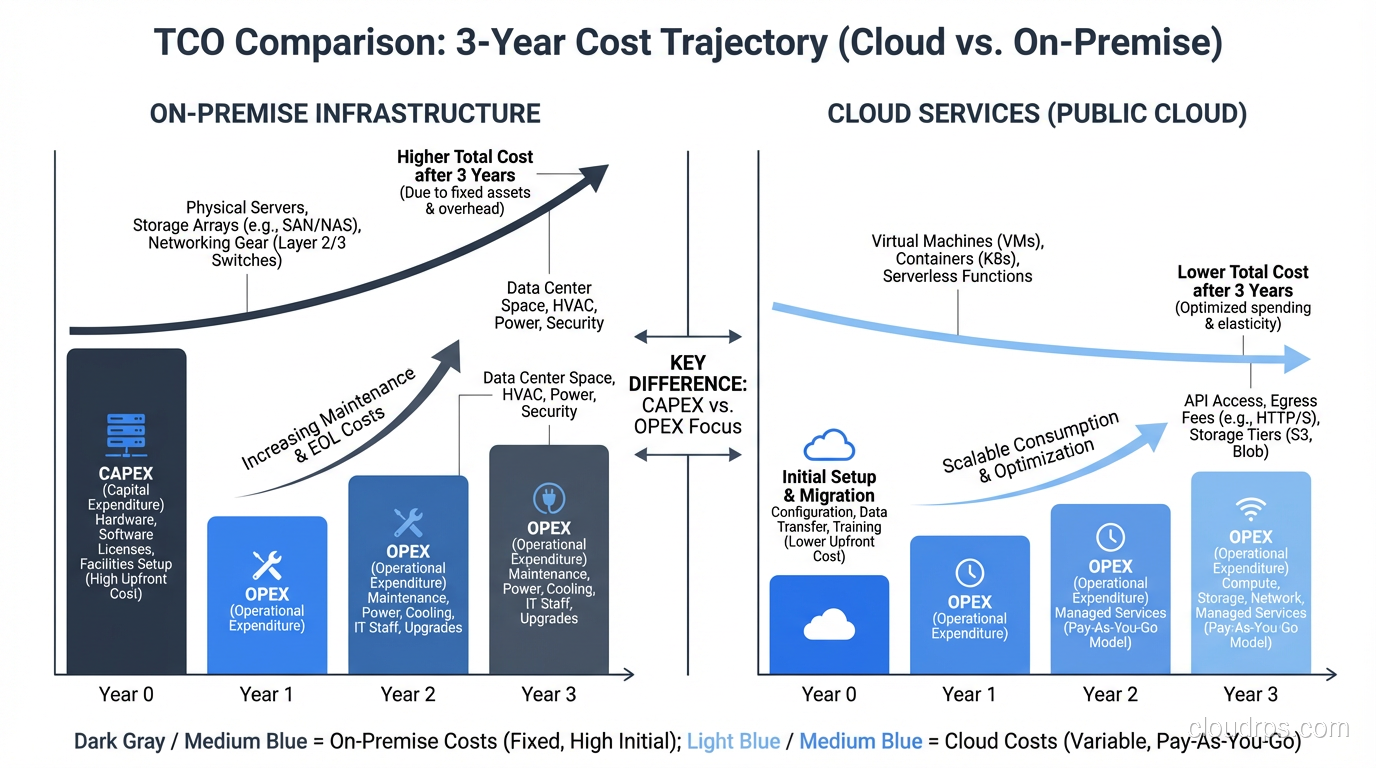
What systems are you analyzing? What’s your comparison period? I typically use a 3-year time horizon for cloud vs. on-premises comparisons because:
- Hardware depreciation cycles are 3-5 years
- Cloud reserved instance commitments are typically 1-3 years
- It’s long enough to amortize migration costs
- It’s short enough that the projections are still somewhat reliable
Step 2: Inventory Current State
Document everything you’re currently running and what it costs. For on-premises, this means pulling invoices for hardware, maintenance contracts, data center leases, power bills, and software licenses. For existing cloud spend, pull your billing reports and break them down by service.
Don’t forget to include the personnel time. Interview your operations team: how many hours per week do they spend on hardware management, patching, backup management, and other operational overhead? Assign an hourly cost based on their loaded salary (salary + benefits + overhead, typically 1.3-1.5x the base salary).
Step 3: Model the Target State
Design your target architecture and price it out. Use the cloud provider’s pricing calculator as a starting point, but adjust for reality:
- Add 20-30% to the calculator estimate. Every TCO analysis I’ve reviewed that used raw calculator numbers underestimated the final cost. Data transfer, monitoring, logging, security tools, and the inevitable “we didn’t think of that” services always push the number up.
- Model reserved instances realistically. Yes, reserved instances save 30-60% over on-demand. But you need to commit upfront, and you need to get the sizing right. Over-provisioned reservations waste money; under-provisioned ones force you to use on-demand at full price.
- Account for growth. If your data volume is growing 50% per year, your cloud storage costs are growing 50% per year too. Model this.
Step 4: Compare Scenarios
Put both models side by side, broken down by the five cost categories. Calculate the total for each year over your time horizon. Look at the cash flow. Even if cloud is cheaper over three years, it might have higher costs in year one due to migration expenses and running dual environments.
I present TCO comparisons as a table with annual breakdowns and a summary:
| Category | On-Prem Year 1 | On-Prem Year 2 | On-Prem Year 3 | Cloud Year 1 | Cloud Year 2 | Cloud Year 3 |
|---|---|---|---|---|---|---|
| Infrastructure | $X | $X | $X | $Y | $Y | $Y |
| Data Transfer | $0 | $0 | $0 | $Y | $Y | $Y |
| Software | $X | $X | $X | $Y | $Y | $Y |
| People | $X | $X | $X | $Y | $Y | $Y |
| Other | $X | $X | $X | $Y | $Y | $Y |
| Total | $X | $X | $X | $Y | $Y | $Y |
Step 5: Sensitivity Analysis
Your estimates are wrong. Every single one of them. The question is how wrong, and whether the conclusion changes if your estimates are off.
Vary your key assumptions by +/- 20% and see if the recommendation changes. What if cloud instances cost 20% more than estimated? What if data transfer is 50% higher? What if your team needs two more cloud engineers than planned? If the recommendation is the same across reasonable variations, you can be confident. If it flips, you need better data.
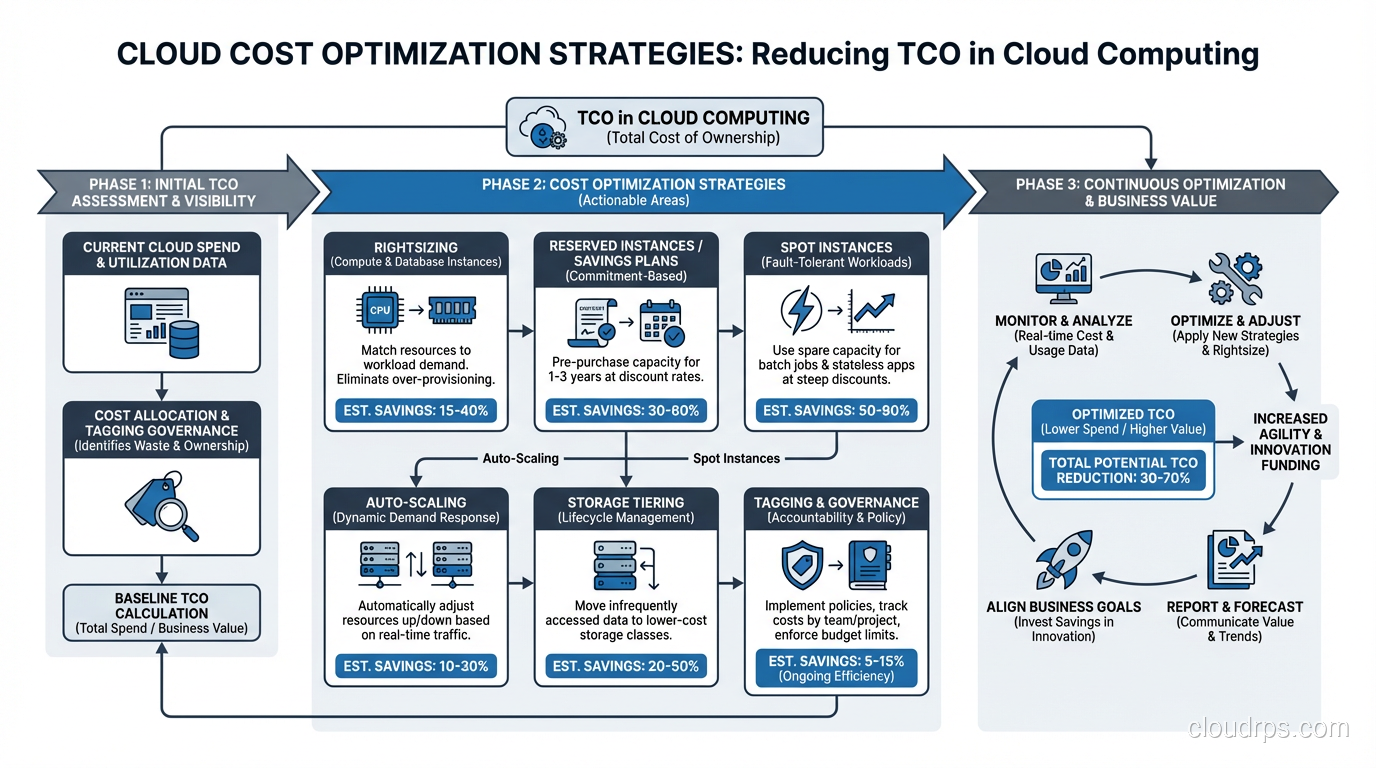
Cloud Cost Optimization: Practical Strategies
Whether you’re already in the cloud or planning a migration, these are the cost optimization strategies I apply consistently:
Right-Sizing
This is the single highest-impact optimization. Most organizations over-provision by 30-50%. That m5.2xlarge running at 15% average CPU utilization? It should be an m5.large. That RDS instance with 64GB of RAM using 12GB? Downsize it.
Use the cloud provider’s right-sizing recommendations (AWS Compute Optimizer, Azure Advisor, GCP Recommender) as a starting point, then validate with your actual performance data.
Reserved Instances and Savings Plans
For stable, predictable workloads, reserved instances save 30-60% compared to on-demand pricing. AWS Savings Plans offer similar savings with more flexibility. The key is committing only for workloads you’re confident will persist for the commitment period.
I recommend a layered approach: cover your baseline with reservations, handle predictable spikes with scheduled scaling, and use on-demand or spot for unexpected peaks.
Spot/Preemptible Instances
For fault-tolerant workloads (batch processing, CI/CD runners, stateless web servers behind load balancers), spot instances save 60-90% compared to on-demand. The trade-off is that they can be interrupted with two minutes’ notice. Design your workloads to handle this, and the savings are enormous.
Storage Lifecycle Policies
Data grows forever. Your storage bill doesn’t have to. Implement lifecycle policies that move data to cheaper storage tiers as it ages:
- Hot data on SSD-backed storage
- Warm data on standard storage (30+ days old)
- Cold data on infrequent access storage (90+ days old)
- Archive data on glacier/archive storage (365+ days old)
I’ve seen this single optimization save 40-60% on storage costs.
Turn Things Off
This sounds obvious, but I’ve audited cloud accounts and found dev/test environments running 24/7 that are only used during business hours. That’s 128 hours of waste per week. Implement automated schedules that shut down non-production environments at night and on weekends. Savings: roughly 65% on those resources.
For guidance on planning your cloud migration to minimize costs, see my piece on the cloud migration process.
When On-Premises Actually Wins
I’m a cloud proponent, but I’m not a zealot. There are scenarios where on-premises is genuinely cheaper:
Stable, predictable workloads at scale. If you’re running 500 servers at consistent utilization 24/7, the amortized cost of owned hardware is hard to beat. Dropbox famously saved millions by moving off AWS and onto their own infrastructure for their core storage workload.
Heavy data egress. If your business model involves serving massive amounts of data (CDN, media streaming, large file distribution), egress costs can make cloud prohibitively expensive.
Regulatory requirements. Some industries require data to remain on-premises or in specific jurisdictions. While most cloud providers now offer local regions, the compliance overhead can negate cost advantages.
Already-depreciated infrastructure. If you’ve already paid off your hardware and it’s running fine, migrating to the cloud for cost savings alone doesn’t make sense until you need to refresh that hardware.
The honest answer is usually hybrid: some workloads belong in the cloud, some belong on-premises, and the right mix depends on your specific circumstances. Don’t let a vendor (or a consultant, or a blog post) tell you otherwise without seeing your numbers.
The Bottom Line
TCO analysis is about making informed decisions with real numbers, not about proving a predetermined conclusion. I’ve done analyses that recommended moving to the cloud, analyses that recommended staying on-premises, and analyses that recommended a hybrid approach. The right answer depends on the specific situation.
What’s never the right answer is guessing. The difference between a $600,000 estimate and a $2.1 million reality is the difference between a successful project and a career-limiting one. Do the math. Include all the costs. Test your assumptions. And update the analysis annually, because both your workloads and the pricing landscape change constantly.
Your CFO will thank you.
Get Cloud Architecture Insights
Practical deep dives on infrastructure, security, and scaling. No spam, no fluff.
By subscribing, you agree to receive emails. Unsubscribe anytime.