
It’s 9:47 AM on a Monday and your phone is buzzing. Customer support says the app is “slow.” Your product manager pings you on Slack with “users are complaining about load times.” The CEO forwards an angry email from a key account. Everyone agrees on one thing: it’s slow. Nobody can tell you what “it” is or what “slow” means in concrete terms.
This is the scenario I’ve walked into more times than I can count over my career. And the teams that flail, the ones who spend hours randomly restarting services and cranking up instance sizes, are the teams without a systematic approach to latency troubleshooting.
I’m going to share the exact methodology I use. It works for monoliths and microservices. It works for APIs and web applications. It works whether your system runs on bare metal or Kubernetes. The principles are the same because the physics are the same: a request goes in, work happens across multiple layers, and a response comes out. Your job is to figure out which layer is adding the time.
Step 0: Define the Problem Precisely
“The app is slow” is not a problem statement. Before you touch a single dashboard, get specific:
- What specific operation is slow? Loading the homepage? Submitting a form? Running a report? All of the above?
- How slow is it? 2 seconds? 20 seconds? Timing out entirely?
- When did it start? Has it always been slow, or did it get slow recently? Did anything change around that time?
- Who is affected? All users? Users in a specific region? Users with a specific account type?
- Is it consistently slow or intermittently slow? Consistent slowness and intermittent slowness have very different root causes.
I’ve resolved incidents in minutes just by asking these questions. “It started yesterday at 3 PM” followed by “what deployed at 3 PM?” has closed more cases than any diagnostic tool.
Step 1: Confirm and Quantify with Data
Don’t trust anecdotal reports. Look at your metrics. If you have proper monitoring in place, this is straightforward:
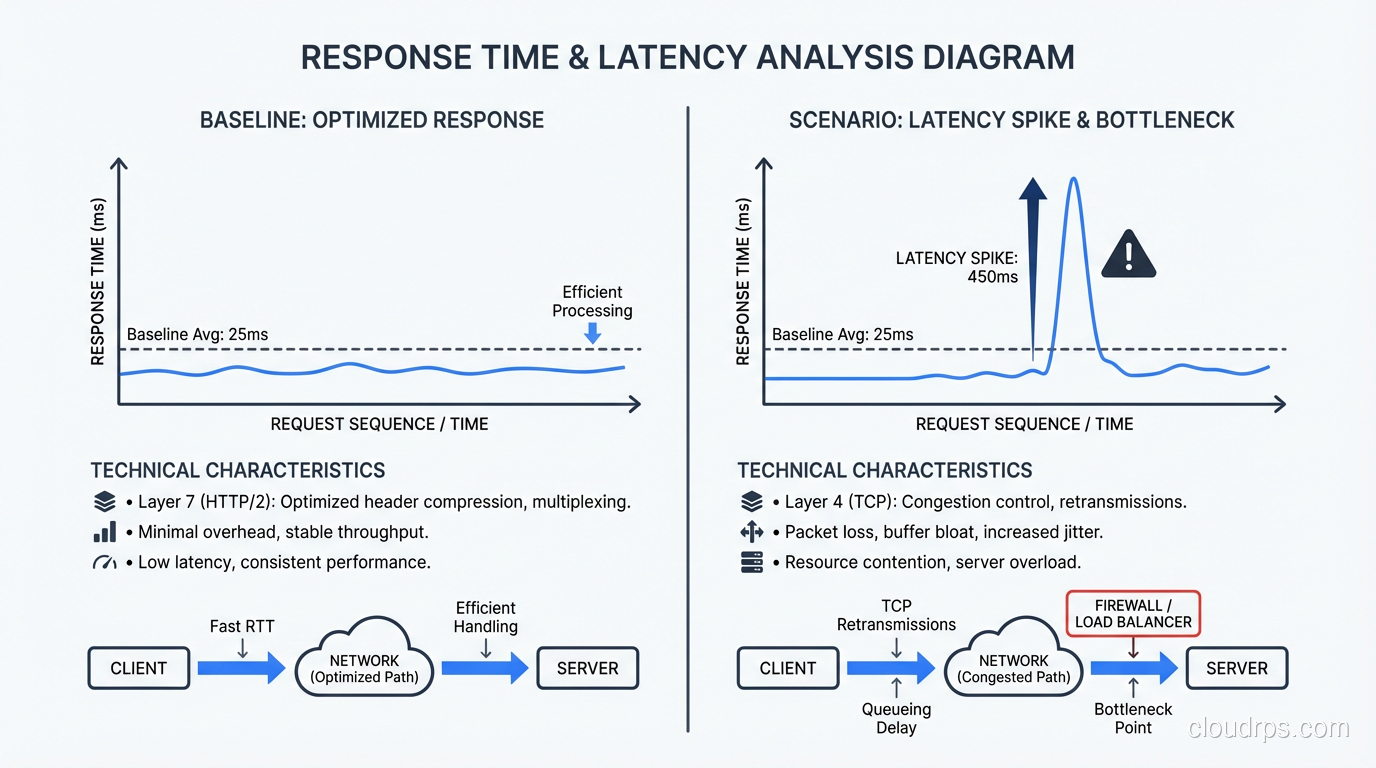
- Pull up your response time percentiles. Is P50 elevated or just P99? If P50 is elevated, the problem is widespread. If only P99 is elevated, a subset of requests is affected.
- Check the time series. When did the degradation start? Is it constant or periodic?
- Compare to your baseline. What’s normal for this endpoint at this time of day?
If you don’t have response time metrics, your first priority after resolving this incident is to add them. I’m not being preachy. I’m being practical. You cannot troubleshoot what you cannot measure.
For the remainder of this guide, I’ll assume you know that endpoint X went from a P95 of 200ms to 2,000ms starting at a specific time. That’s a concrete problem we can work with.
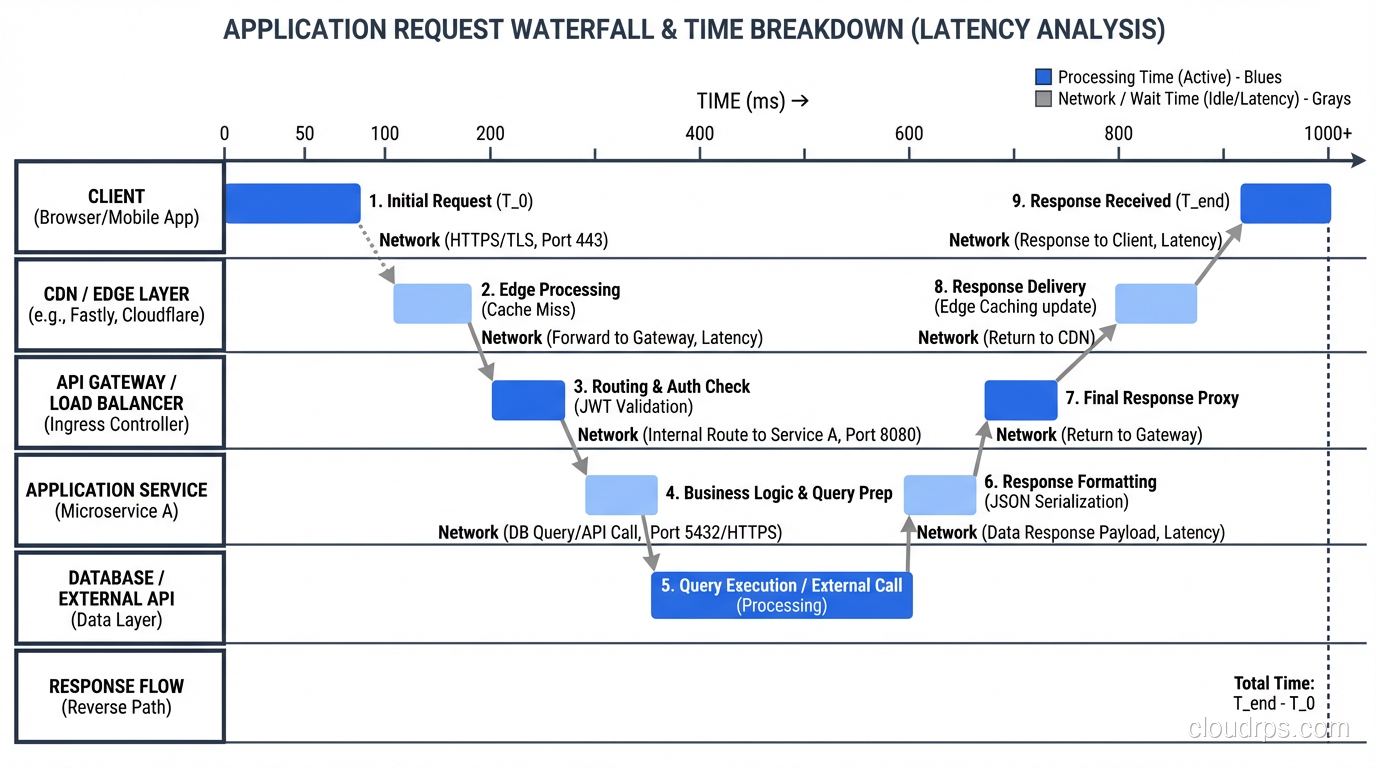
Step 2: The Layer Cake, Where Is the Time Going?
A typical web request passes through several layers, and each layer can introduce latency:
- Client/Browser: DNS resolution, TLS handshake, rendering
- Network: Transit between client and server, possibly through CDN or load balancer
- Load Balancer: Connection queuing, TLS termination, routing
- Application Server: Request processing, business logic, serialization
- Database: Query execution, lock waits, connection acquisition
- External Services: Third-party APIs, microservice calls, cache lookups
- Network (return): Response transit back to the client
Your goal is to identify which layer (or layers) account for the additional latency. This is where distributed tracing is invaluable. If you have tracing instrumented (Jaeger, Zipkin, Datadog APM, or anything OpenTelemetry-based), pull up a trace for a slow request and read the waterfall. The answer is usually obvious.
If you don’t have tracing, you can still isolate the layer manually:
Measure at the load balancer. What’s the total request time as measured by the load balancer? This eliminates client-side and network issues.
Measure at the application. What’s the processing time as measured by your application’s request logging? The difference between load balancer time and application time is network/queuing overhead.
Measure at the database. What’s the query execution time from your database’s slow query log? The difference between application time and database time is application processing overhead.
This narrowing-down process usually identifies the guilty layer within fifteen minutes.
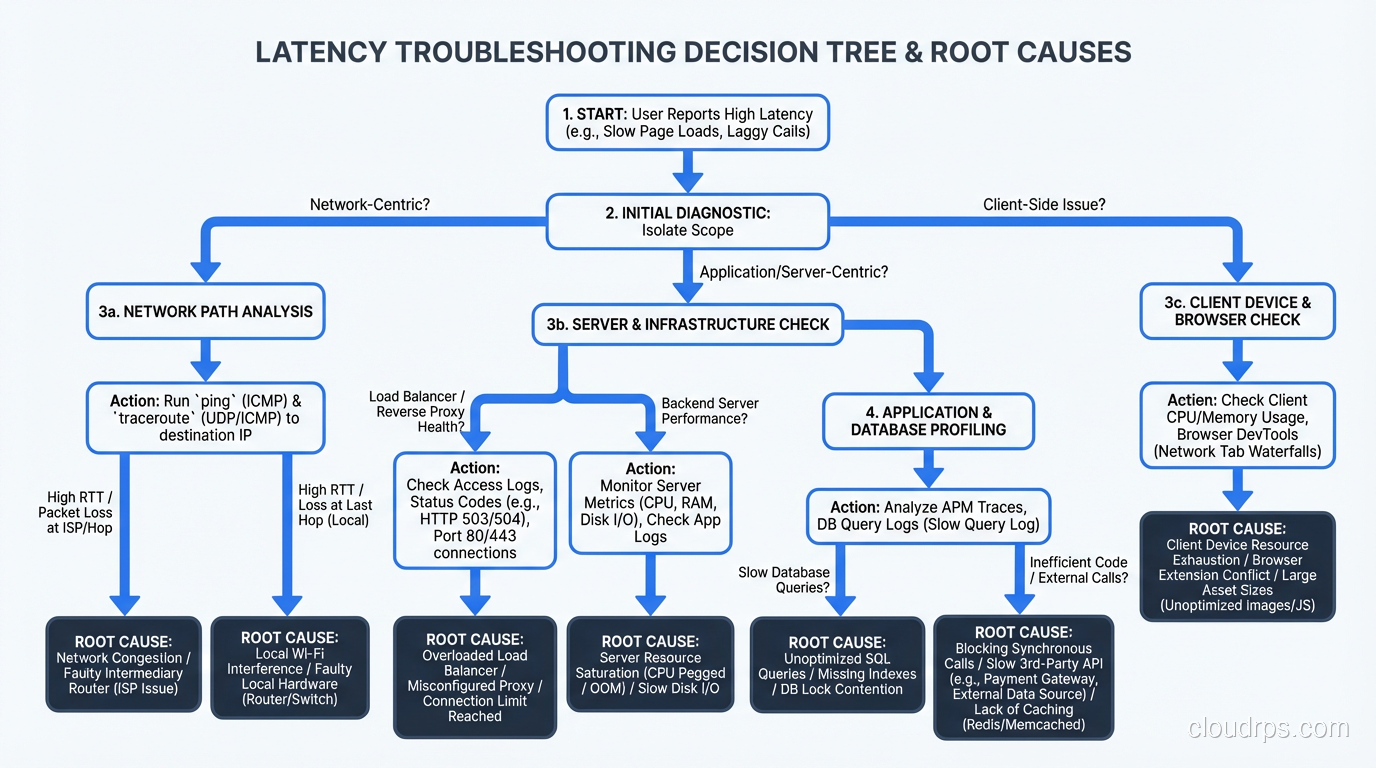
Step 3: Network Latency
If the time is being spent in the network layer, here’s what to check:
DNS resolution. Misconfigured DNS, expired TTLs forcing resolution on every request, or a slow DNS provider can add 50-200ms per request. Check with dig and look at resolution times.
TLS handshake. A full TLS handshake adds one to two round trips. If session resumption isn’t working (expired tickets, misconfigured session caches), every connection pays the full handshake cost. Check your TLS configuration and session ticket rotation.
TCP congestion. Packet loss causes TCP retransmissions, which add latency in multiples of the round-trip time. Check for packet loss with ping and mtr. Even 1% packet loss can significantly degrade throughput and latency.
Bandwidth saturation. If your network links are at capacity, packets queue up. Check interface utilization on your load balancers and servers. This is the intersection of latency and bandwidth, two very different problems that people often confuse.
Geographic distance. Physics applies. A request from Tokyo to a server in Virginia adds about 150ms of round-trip time just for the speed of light through fiber. If your users are globally distributed, you need CDN edge nodes or regional deployments.
Step 4: Application Latency
If the network is fine and the time is being spent in your application, the investigation branches depending on whether the slowness is CPU-bound or I/O-bound.
CPU-Bound Slowness
The application is doing too much computation. Symptoms: high CPU utilization, no waiting on external resources.
Profile the application. Use language-specific profiling tools (I covered these in my performance tuning guide). Look at flame graphs. Find the hot methods.
Check for runaway processes. A background job consuming all available CPU will starve request processing. I’ve seen this happen with uncontrolled batch processing, log parsing, or serialization of huge objects.
Garbage collection pauses. In JVM and .NET applications, GC pauses can cause latency spikes. Check your GC logs. If you’re seeing frequent full GC events, you either need more heap space or you have a memory leak. Java’s G1GC or ZGC can help reduce pause times, but they’re not magic. Fix the allocation pattern if possible.
I/O-Bound Slowness
The application is waiting for something: database, external API, file system, cache. Symptoms: low CPU utilization, high wait times.
Check thread pool saturation. If all your threads are blocked waiting on I/O, new requests queue up. In Java, check your thread pool sizes. In Node.js, check the event loop lag. In Python with sync frameworks, check your worker count.
Check connection pool health. If your database connection pool is exhausted, requests wait for a connection to become available. This shows up as latency that’s exactly equal to your connection timeout, or as a spike in “connection wait time” metrics.
Check external service response times. If you call three microservices and one of them is slow, your endpoint inherits that slowness. Trace the dependency calls and identify which one is lagging.
Step 5: Database Latency
Database-related latency is the most common root cause I find. Here’s my investigation checklist:
Slow queries. Check the slow query log or performance schema. Are there queries that suddenly got slower? Did the query plan change? PostgreSQL’s query planner can change its mind about the optimal execution plan when table statistics change, and the new plan can be dramatically worse.
Lock contention. Check for waiting queries: pg_stat_activity in PostgreSQL, SHOW PROCESSLIST in MySQL, sys.dm_exec_requests in SQL Server. Long-running transactions holding locks can cause cascading delays as other queries queue up behind them.
Connection exhaustion. Check active connection counts against your maximum. If you’re at or near the limit, new connections fail or wait.
Replication lag. If you’re reading from replicas, check the replication lag. High replication lag can cause read queries to return stale data or, in some configurations, to wait until the replica catches up. Growing replication lag often indicates the replica is overwhelmed.
Disk I/O. Check your database server’s disk metrics. If your working set exceeds available memory, the database starts reading from disk, and performance falls off a cliff. This is especially common after data growth. The table that fit in memory six months ago doesn’t anymore.
Table/index bloat. In PostgreSQL, tables and indexes accumulate dead rows over time. Autovacuum keeps this in check, but if autovacuum is misconfigured or falling behind, table bloat causes index scans to be much slower than expected. Check pg_stat_user_tables for tables with high dead tuple counts.
Step 6: The Usual Suspects
After hundreds of latency investigations, I’ve developed a mental shortlist of the most common causes. When I’m under pressure and need to find the problem fast, I check these first:
A recent deployment. What changed in the last 24 hours? New code, configuration changes, infrastructure changes? This is the cause about 40% of the time.
An unindexed or poorly indexed query. Either a new query was added without proper indexes, or data growth made an existing query’s plan suboptimal. About 25% of cases.
An external dependency degradation. A third-party API, a shared microservice, or a database replica that’s struggling. About 15% of cases.
Resource exhaustion. CPU, memory, disk I/O, connection pools, thread pools hitting their limits. About 10% of cases.
Everything else. GC pauses, network issues, DNS problems, TLS configuration, clock skew, noisy neighbors in shared environments, and the occasional genuinely bizarre issue. About 10% of cases.
Intermittent Latency: The Hard Problem
Consistent latency is relatively easy to diagnose because the problem is always there, so you can always observe it. Intermittent latency is a different beast. The system is fast most of the time, but randomly spikes. By the time you look at the dashboard, the spike is over and everything looks normal.
For intermittent issues, I rely on:
High-resolution metrics. One-minute averages smooth over spikes. You need at least 10-second resolution, preferably 1-second for targeted investigation. Prometheus can do this, but make sure your scrape interval is short enough.
Trace sampling with tail-based sampling. Instead of sampling a fixed percentage of traces, use tail-based sampling that captures traces for requests exceeding a latency threshold. This ensures you have detailed traces for the slow requests, even if they’re rare.
Capturing outliers. Log requests that exceed your P95 threshold with additional context: which queries ran, which services were called, what the resource utilization was at the time. This gives you forensic data for after-the-fact analysis.
Correlating with events. Overlay your latency graph with deployment events, autoscaling events, GC events, cron jobs, and backup schedules. Intermittent latency often correlates with a periodic activity. I once found that a daily database backup was saturating disk I/O for 20 minutes every morning at 10 AM, which was exactly when the team reported “morning slowness.”
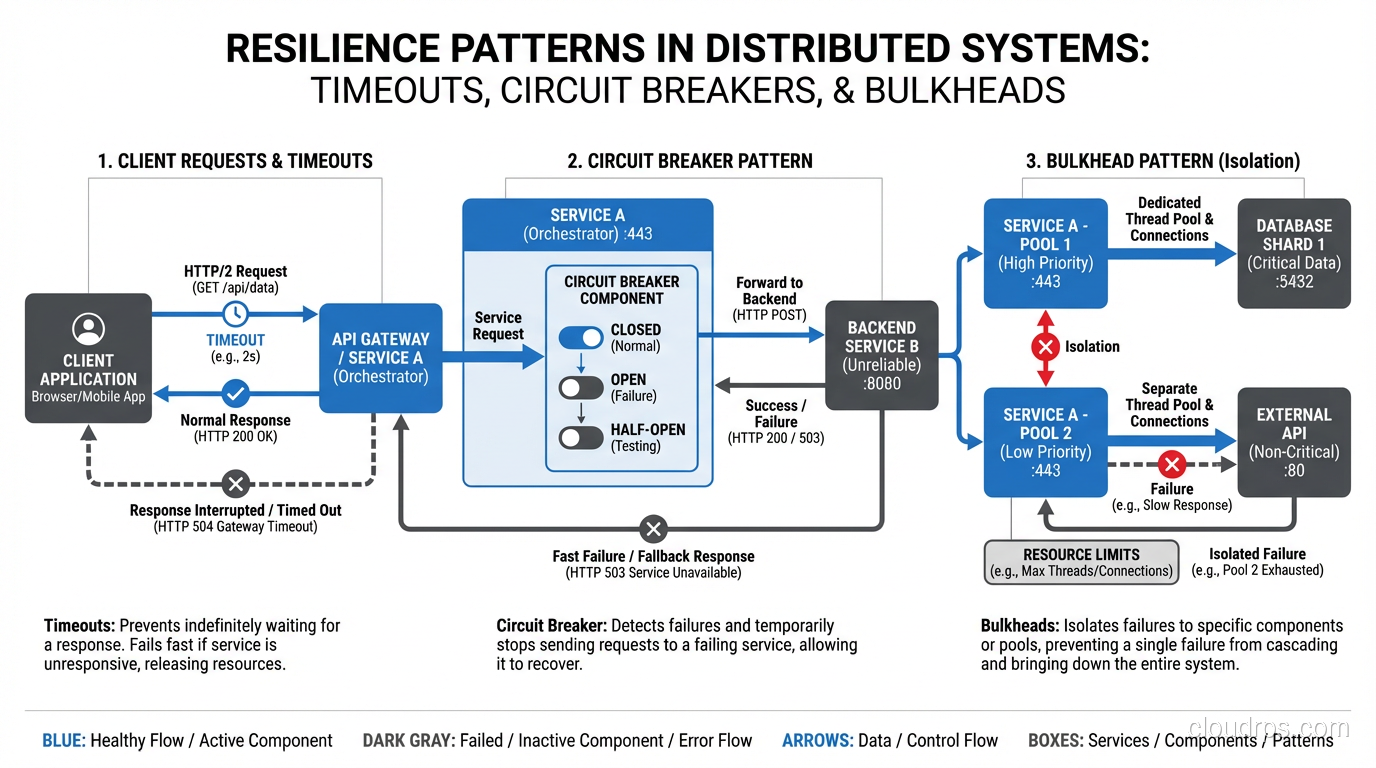
Building Resilience Against Latency
Once you’ve fixed the immediate problem, think about resilience:
Set timeouts on everything. Every HTTP call, every database query, every cache lookup should have a timeout. Without timeouts, a slow dependency can consume all your threads/connections and bring down your entire system. This is how a slow microservice cascades into a full outage.
Use circuit breakers. When a dependency is consistently slow or failing, stop calling it. Serve a degraded response instead. The circuit breaker pattern (Hystrix, resilience4j, Polly) prevents slow dependencies from dragging down your whole system.
Implement bulkheads. Separate your thread pools and connection pools by dependency. If your payment service is slow, it should only exhaust the thread pool allocated to payment calls, not the pool handling all requests.
Set and enforce SLOs. Define what acceptable latency means for each endpoint. Track it. Alert on it. Make latency a first-class engineering priority, not something you only think about when users complain.
For a broader perspective on how latency relates to overall system capacity, see my piece on database and application performance tuning.
The Methodology Matters More Than the Tools
I’ve diagnosed latency issues with sophisticated APM platforms that cost six figures per year, and I’ve diagnosed them with curl -w and tail -f. The tools are helpful, but the methodology is what matters. Observe, hypothesize, narrow down, verify. Work from the outside in, layer by layer. Don’t guess. Measure.
Every latency incident is an opportunity to improve your system. Add the monitoring you wish you’d had. Fix the root cause, not just the symptom. Document what you found so the next person (who might be future you at 3 AM) can find it faster.
The teams that get great at troubleshooting latency are the teams that build systems that stay fast. Not because they never have problems, but because they find and fix problems before they become crises. That’s the real payoff of investing in this discipline.
Get Cloud Architecture Insights
Practical deep dives on infrastructure, security, and scaling. No spam, no fluff.
By subscribing, you agree to receive emails. Unsubscribe anytime.