DevOps
Monitoring and Logging: What to Track, How to Alert, and Tools That Work
Practical monitoring and logging advice from three decades of production operations. What metrics matter, how to build alerts that work, and tools I trust.
Practical monitoring and logging advice from three decades of production operations. What metrics matter, how to build alerts that work, and tools I trust.
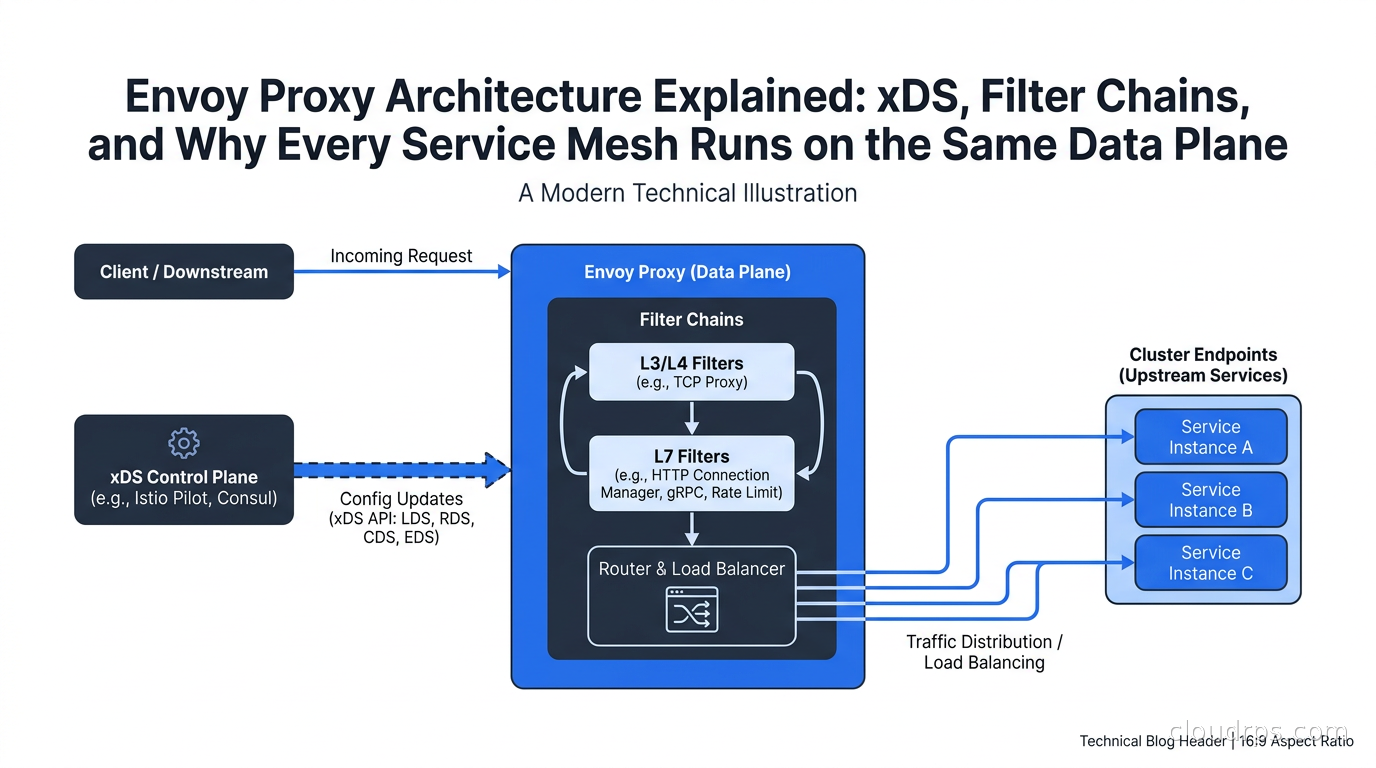
A deep dive into Envoy's xDS APIs, filter chain model, threading architecture, and why it became the universal data plane powering Istio, AWS App Mesh, and Kubernetes Gateway API.
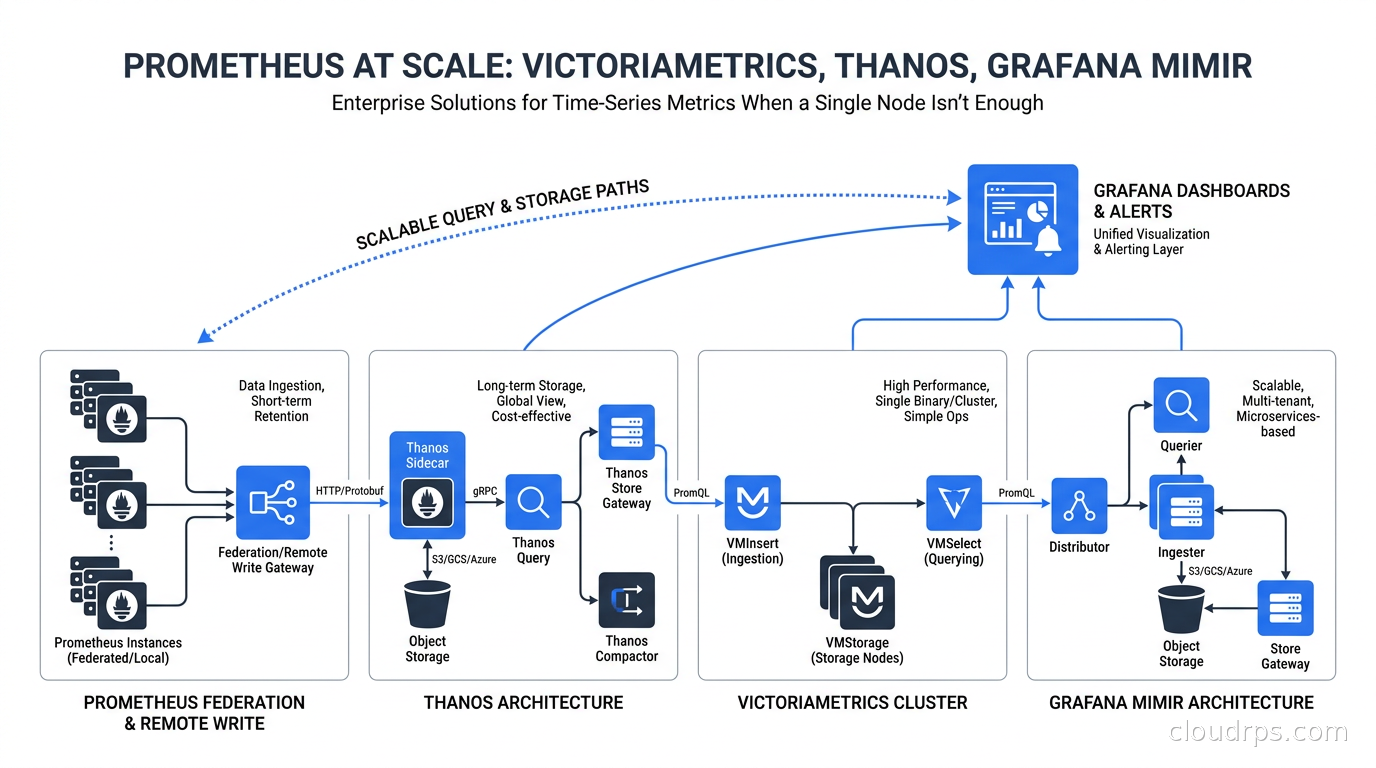
Single-node Prometheus breaks down at scale. Here's how VictoriaMetrics, Thanos, and Grafana Mimir solve long-term storage, high availability, and multi-cluster metrics at petabyte scale.
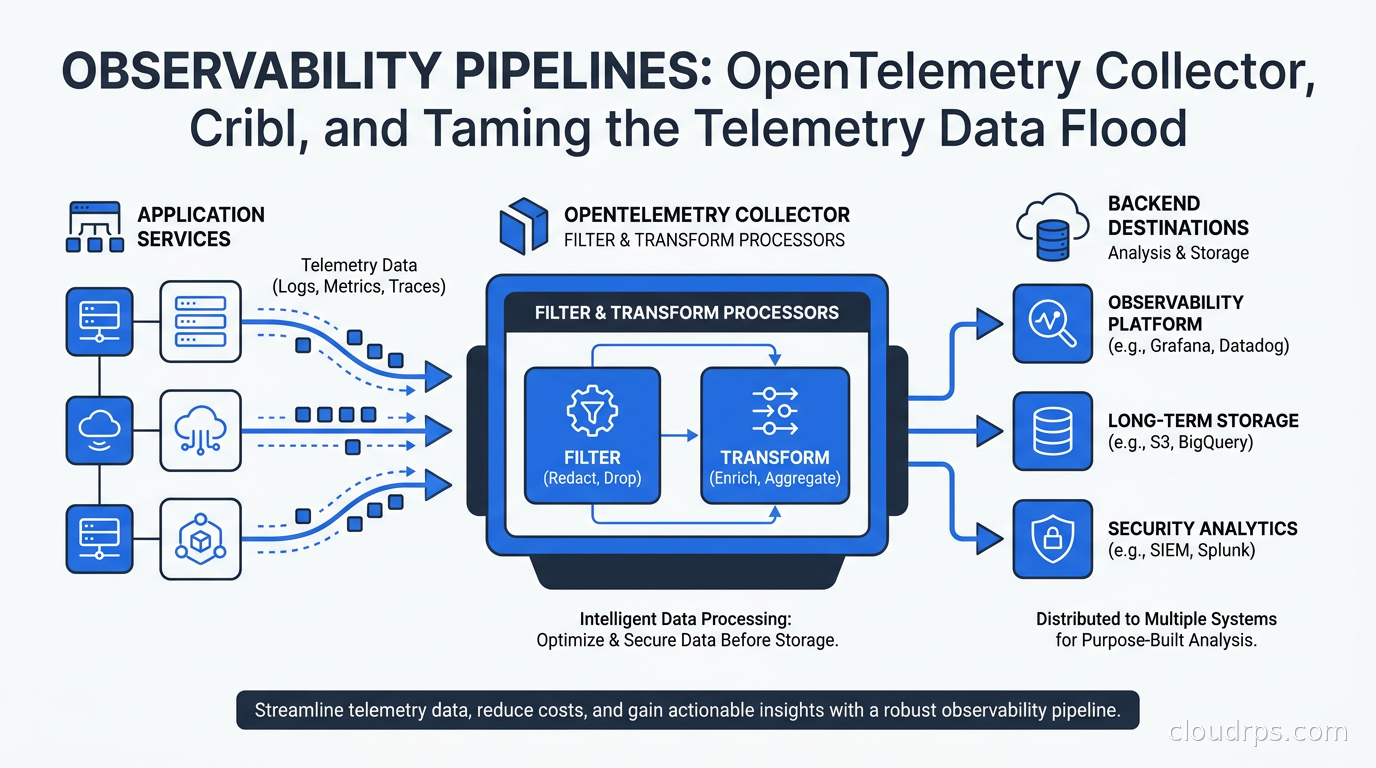
How to build observability pipelines with the OpenTelemetry Collector, Cribl, and Vector to cut telemetry costs 60-80% without losing diagnostic visibility.
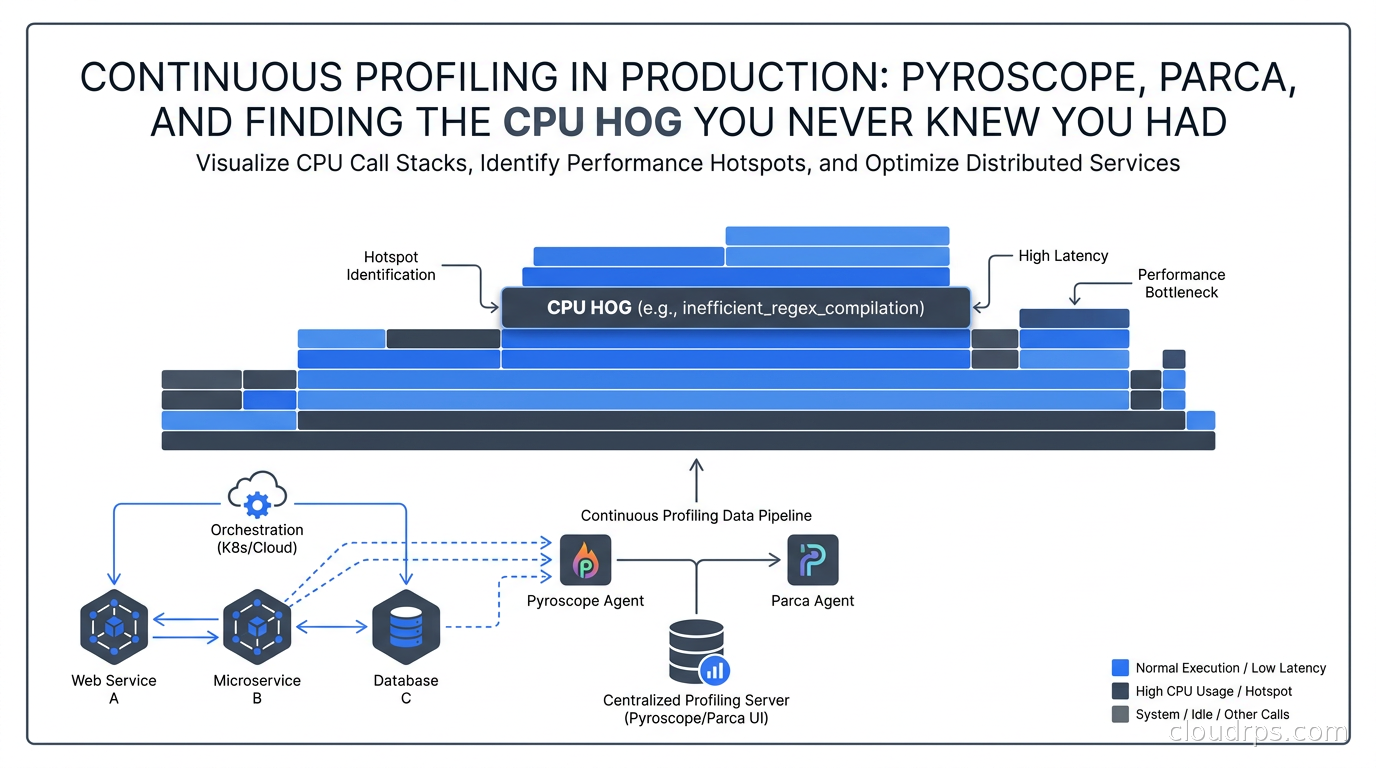
Continuous profiling is the fourth pillar of observability most teams skip. Learn how Pyroscope, Parca, and eBPF-based profilers find CPU and memory bottlenecks that metrics and traces can't.
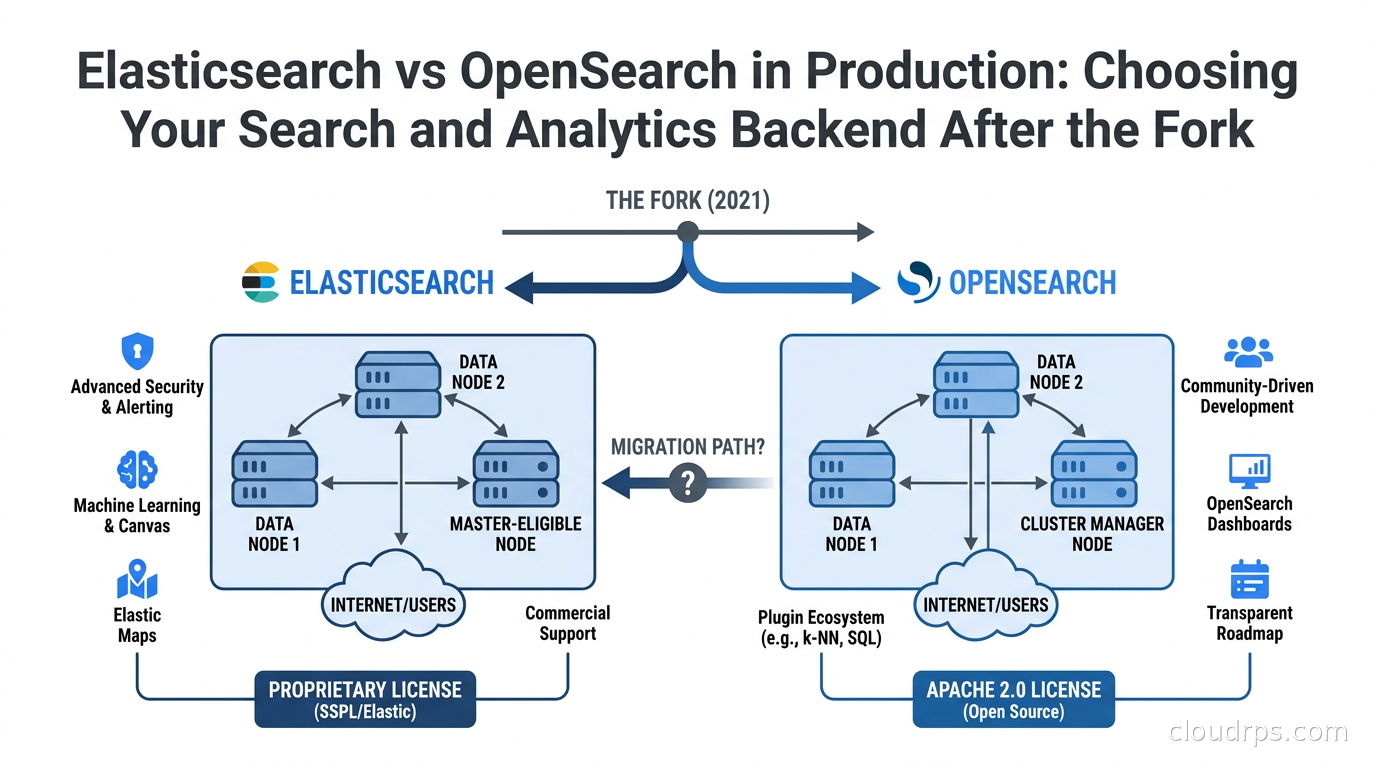
A practitioner's guide to choosing between Elasticsearch and OpenSearch for log analytics, full-text search, and vector workloads. Covers licensing, performance, AWS integration, and the AI search dimension.
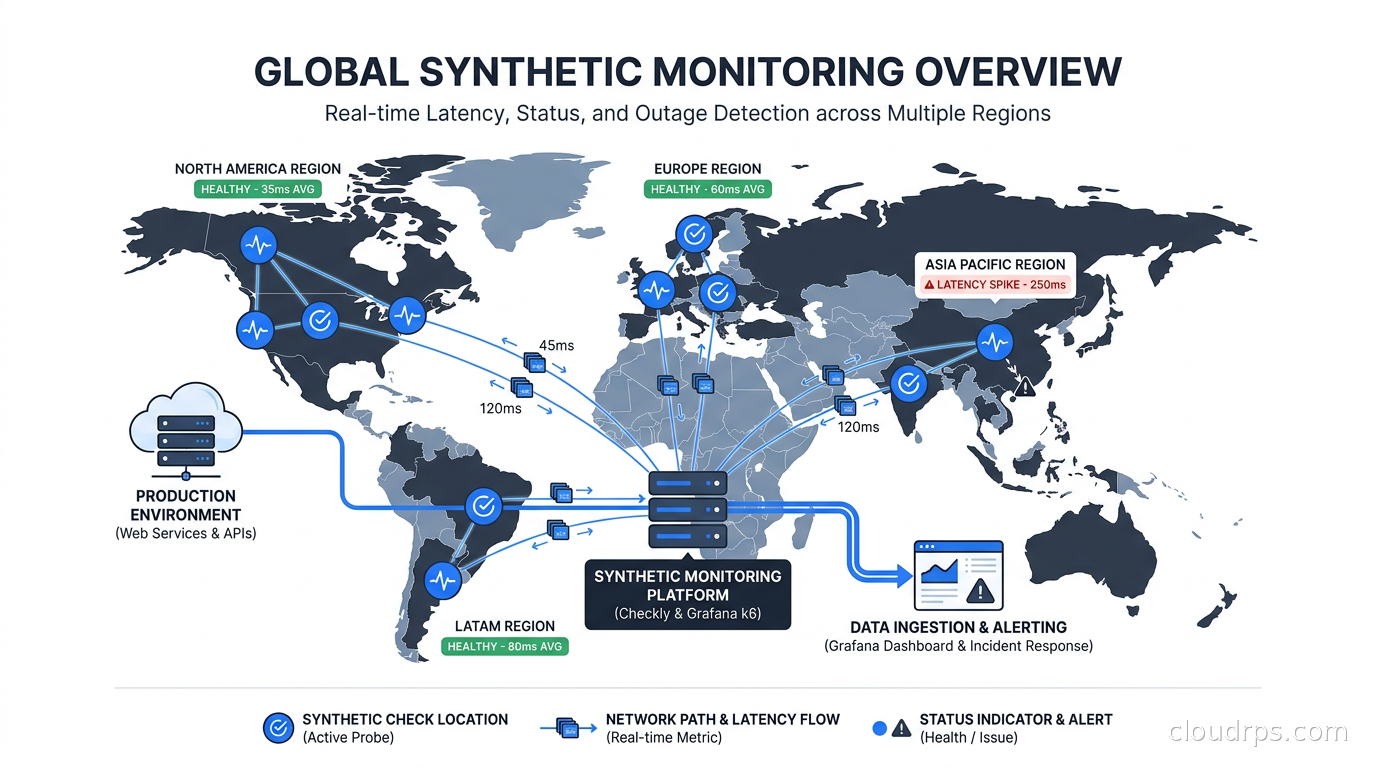
Synthetic monitoring lets you detect outages before users do. Learn how to build production-grade checks with Checkly and Grafana k6, integrate them with your SLOs, and stop finding out about failures from support tickets.
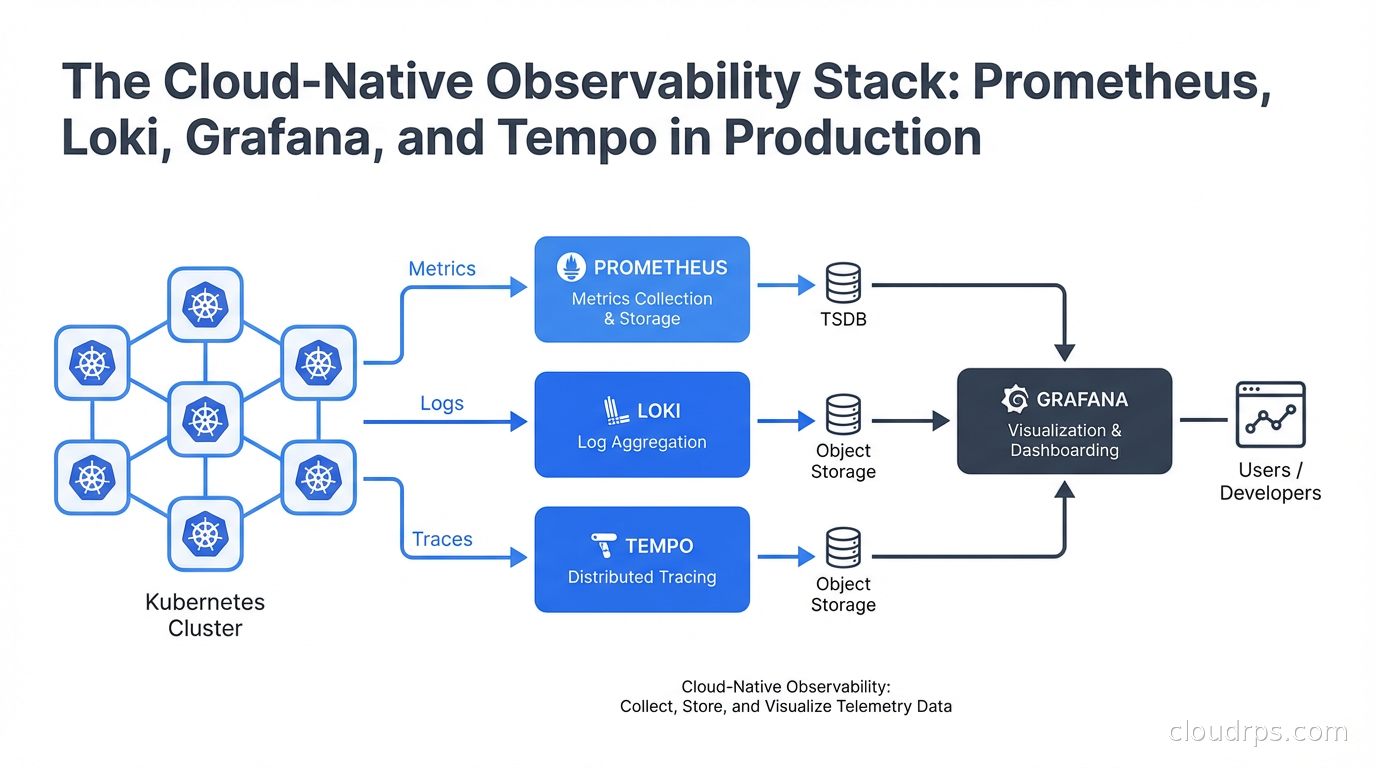
A deep-dive into building a production-grade observability stack with Prometheus, Loki, Grafana, and Tempo. Learn the architecture, scaling trade-offs, cardinality traps, and when the open-source stack beats a $40k/month SaaS bill.
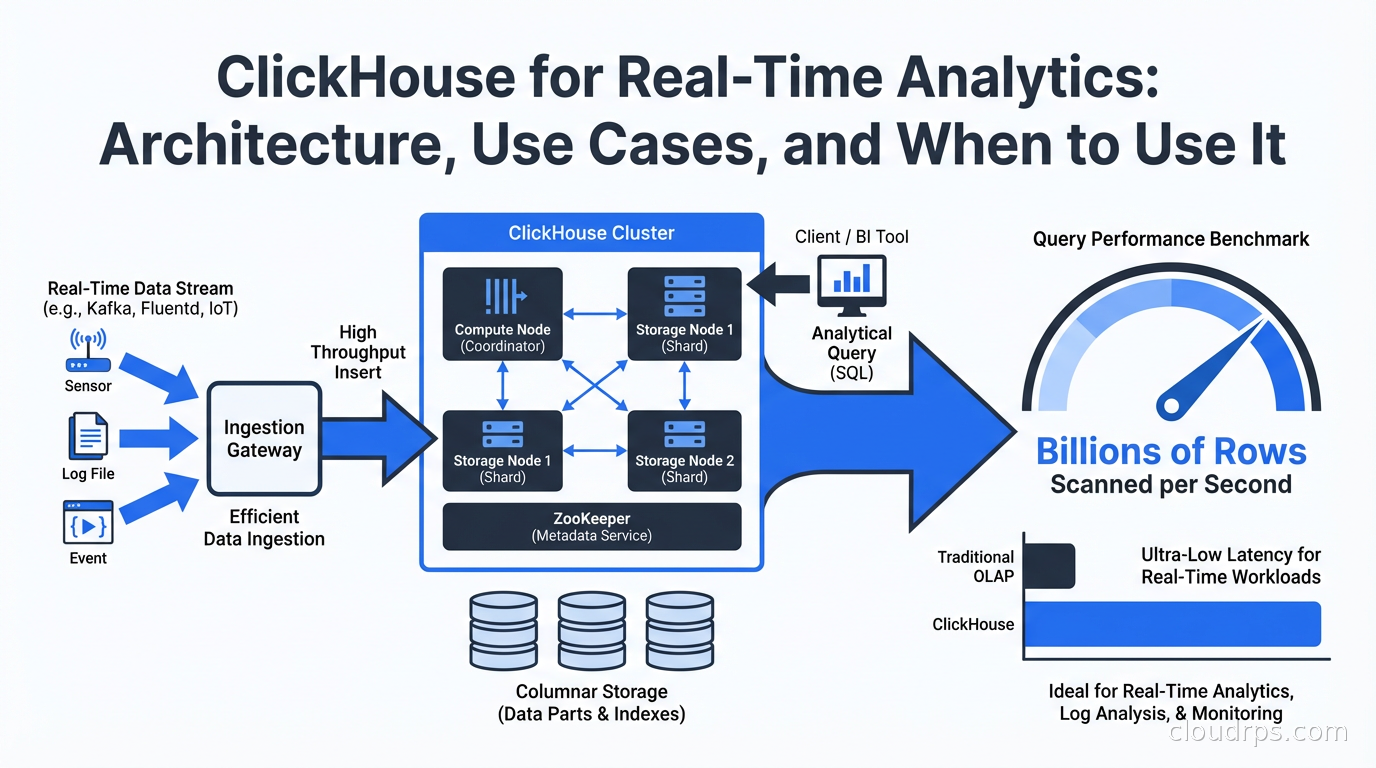
ClickHouse is a columnar database built for real-time analytics at absurd scale. Here's how it works, why it's faster than the alternatives, and where it fits in your data stack.
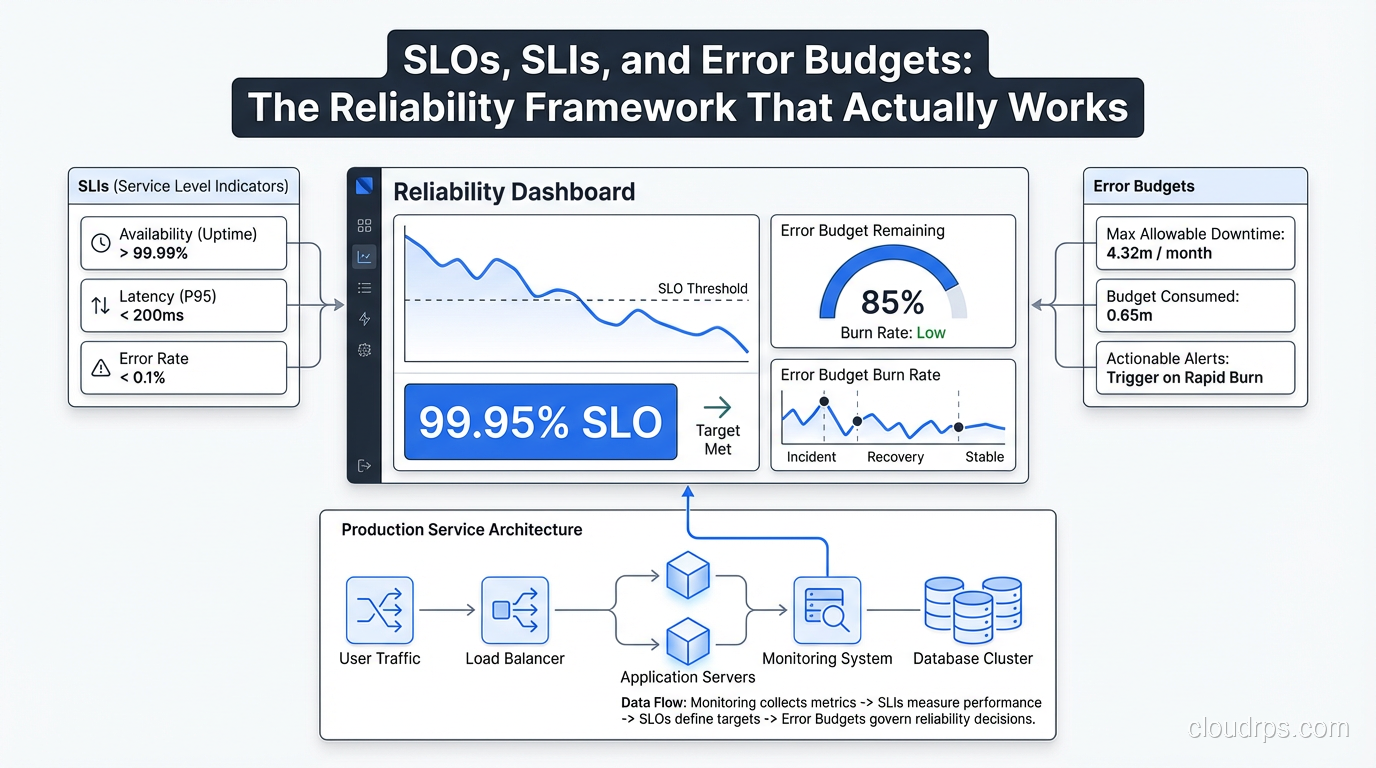
SLAs are for lawyers. SLOs are for engineers. Here's how to define meaningful service level objectives, measure them properly, and use error budgets to make smarter deployment decisions.
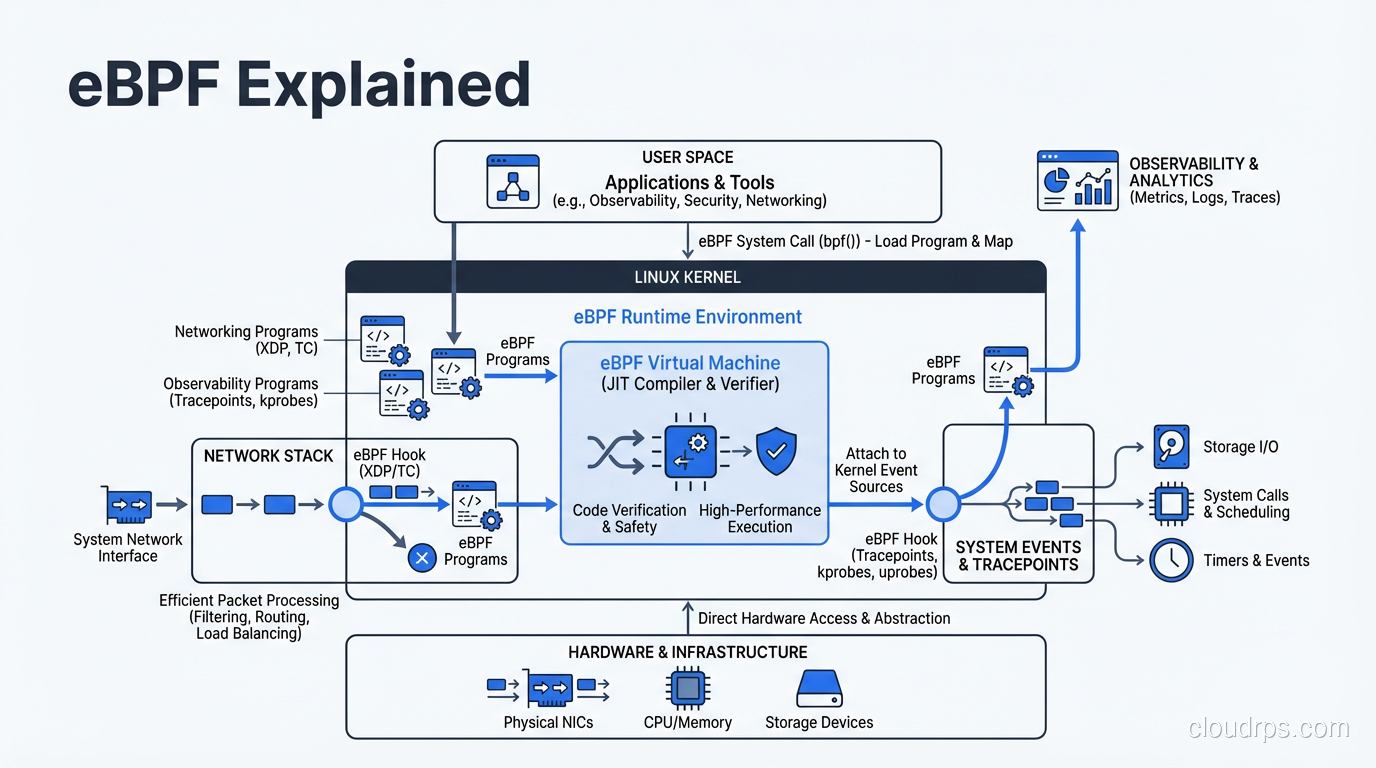
A practical guide to eBPF: how it works at the kernel level, why Cilium replaced iptables for Kubernetes networking, and how eBPF powers next-generation observability without sidecars.
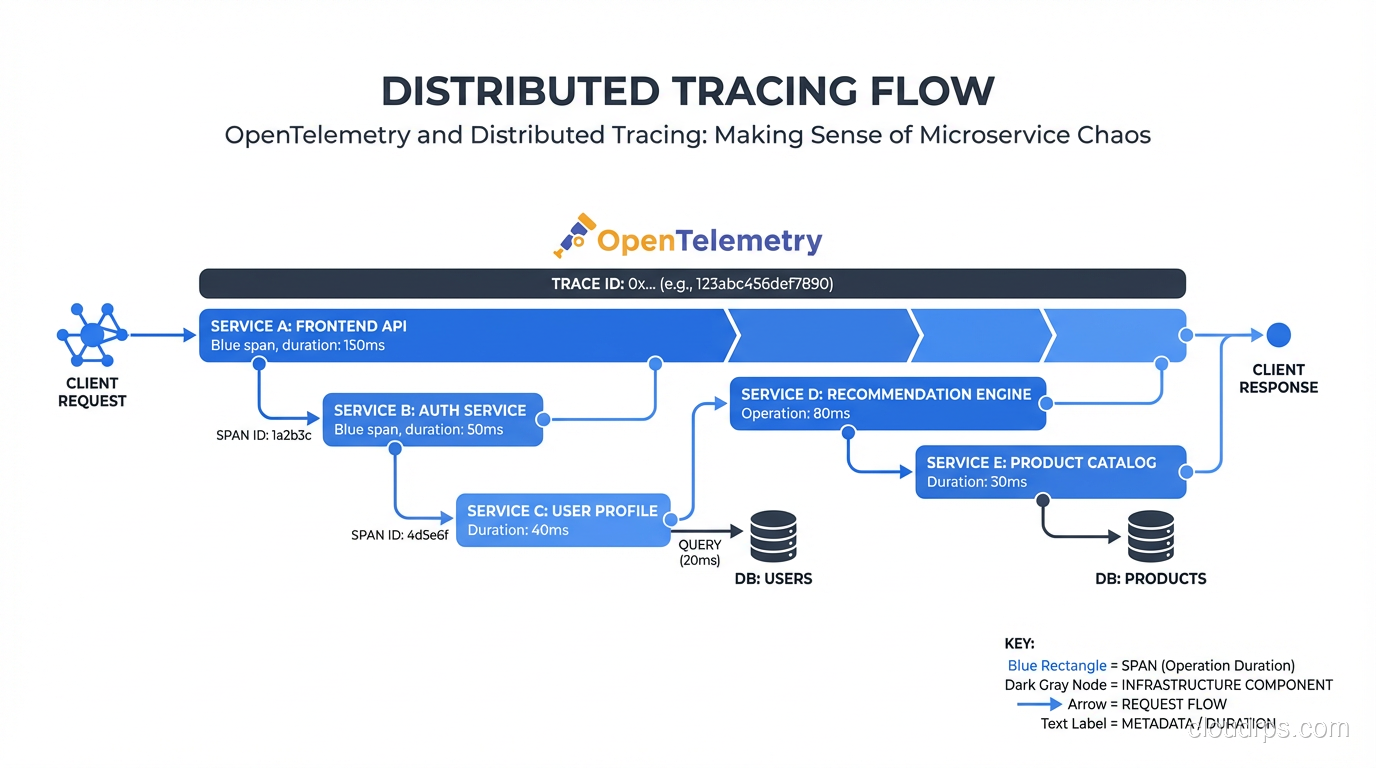
How OpenTelemetry works, why distributed tracing is different from logging and metrics, and how to instrument your services without drowning in overhead and noise.
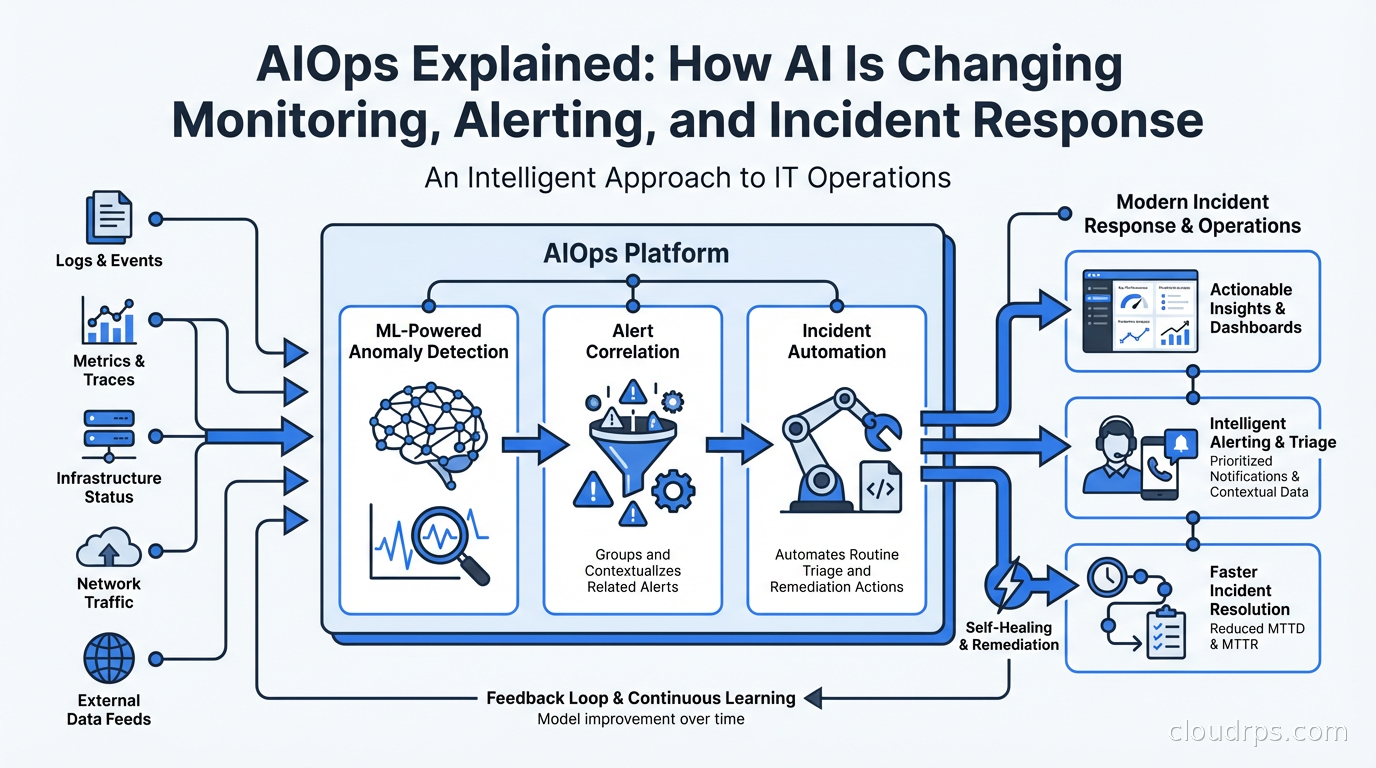
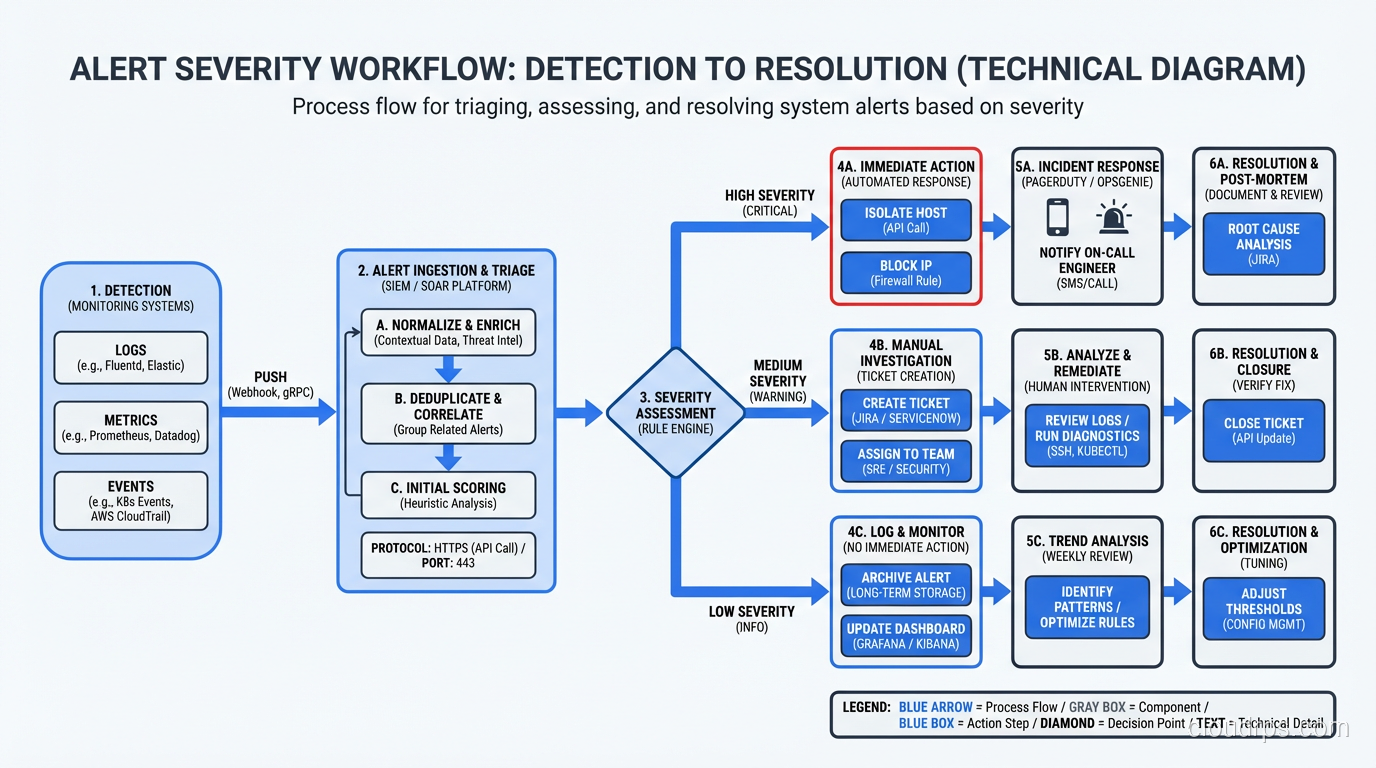
AIOps applies machine learning to operations data to reduce alert noise, detect anomalies, and accelerate incident response. Here's what works in practice and what's still hype.
Practical deep dives on infrastructure, security, and scaling. No spam, no fluff.
By subscribing, you agree to receive emails. Unsubscribe anytime.